

Abstract
Background
Hospitalization, critical illness, and infection have each been linked to cognitive decline and dementia. However, the degree to which these hospital events are associated with underlying brain abnormalities in older adults is less clear. Within the Atherosclerosis Risk in Communities Study (ARIC), we examined the association of hospitalization, critical illness, and infection occurring during middle- and late-life with structural brain abnormalities in older adults.
Methods
Active surveillance of local hospitals and annual participant contact were used to gather hospitalization information (including ICD-9 codes) on all ARIC participants over a 24-year surveillance period. Subsequently, a subset of participants underwent a 3T brain MRI to quantify total and regional brain volumes, white matter hyperintensity (WMH) volume, and white matter microstructural integrity (fractional anisotropy [FA] and mean diffusivity [MD] as measured by diffusion tensor imaging [DTI]).
Results
Of the 1,689 participants included (age at MRI: 76[5]), 72% were hospitalized, 4% had a critical illness, and 14% had a major infection during the surveillance period. Using covariate-adjusted regression, hospitalization, compared to no hospitalization, was associated with 0.12 standard deviation (SD) greater WMH volume (95% CI: 0.00, 0.24) and poorer white matter microstructural integrity (0.17 SD lower FA [CI: −0.27, −0.06] and 0.16 SD greater MD [CI: 0.07, 0.25]). There was a dose-dependent relationship between number of hospitalizations, smaller brain volumes, and lower white matter integrity (p-trends ≤0.048). Among hospitalized participants, critical illness was associated with a smaller Alzheimer’s disease Signature Region (−1.64 cm3, CI: −3.16, −0.12); major infection was associated with both a smaller Alzheimer’s disease Signature Region (−1.28 cm3, CI: −2.21, −0.35) and a larger ventricular volume (3.79 cm3, CI: 0.81, 6.77).
Conclusions
Whereas all-cause hospitalization was primarily associated with lower white matter integrity, critical illness and major infection were associated with smaller brain volume, particularly within regions implicated in Alzheimer’s disease.
Keywords: Dementia, Alzheimer’s disease, Magnetic resonance imaging, Risk factor
INTRODUCTION
Accumulating evidence suggests that acute illness may play a significant and previously unrecognized role in promoting or accelerating neurodegenerative disease in older adults.1,2 Specifically, hospitalization,3 critical illness,4 and acute infection5 have each been linked to subsequent cognitive decline and incident dementia. However, the mechanism for these associations is poorly understood. One hypothesis is that events associated with hospitalization may initiate or exacerbate pathophysiological processes that underlie structural neurodegenerative changes, increasing the risk for cognitive and functional decline, and ultimately, dementia.
In support of this hypothesis, our group has previously published results from the Atherosclerosis Risk in Communities (ARIC) Study demonstrating a link between the occurrence of hospitalization over an 11-year period and both cognitive decline and increased ventricular size.1 However, participants in this initial study were generally younger than 75 years of age, the hospitalization surveillance period was relatively brief, and measures of white matter (WM) microstructural integrity were unavailable. Since this previous report,1 an older and significantly larger group of participants (some of whom contributed data to our prior paper) have returned for a 3T brain MRI as part of the ARIC Neurocognitive Study. This has allowed us to examine the effects of hospitalization, critical illness, and infection, occurring over a 24-year period, on the underlying brain structure of a biracial cohort of adults transitioning from midlife to older adulthood. Using a large sample of community-dwelling individuals, we tested the hypothesis that hospitalization, particularly for critical illness and major infection, is associated with smaller total and regional brain volume, greater white matter hyperintensity (WMH) volume, and lower WM microstructural integrity among older adults.
METHODS
Study population
We analyzed data from the ARIC Study, an ongoing community-based prospective study, which initially enrolled 15,792 participants between ages 45 and 64 from 1987-89 (Visit 1). Participants were selected from four U.S. communities: Washington County, MD; Forsyth County, NC; northwestern suburbs of Minneapolis, MN; and Jackson, MS.6 Participants underwent a baseline examination (Visit 1), and four additional in-person follow-up examinations (Visits 2-5; Figure 1). Structured interviews and medical examinations were conducted at each visit. ARIC Study protocols were approved by the Institutional Review Boards at each participating center. All participants gave written informed consent.
Figure 1.
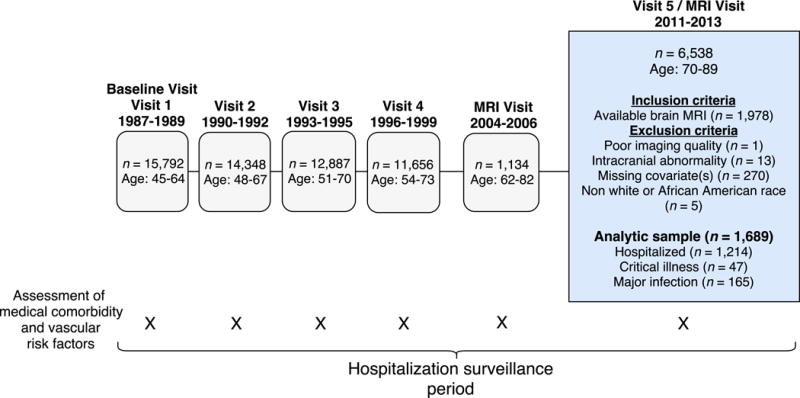
Study flow diagram and inclusion/exclusion criteria. Study visits, assessments, and participant numbers are tabulated.
A subset of participants (n=1,978) who attended Visit 5 received a brain MRI following their medical examination. See Supplementary Methods for the detailed MRI selection criteria. Briefly, we excluded all participants with MRI contraindications and selected all participants who participated in the Brain MRI Ancillary Study (2004-2006). All participants with evidence of cognitive impairment at Visit 5 (2011-13) and an age-stratified random sample of participants without cognitive impairment were also included.7 Additional study inclusion and exclusion criteria are described in Figure 1.
Measurement of hospitalization variables
Hospitalization events (yes/no, total number) were obtained from annual telephone contact with participants and active surveillance of local hospitals between Visits 1 and 5. Trained staff reviewed and abstracted all hospitalization discharge codes. Using ICD-9 codes, we applied a methodology described previously8 to identify the presence of critical illness during each hospitalization (yes/no). Critical illness was classified as any one of the following: shock, severe sepsis, acute respiratory failure, hypotension, respiratory or cardiac arrest, cardiopulmonary resuscitation, and prolonged ventilation. We also classified each hospitalization as including a major infection (yes/no) using ICD-9 codes for septicemia, bacterial infection, and pneumonia, as categorized by Clinical Classification Software. We also defined a second hospitalized infection variable, which included major and non-major infection, for exploratory purposes (Supplementary Methods).
Brain MRI
The acquisition sequence for the ARIC Visit 5 3T MRI has been described previously.7 At each ARIC site, a common set of sequences was performed for all participants: MP-RAGE, Axial T2*GRE, Axial T2 FLAIR, and Axial DTI. Brain volume was measured from MP-RAGE sequences using Freesurfer (http://surfer.nmr.mgh.harvard.edu).9 We evaluated total brain, ventricular, and Alzheimer’s disease (AD) Signature Region volumes. AD Signature Region was derived by calculating the combined volumes of the parahippocampal gyrus, entorhinal cortex, inferior parietal lobules, hippocampus, and precuneus.10 WMH volume (mm3) was assessed quantitatively from FLAIR images using a computer-aided segmentation program (FLAIR-histoseg).11 All analyses were adjusted for total intracranial volume. Fractional anisotropy (FA) and mean diffusivity (MD) of lobar WM were calculated from the DTI sequences, as has been described previously (see Supplementary Methods).12 Lower FA and higher MD are associated with poorer WM microstructural integrity. We used standardized measures of FA and MD for total brain WM.
Covariate Assessment
Participants’ race/center (white-MD/white-MN/white-NC/African American-NC/African American-MS), sex, and educational attainment (less than high school; high school/GED/vocational school; any college) were documented based on self-report (current/former/never). At baseline, body mass index (BMI) was calculated using recorded height and weight (kg/m2); total cholesterol and triglycerides were measured using the enzymatic method13; and high density lipoprotein (HDL) was calculated using dextran-magnesium precipitation.14 APOE was genotyped using the TaqMan assay (Applied Biosystems, Foster City, CA). Alcohol and cigarette use were documented at Visits 1 and 5 based on self-report (current/former/never).
The following were assessed at each study visit. Hypertension was defined as use of antihypertensive medication, or systolic or diastolic blood pressure >140 mm Hg and >90 mm Hg, respectively. Diabetes was defined as participant report of physician-diagnosed diabetes, current use of diabetes medication, or fasting glucose ≥126 mg/dl, or a non-fasting glucose of ≥200 mg/dl. Coronary heart disease (CHD) was adjudicated based on medical record documentation or participant self-report of previous myocardial infarction, coronary artery bypass graft or angioplasty, or myocardial infarction as determined by ECG. Heart failure was defined based on medical record evidence of heart failure-related hospitalizations or heart failure medication use within two weeks preceding the visit. Chronic Kidney Disease (CKD) was defined based on estimated glomerular filtration rate (GFR) calculated using serum creatinine and demographic characteristics.15 Prebronchodilator spirometry values were used to define chronic obstructive pulmonary disease (COPD).16 Cancer diagnosis was determined using information from cancer registries and ARIC hospital surveillance.17 Dementia was adjudicated by an expert committee based on a review of each participant’s cognitive and functional status at Visit 5.18
Statistical analysis
Covariate-adjusted linear regression was used to examine the association of hospitalization variables (exposure) with continuous measures of brain volume and WM integrity (outcomes). WMH volume was log-transformed to correct for skewness. First, we compared participants with one or more hospitalization(s) to those with no hospitalization. Second, we examined the effect of multiple hospitalizations by dividing participants into groups based on the total number of hospitalizations (0, 1, 2-3, 4-5, ≥6) and comparing each group to the group with no previous hospitalizations. Among participants who had been hospitalized, we made the following comparisons: (1) critical illness vs. no critical illness, and (2) major hospitalized infection vs. no major infection. We used a hospitalized comparison group to separate the effect of critical illness and infection from that of hospitalization more generally. All analyses were adjusted for the following covariates: race/center, education, sex, age at MRI, APOE ε4 allele status (present/absent), baseline physiological variables (BMI, triglycerides, total cholesterol, HDL), smoking and alcohol use status and prevalent medical comorbidity (hypertension, diabetes, CHD, heart failure, CKD, and COPD) occurring before or during the follow-up period, up to the time of MRI (Visit 5).
Regression analyses incorporated sampling weights to account for the ARIC Visit 5 brain MRI sampling strategy. Therefore, the results presented represent estimates based on the entire ARIC Visit 5 population. We conducted several sensitivity analyses. To examine the potential for reverse causation, we repeated analyses after omitting participants with incident dementia and those who scored below the 5th percentile on a midlife (Visit 2) measure of global cognitive status. We also repeated analyses after omitting participants with clinical stroke before Visit 5. Lastly, as an alternative method to control for confounding while mitigating bias related to differential attrition, we calculated propensity scores19 for attrition and for each hospitalization event, used these propensity scores to match and compare participants from distinct exposure groups, and incorporated propensity scores as covariates in fully-adjusted regression models (Supplementary Methods).20 A two-sided p-value <.05 was used as the cutoff for statistical significance. All analyses were conducted using Stata Version 14 (StataCorp, College Station, Tex., USA).
RESULTS
We analyzed data from 1,689 participants with a baseline age of 52.7 (SD 5.2), 60% women, and 28% African American. The average time between Visit 1 and the brain MRI (Visit 5) was 24 years (SD 1). At Visit 5 (mean age: 76.3 [SD 5.3]), 5% of participants met criteria for dementia. Seventy-two percent (n=1,214) of participants were hospitalized within the follow-up period. Compared to participants who were not hospitalized during the follow-up period, participants who were hospitalized had higher BMIs, lower diastolic blood pressure, cholesterol, and LDL, were more likely to use cholesterol lowering medication, and had a greater rate of medical comorbidity at the time of MRI (Table 1).
Table 1.
Participant characteristics at Visit 5 (MRI Visit; 2011-13)
| Characteristic | No hospitalization before brain MRI (n = 475) |
Hospitalized before brain MRI (n = 1,214) |
|---|---|---|
| Demographic Variables | ||
| Age, mean (SD), y | 75.5 (5.1) | 76.6 (5.3) |
| Female, No. (%) | 295 (62.1) | 710 (58.5) |
| African American | 139 (29.3) | 332 (27.4) |
| Education (%) | ||
| Less than high school | 55 (11.6) | 175 (14.4) |
| High school/GED/vocational | 203 (42.7) | 494 (40.7) |
| College/graduate/professional | 217 (45.7) | 545 (44.9) |
| Apolipoprotein E ε4 alleles | ||
| 0 | 343 (72.2) | 860 (70.8) |
| 1 | 124 (26.1) | 317 (26.1) |
| 2 | 8 (1.7) | 37 (3.1) |
| Physiological & Lab Variables | ||
| Body mass index, kg/m2 a | 27.9 (5.2) | 28.6 (5.8) |
| Systolic blood pressure, mm Hg | 131.9 (17.7) | 130.6 (18.0) |
| Diastolic blood pressure, mm Hg a | 67.4 (10.2) | 66.0 (10.6) |
| Total cholesterol, mg/dl a | 188.0 (39.7) | 181.6 (43.1) |
| HDL, mg/dl | 53.8 (13.8) | 52.9 (14.7) |
| LDL, mg/dl a | 109.3 (32.9) | 103.7 (35.0) |
| Triglycerides, mg/dl | 124.3 (61.0) | 125.1 (64.8) |
| Medication | ||
| Anti-inflammatory (regular use) | 65 (13.8) | 186 (15.4) |
| Cholesterol lowering (last 4 weeks) a | 225 (47.8) | 689 (56.8) |
| Cigarette Smoking Status | ||
| Current | 26 (5.5) | 60 (4.9) |
| Former | 232 (48.8) | 630 (51.9) |
| Never | 217 (45.7) | 524 (43.2) |
| Alcohol consumption | ||
| Current | 243 (51.2) | 550 (45.3) |
| Former | 127 (26.7) | 369 (30.4) |
| Never | 105 (22.1) | 295 (24.3) |
| Prevalent Medical Comorbidity b | ||
| Hypertension a | 339 (71.4) | 932 (76.8) |
| Diabetes mellitus a | 128 (27.0) | 441 (36.3) |
| Coronary heart disease a | 3 (0.6) | 162 (13.3) |
| Heart Failure a | 3 (0.6) | 50 (4.1) |
| Cancer a | 7 (1.5) | 44 (3.6) |
| Chronic Obstructive Pulmonary Disease | 19 (4.0) | 47 (3.9) |
| Chronic Kidney Disease a | 104 (21.9) | 341 (28.1) |
| Stroke a | 1 (0.2) | 55 (4.5) |
Groups were compared using t-tests and chi-square tests.
Values are displayed as means (SD) for continuous variables, and frequency (column percentages) for categorical variables.
p < .05 for difference between the hospitalization and non-hospitalization group
Hospitalization and late-life MRI variables
Participants with one or more hospitalization displayed greater WMH volume and lower WM microstructural integrity (FA and MD values), but not smaller brain volume (Table 2), compared to participants with no hospitalization, even after omitting participants with critical illness and major infection. These findings were largely unchanged in magnitude and direction in analyses that excluded participants with incident dementia, midlife cognitive impairment, and clinical stroke (Supplementary Tables 1-3). We found a dose-dependent relationship between the number of hospitalizations and greater WMH volume, lower WM microstructural integrity, and smaller total and regional brain volumes (Figure 2, Table 3; see also Supplementary Table 4 and Supplementary Figure 1). While significantly lower WM integrity was observed among individuals with two to three hospitalizations, significantly smaller brain volumes were only detectable among participants with four to five hospitalizations.
Table 2.
The association of hospitalization, critical illness, and major infection with late-life brain MRI measures of white matter integrity and brain volume
| White Matter Integrity | ||||||
|---|---|---|---|---|---|---|
|
| ||||||
| MRI Characteristics (Visit 5) |
Hospitalization (72%) vs. no hospitalization (n = 1,683) |
Critical illness hospitalization (4%) vs. non-critical illness hospitalization (n = 1,208) |
Hospitalization with major infection (14%) vs. hospitalization without (n = 1,208) |
|||
|
| ||||||
| β (95% CI) a | p | β (95% CI) a | p | β (95% CI) a | p | |
| WMH volume (log), SD | 0.12 (0.00, 0.24) | .047 | 0.14 (−0.14, 0.43) | .335 | −0.05 (−0.21, 0.11) | .535 |
| Total fractional anisotropy, SD | −0.17 (−0.27, −0.06) | .003 | −0.01 (−0.39, 0.36) | .941 | 0.06 (−0.11, 0.23) | .487 |
| Total mean diffusivity, SD | 0.16 (0.07, 0.25) | <.001 | 0.20 (−0.11, 0.51) | .207 | 0.03 (−0.14, 0.20) | .717 |
|
| ||||||
| Brain Volume | ||||||
|
| ||||||
| MRI Characteristics (Visit 5) |
Hospitalization (72%) vs. no hospitalization (n = 1,686) |
Critical illness hospitalization (4%) vs. non-critical illness hospitalization (n = 1,211) |
Hospitalization with major infection (14%) vs. hospitalization without (n = 1,211) |
|||
|
| ||||||
| β (95% CI) a | p | β (95% CI) a | p | β (95% CI) a | p | |
|
| ||||||
| Total brain volume, cm3 | −5.41 (−11.60, 0.78) | .087 | −9.69 (−26.61, 7.24) | .262 | −7.23 (−17.75, 3.29) | .178 |
| Ventricular volume, cm3 | 0.50 (−1.34, 2.35) | .592 | 3.37 (−1.76, 8.50) | .198 | 3.79 (0.81, 6.77) | .013 |
| AD Sig. Region volume, cm3 b | 0.07 (−0.47, 0.62) | .791 | −1.64 (−3.16, −0.12) | .034 | −1.28 (−2.21, −0.35) | .007 |
Analyses were adjusted for age, sex, race-center, education, APOE ε4 status, cigarette smoking and alcohol use status, BMI, total cholesterol, HDL, triglycerides, prevalent medical comorbidity (i.e., hypertension, diabetes, coronary heart disease, heart failure, CKD, COPD, and cancer) and Visit 5 intracranial volume.
β represents the estimated mean difference between groups being compared, after adjusting for potential confounders.
The difference in AD Signature Region volume associated with the possession of each additional APOE ε4 allele was −0.77 cm (95% CI: −1.27, −0.27) in a model that included same set of covariates.
AD Sig. Region = Alzheimer’s disease signature region; CI = confidence interval; SD = standard deviation; WMH = white matter hyperintensity
Figure 2.
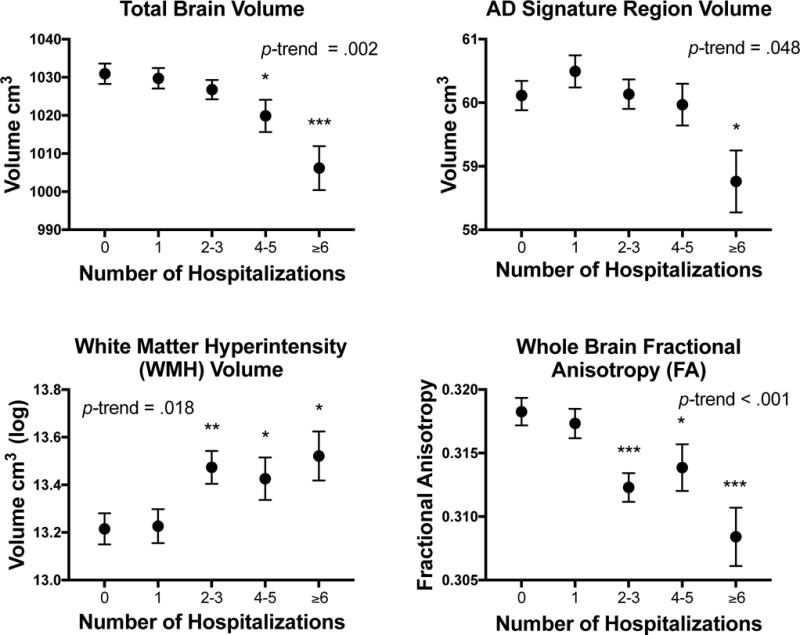
Brain volume and white matter integrity according to the number of hospitalizations. Values represent estimates from fully-adjusted linear regression models.
* p < .05; ** p < .01; *** p < .001 compared to the no hospitalization group.
Table 3.
The association of number of hospitalizations with total and regional brain volume and white matter integrity
| Number of hospitalizations | Total brain volume, cm3 (n = 1,686) |
AD Sig. Region volume, cm3 (n = 1,686) |
WMH volume (log), SD (n = 1,683) |
Total fractional anisotropy, SD (n = 1,657) |
|---|---|---|---|---|
|
| ||||
| β (95% CI) a | β (95% CI) a | β (95% CI) a | β (95% CI) a | |
| No hospitalization | Reference | Reference | Reference | Reference |
| 1 hospitalization | −1.39 (−8.76, 5.97) | 0.38 (−0.28, 1.05) | 0.02 (−0.17, 0.21) | −0.04 (−0.17, 0.09) |
| 2-3 hospitalizations | −3.98 (−11.23, 3.27) | 0.07 (−0.57, 0.71) | 0.25 (0.07, 0.44) | −0.25 (−0.38, −0.12) |
| 4-5 hospitalizations | −11.13 (−21.05, −1.21) | −0.12 (−0.92, 0.67) | 0.22 (0.01, 0.44) | −0.18 (−0.36, −0.01) |
| ≥ 6 hospitalizations | −23.84 (−36.06, −11.62) | −1.27 (−2.33, −0.21) | 0.28 (0.04, 0.52) | −0.41 (−0.62, −0.19) |
Analyses were adjusted for age, sex, race-center, education, APOE ε4 status, cigarette smoking and alcohol use status, BMI, total cholesterol, HDL, triglycerides, prevalent medical comorbidity (i.e., hypertension, diabetes, coronary heart disease, heart failure, CKD, COPD, and cancer), and Visit 5 intracranial volume.
β represents the estimated mean difference between the hospitalization groups and the no hospitalization referent group after adjusting for potential confounders.
Critical illness and late-life MRI variables
Four percent (n=47) of hospitalized participants had one or more critical illness within the follow-up period. Compared to participants hospitalized for non-critical illness, participants hospitalized for critical illness did not differ on measures of WM integrity. However, participants with critical illness had 3% smaller AD Signature Region volumes (p<.05) (Table 2). In our regression model, the magnitude of the effect of critical illness on AD Signature Region volume was over twice that of a single APOE ε4 allele (see footnote in Table 2). No group differences were found on measures of total or ventricular volume. Associations between critical illness and brain volume were similar after excluding participants with midlife cognitive impairment and incident dementia, but were attenuated after omitting individuals with clinical stroke (Supplementary Tables 1-3).
Hospitalized infection and late-life MRI variables
Fourteen percent (n=165) of hospitalized participants had one or more major hospitalized infection. Compared to participants hospitalized with no major infection, participants with a major infection did not differ on measures WM integrity, but did demonstrate 2% smaller AD Signature Region volumes, and 10% larger ventricular volumes (p’s<.05) (Table 2). The magnitude of the effect of hospitalized infection on AD Signature Region volume was approximately 1.5 that of a single APOE ε4 allele. Findings were largely similar after excluding participants with midlife cognitive impairment, incident dementia, clinical stroke, and critical illness (Supplementary Tables 1-3 and 5). Infection, defined more broadly to include both major and non-major hospitalized infections (n=297), was associated with 6% greater ventricular volume, but was unrelated to AD Signature Region volume (Supplementary Table 6).
Sensitivity Analyses Using Propensity Score Methods
Our results were largely similar to those of the primary analyses with regard to statistical significance and direction of association, irrespective of whether propensity score matching or propensity score covariate adjustment was used (Supplementary Tables 7 & 8). However, several of the coefficients derived from propensity score-matched analyses were comparatively larger in magnitude.
DISCUSSION
Using a community-based prospective study, we have shown that all-cause hospitalization, critical illness, and infection are each associated with evidence of MRI-defined structural brain abnormalities in a large sample of older adults. Specifically, participants with one or more hospitalization during a 24-year surveillance period spanning from middle to late-life who survived into older adulthood demonstrated greater WMH volume and reduced WM microstructural integrity as older adults. We also found evidence for a dose-dependent relationship between the number of hospitalizations and late-life MRI measures. While significant reductions in total and regional brain volume were observed only among participants with four or more hospitalizations, reductions in WM integrity were found among participants with as few as two hospitalizations. Among participants who were hospitalized, those who experienced a critical illness and/or a major infection had smaller brain volumes in regions vulnerable to AD in late life. The estimated effects of critical illness and infection on these brain regions was approximately 2 and 1.5 times that of a single APOE ε4 allele, respectively. To provide context, a single APOE ε4 allele is associated with a 3-fold increase in AD risk, and an age of AD onset that is 10 years earlier than that of older adults without an APOE ε4 allele.21 Importantly, our findings were observed after adjusting for demographic and physiological variables, medical comorbidity, and APOE genotype, and remained after demented participants were excluded.
In addition to replicating and extending previous findings linking all-cause hospitalization to reductions in WM integrity and brain volume,1 the current results build upon those of previous studies, which have identified critical illness22 and infection2,23 as risk factors for incident dementia. WM abnormalities and brain volume loss represent markers of pathological brain changes that are more proximal to the pathophysiology underlying cognitive decline and dementia. Thus, our findings lend support to the idea that critical illness and infection promote neurodegenerative brain changes, which may, in turn, set the stage for late-life cognitive and functional decline. Loss of brain volume in Alzheimer’s disease relevant regions presumably reduces the threshold at which AD pathology induces overt clinical symptoms. The effects of critical illness on brain volume may be partially accounted for by stroke, as the magnitude of these associations was attenuated after excluding stroke cases. On the other hand, the association of major infection with smaller brain volume was independent of stroke and critical illness. Infection, even when broadly defined to include mild or non-life-threatening infections, was associated with brain volume loss, albeit to a lesser extent than major infection. Although participants with one or more hospitalization demonstrated greater WMH volume and DTI diffusion abnormalities compared to those who were not hospitalized, we did not find evidence for the emergence of additional WM abnormalities attributable to critical illness or infection.
The current study is unique in that it compared participants with critical illness and infection to a hospitalized control group, allowing us to parse out the neurologic sequelae associated with each of these exposure variables from that of hospitalization more broadly. Additionally, the current study had a relatively long follow-up period, which allowed us to capture hospitalization events and incident medical comorbidity over a two- to three-decade period beginning in midlife. This is of importance given that (1) the neurodegenerative processes that may be influenced by our hospitalization variables are suspected to begin during midlife and gradually evolve over decades,24 and (2) the midlife disease and vascular risk factors, which increase the risk of hospitalization, have also been associated with late-life neurodegenerative changes.25 Thus, the extended study design allowed us to adjust for midlife risk factors and incident medical comorbidity to reduce the likelihood of confounding. Our findings are further supported by a series of sensitivity analyses which used propensity score methods to address confounding while also adjusting for bias related to informative censoring.
Hospitalization, critical illness, and infection may contribute to neurodegenerative brain changes by promoting inflammation in the periphery and the central nervous system (CNS). Infection and tissue damage both result in the induction of pro-inflammatory mediators throughout the body.26,27 Systemic inflammation has been associated with reductions in brain volume28 and WM integrity29 and is believed to contribute to neuronal and glial dysfunction by promoting neuroinflammation and Alzheimer’s pathology,30 blood-brain barrier dysfunction,31 and changes in cerebral metabolism.32 Additional factors associated with hospitalization, such as delirium4 and iatrogenic medication effects33, may also explain the associations observed in the present study. However, caution must be exercised in making causal inferences from the current findings, as there are alternative plausible explanations. For example, cognitive decline may place individuals at greater risk for hospitalization, infection, and critical illness34; however, this is unlikely to explain the current results, as our findings did not change after excluding individuals with incident dementia or midlife cognitive impairment. Alternatively, hospitalization may be an indicator of a multi-system aging phenotype (e.g., frailty), which itself may promote structural brain abnormalities.
The current study has several strengths, including the use of a large community sample, a relatively long follow-up and surveillance period, a rigorous assessment of medical comorbidity, and the use of a hospitalized control group. However, there are several limitations. First, because we relied on ICD-9 codes rather than chart reviews to identify critical illness and infection, our analyses may be subject to exposure misclassification. However, ICD-9 codes have been shown to identify such variables with a high level of sensitivity.35 Second, our analyses are limited by a lack of information about potentially relevant hospital events, such as delirium. Third, without baseline brain MRIs, it is impossible to be certain that hospitalization events predated reductions in brain volume and WM integrity. Fourth, our analysis of multiple outcome variables increases the likelihood of type-1 error. Therefore, replication will be necessary to corroborate the current findings. Last, despite our attempts to account for bias using multivariable regression and propensity score methods, our results may still be subject to bias related to differential rates of death and study dropout (i.e., informative censoring; Supplementary Table 9) and residual confounding from indication bias or unmeasured variables. In particular, an increased rate of attrition among participants with more hospitalization events, major infection, and critical illness may have biased the findings in favor of the null hypothesis. Despite these limitations, our findings provide insight into the previously described link between hospitalization, critical illness, infection, and dementia. By demonstrating an association between hospitalized events and abnormalities in brain structure, our results highlight the potential role of hospitalization, critical illness, and infection in the pathological processes underlying cognitive decline and neurodegenerative disease.
Supplementary Material
Methods S1. Description of hospitalized infection variables.
Methods S2. Diffusion tensor imaging methods.
Methods S3. Selection of participants for brain MRI.
Methods S4. Summary of methods for propensity score analyses.
Table S1. The association between hospitalization variables and late-life brain MRI values among non-demented participants.
Table S2. The association between hospitalization variables and late-life brain MRI values after omitting participants with midlife cognitive impairment.
Table S3. The association between hospitalization variables and late-life brain MRI values among participants without clinical stroke before Visit 5.
Table S4. Association of total number of hospitalizations with ventricular volume and mean diffusivity.
Table S5. The association between hospitalized major infection and late-life brain MRI values among participants who were not hospitalized for critical illness.
Table S6. The association between hospitalized infection (major and non-major) and late-life brain MRI values.
Table S7. Paired sample t tests comparing 1:1 propensity score-matched samples on late-life brain MRI values.
Table S8. The association between hospitalization variables and late-life brain MRI values using propensity score covariate adjustment.
Table S9. Baseline (Visit 1, 1987-89) participant characteristics and hospitalization variables stratified according to Visit 5 (2011-13) attendance, study dropout, and death before Visit 5.
Figure S1. Brain volume and white matter integrity according to the number of hospitalizations.
IMPACT STATEMENT.
We certify that this work is both novel and confirmatory.
-
Below, we have cited the relevant research that our work confirms and expands upon.
Brown CH, Sharrett AR, Coresh J, et al. Association of hospitalization with long-term cognitive and brain MRI changes in the ARIC cohort. Neurology 2015;84(14):1443-1453. doi:10.1212/WNL.0000000000001439.
To our knowledge, this is first large prospective cohort study to demonstrate that critical illness and infection during middle- and late-life are independently associated with the structural brain abnormalities underlying cognitive decline and Alzheimer’s disease in older adults. We confirm and expand upon a previous study using this cohort, which reported a relationship between all-cause hospitalization and lower brain volume in a smaller and younger group of participants.
Acknowledgments
The authors thank the staff and participants of the ARIC study for their important contributions.
Funding
This work was supported by National Heart, Lung, and Blood Institute contracts (grant numbers HHSN268201100005C, HHSN268201100006C, HHSN268201100007C, HHSN268201100008C, HSN268201100009C, HHSN268201100010C, HHSN268201100011C, and HHSN268201100012C). Neurocognitive data collection is supported by the National Heart, Lung, and Blood Institute and the National Institute of Neurological Disorders and Stroke (grant numbers U01 HL096812, HL096814, HL096899, HL096902, HL096917), with previous brain MRI examinations funded by the National Heart, Lung, and Blood Institute (grant number R01-HL70825). This study was also supported by grants from the National Institute on Aging (AG027668 to KAW) and (AG052573 to RFG). Support for the statistical analysis was provided by the National Center for Research Resources and the National Center for Advancing Translational Sciences (NCATS) of the National Institutes of Health (grant number 1UL1TR001079).
Sponsor’s Role: Sponsor played no role in the design, methods, subject recruitment, data collection, analysis, or preparation of the manuscript.
Footnotes
Conflict of Interest: RFG serves as Associate Editor for Neurology® and receives research support from NIH. DSK serves on a Data Safety Monitoring Board for the DIAN study; is an investigator in clinical trials sponsored by Biogen, Lilly Pharmaceuticals and the University of Southern California; and receives research support from the NIH. CB has consulted for and participates in a data-sharing agreement with Medtronic. The other authors declare no competing interests. KAW, AW, THM, AA, and AK-N have no conflicts of interest.
Author Contribution: Drafting or revising the manuscript for content: KAW, RFG, AW, DSK, THM, AA, AK-N, and CHB. Study concept or design: KAW, RFG, and CHB. Interpretation of data: KAW, RFG, AW, DSK, THM, AA, AK-N, and CHB. Statistical analysis: KAW and AW. Study supervision or coordination: RFG and DSK. Obtaining funding: RFG.
SUPPORTING INFORMATION
Additional Supporting Information may be found in the online version of this article.
References
- 1.Brown CH, Sharrett AR, Coresh J, et al. Association of hospitalization with long-term cognitive and brain MRI changes in the ARIC cohort. Neurology. 2015;84(14):1443–1453. doi: 10.1212/WNL.0000000000001439. [DOI] [PMC free article] [PubMed] [Google Scholar]
- 2.Tate JA, Snitz BE, Alvarez KA, et al. Infection hospitalization increases risk of dementia in the elderly. Crit Care Med. 2014;42(5):1037–1046. doi: 10.1097/CCM.0000000000000123. [DOI] [PMC free article] [PubMed] [Google Scholar]
- 3.Wilson RS, Hebert LE, Scherr PA, Dong X. Cognitive decline after hospitalization in a community population of older persons. Neurology. 2012;78:950–956. doi: 10.1212/WNL.0b013e31824d5894. [DOI] [PMC free article] [PubMed] [Google Scholar]
- 4.Pandharipande PP, Girard TD, Jackson JC, et al. Long-term cognitive impairment after critical illness. N Engl J Med. 2013;369(14):1306–1316. doi: 10.1056/NEJMoa1301372. [DOI] [PMC free article] [PubMed] [Google Scholar]
- 5.Iwashyna TJ, Ely EW, Smith DM, Langa KM. Long-term Cognitive Impairment and Functional Disability Among Survivors of Severe Sepsis. Jama. 2010;304(16):1787–1794. doi: 10.1001/jama.2010.1553. [DOI] [PMC free article] [PubMed] [Google Scholar]
- 6.The ARIC Investigators. The Atherosclerosis Risk in Communities (ARIC) Study: design and objectives. The ARIC investigators. Am J Epidemiol. 1989;129(4):687–702. [PubMed] [Google Scholar]
- 7.Knopman DS, Griswold ME, Lirette ST, et al. Vascular Imaging abnormalities and cognition: Mediation by cortical volume in nondemented individuals: Atherosclerosis risk in communities-neurocognitive study. Stroke. 2015;46(2):433–440. doi: 10.1161/STROKEAHA.114.007847. [DOI] [PMC free article] [PubMed] [Google Scholar]
- 8.Ehlenbach WJ, Crane PK, Haneuse SJPA, Carson SS, Curtis JR, Larson EB. Association between acute care and critical illness hospitalization and cognitive function in older adults. JAMA. 2010;303(8):763–770. doi: 10.1001/jama.2010.167. [DOI] [PMC free article] [PubMed] [Google Scholar]
- 9.Fischl B, Salat DH, Busa E, et al. Whole brain segmentation: Automated labeling of neuroanatomical structures in the human brain. Neuron. 2002;33(3):341–355. doi: 10.1016/S0896-6273(02)00569-X. [DOI] [PubMed] [Google Scholar]
- 10.Dickerson BC, Stoub TR, Shah RC, et al. Alzheimer-signature MRI biomarker predicts AD dementia in cognitively normal adults. Neurology. 2011;76(16):1395–1402. doi: 10.1212/WNL.0b013e3182166e96. [DOI] [PMC free article] [PubMed] [Google Scholar]
- 11.Raz L, Jayachandran M, Tosakulwong N, et al. Thrombogenic microvesicles and white matter hyperintensities in postmenopausal women. Neurology. 2013;80(10):911–918. doi: 10.1212/WNL.0b013e3182840c9f. [DOI] [PMC free article] [PubMed] [Google Scholar]
- 12.Power MC, Tingle JV, Reid RI, et al. Midlife and late life vascular risk factors and white matter microstructural integrity: the ARIC-NCS study. JAHA. 2017;18(6):e005608. doi: 10.1161/JAHA.117.005608. [DOI] [PMC free article] [PubMed] [Google Scholar]
- 13.Nägele U, Hägele EO, Sauer G, et al. Reagent for the Enzymatic Determination of Serum Total Triglycerides with Improved Lipolytic Efficiency. Clin Chem Lab Med. 1984;22(2):165–174. doi: 10.1515/cclm.1984.22.2.165. [DOI] [PubMed] [Google Scholar]
- 14.Warnick GR, Benderson J, Albers JJ. Dextran sulfate-Mg2+ precipitation procedure for quantitation of high-density-lipoprotein cholesterol. Clin Chem. 1982;28(6):1379–1388. [PubMed] [Google Scholar]
- 15.Muntner P, He J, Astor BC, Folsom AR, Coresh J. Traditional and Nontraditional Risk Factors Predict Coronary Heart Disease in Chronic Kidney Disease: Results from the Atherosclerosis Risk in Communities Study. J Am Soc Nephrol. 2005;16(2):529–538. doi: 10.1681/ASN.2004080656. [DOI] [PubMed] [Google Scholar]
- 16.Mannino DM, Doherty DE, Buist AS. Global Initiative on Obstructive Lung Disease (GOLD) classification of lung disease and mortality: Findings from the Atherosclerosis Risk in Communities (ARIC) study. Respir Med. 2006;100(1):115–122. doi: 10.1016/j.rmed.2005.03.035. [DOI] [PubMed] [Google Scholar]
- 17.Prizment AE, Folsom AR, Dreyfus J, et al. Plasma C-reactive protein, genetic risk score, and risk of common cancers in the Atherosclerosis Risk in Communities study. Cancer Causes Control. 2013;24(12):2077–2087. doi: 10.1007/s10552-013-0285-y. [DOI] [PMC free article] [PubMed] [Google Scholar]
- 18.Knopman DS, Gottesman RF, Sharrett AR, et al. Mild cognitive impairment and dementia prevalence: The Atherosclerosis Risk in Communities Neurocognitive Study. Alzheimer’s Dement Diagnosis, Assess Dis Monit. 2016;2:1–11. doi: 10.1016/j.dadm.2015.12.002. [DOI] [PMC free article] [PubMed] [Google Scholar]
- 19.Rosenbaum PR, Rubin DB. The central role of the propensity score in observational studies for causal effects. Biometrika. 1983;70(1):41–55. doi: 10.1093/biomet/70.1.41. [DOI] [Google Scholar]
- 20.Elze MC, Gregson J, Baber U, et al. Comparison of Propensity Score Methods and Covariate Adjustment: Evaluation in 4 Cardiovascular Studies. J Am Coll Cardiol. 2017;69(3):345–357. doi: 10.1016/j.jacc.2016.10.060. [DOI] [PubMed] [Google Scholar]
- 21.Corder E, Saunders A, Strittmatter W, et al. Gene dose of apolipoprotein E type 4 allele and the risk of Alzheimer’s disease in late onset families. Science (80-) 1993;261(5123):921–923. doi: 10.1126/science.8346443. [DOI] [PubMed] [Google Scholar]
- 22.Kao LT, Sheu JJ, Lin HC, Tsai MC, Chung SD. Association between sepsis and dementia. J Clin Neurosci. 2015;22(9):1430–1433. doi: 10.1016/j.jocn.2015.02.035. [DOI] [PubMed] [Google Scholar]
- 23.Tseng C-H, Huang W-S, Muo C-H, Kao C-H. Increased risk of dementia among chronic osteomyelitis patients. Eur J Clin Microbiol Infect Dis. 2015;34(1):153–159. doi: 10.1007/s10096-014-2200-1. [DOI] [PubMed] [Google Scholar]
- 24.Villemagne VL, Burnham S, Bourgeat P, et al. Amyloid β deposition, neurodegeneration, and cognitive decline in sporadic Alzheimer’s disease: A prospective cohort study. Lancet Neurol. 2013;12(4):357–367. doi: 10.1016/S1474-4422(13)70044-9. [DOI] [PubMed] [Google Scholar]
- 25.Power MC, Schneider ALC, Wruck L, et al. Life-course blood pressure in relation to brain volumes. Alzheimer’s and Dementia. 2016 Aug;:890–899. doi: 10.1016/j.jalz.2016.03.012. [DOI] [PMC free article] [PubMed] [Google Scholar]
- 26.Holub M, Lawrence DA, Andersen N, et al. Cytokines and chemokines as biomarkers of community-acquired bacterial infection. Mediators Inflamm. 2013;2013:1–7. doi: 10.1155/2013/190145. [DOI] [PMC free article] [PubMed] [Google Scholar]
- 27.Cannon JG, Tompkins RG, Gelfand JA, et al. Circulating interleukin-1 and tumor necrosis factor in septic shock and experimental endotoxin fever. J Infect Dis. 1990;161(1):79–84. doi: 10.1093/infdis/161.1.79. [DOI] [PubMed] [Google Scholar]
- 28.Walker KA, Hoogeveen RC, Folsom AR, et al. Midlife systemic inflammatory markers are associated with late-life brain volume: The ARIC study. Neurology. 2017;89(22) doi: 10.1212/WNL.0000000000004688. [DOI] [PMC free article] [PubMed] [Google Scholar]
- 29.Walker KA, Power MC, Hoogeveen RC, et al. Midlife Systemic Inflammation, Late-Life White Matter Integrity, and Cerebral Small Vessel Disease. Stroke. 2017 Nov; doi: 10.1161/STROKEAHA.117.018675. STROKEAHA.117.018675. [DOI] [PMC free article] [PubMed] [Google Scholar]
- 30.Sheng JG, Bora SH, Xu G, Borchelt DR, Price DL, Koliatsos VE. Lipopolysaccharide-induced-neuroinflammation increases intracellular accumulation of amyloid precursor protein and amyloid ?? peptide in APPswe transgenic mice. Neurobiol Dis. 2003;14(1):133–145. doi: 10.1016/S0969-9961(03)00069-X. [DOI] [PubMed] [Google Scholar]
- 31.Abbott NJ. Inflammatory mediators and modulation of blood-brain barrier permeability. Cell Mol Neurobiol. 2000;20(2):131–147. doi: 10.1023/A:1007074420772. [DOI] [PMC free article] [PubMed] [Google Scholar]
- 32.De Felice FG, Ferreira ST. Inflammation, defective insulin signaling, and mitochondrial dysfunction as common molecular denominators connecting type 2 diabetes to Alzheimer disease. Diabetes. 2014;63(7):2262–2272. doi: 10.2337/db13-1954. [DOI] [PubMed] [Google Scholar]
- 33.Qiao Y, Feng H, Zhao T, Yan H, Zhang H, Zhao X. Postoperative cognitive dysfunction after inhalational anesthesia in elderly patients undergoing major surgery: the influence of anesthetic technique, cerebral injury and systemic inflammation. BMC Anesthesiol. 2015;15(1):154. doi: 10.1186/s12871-015-0130-9. [DOI] [PMC free article] [PubMed] [Google Scholar]
- 34.Shah FA, Pike F, Alvarez K, et al. Bidirectional relationship between cognitive function and pneumonia. Am J Respir Crit Care Med. 2013;188(5):586–592. doi: 10.1164/rccm.201212-2154OC. [DOI] [PMC free article] [PubMed] [Google Scholar]
- 35.Guevara RE, Butler JC, Marston BJ, Plouffe JF, File TM, Breiman RF. Accuracy of ICD-9-CM codes in detecting community-acquired pneumococcal pneumonia for incidence and vaccine efficacy studies. Am J Epidemiol. 1999;149(3):282–289. doi: 10.1093/oxfordjournals.aje.a009804. [DOI] [PubMed] [Google Scholar]
Associated Data
This section collects any data citations, data availability statements, or supplementary materials included in this article.
Supplementary Materials
Methods S1. Description of hospitalized infection variables.
Methods S2. Diffusion tensor imaging methods.
Methods S3. Selection of participants for brain MRI.
Methods S4. Summary of methods for propensity score analyses.
Table S1. The association between hospitalization variables and late-life brain MRI values among non-demented participants.
Table S2. The association between hospitalization variables and late-life brain MRI values after omitting participants with midlife cognitive impairment.
Table S3. The association between hospitalization variables and late-life brain MRI values among participants without clinical stroke before Visit 5.
Table S4. Association of total number of hospitalizations with ventricular volume and mean diffusivity.
Table S5. The association between hospitalized major infection and late-life brain MRI values among participants who were not hospitalized for critical illness.
Table S6. The association between hospitalized infection (major and non-major) and late-life brain MRI values.
Table S7. Paired sample t tests comparing 1:1 propensity score-matched samples on late-life brain MRI values.
Table S8. The association between hospitalization variables and late-life brain MRI values using propensity score covariate adjustment.
Table S9. Baseline (Visit 1, 1987-89) participant characteristics and hospitalization variables stratified according to Visit 5 (2011-13) attendance, study dropout, and death before Visit 5.
Figure S1. Brain volume and white matter integrity according to the number of hospitalizations.