

Abstract
Variants of uncertain significance (VUS) fundamentally limit the clinical utility of genetic information. The challenge they pose is epitomized by BRCA1, a tumor suppressor in which germline loss-of-function variants predispose women to breast and ovarian cancer. Although BRCA1 has been sequenced in millions of women, the risk associated with most newly observed variants cannot be definitively assigned. Here, we employ saturation genome editing to assay 96.5% of all possible single nucleotide variants (SNVs) in 13 exons encoding functionally critical domains of BRCA1. Functional effects for nearly 4,000 SNVs are bimodally distributed and almost perfectly concordant with established assessments of pathogenicity. Over 400 non-functional missense SNVs are identified, as well as ~300 SNVs that disrupt expression. We predict that these results will be immediately useful for clinical interpretation of BRCA1 variants, and that this paradigm can be extended to overcome the challenge of VUS in additional clinically actionable genes.
Keywords: BRCA1, functional assay, genome editing, VUS
Our ability to predict the phenotypic consequences of an arbitrary genetic variant in a human genome remains poor. This problem manifests most poignantly in the large numbers of VUS identified in ‘actionable’ genes, i.e. genes in which the definitive identification of a pathogenic variant would alter clinical management1. For example, heterozygous germline variants disrupting BRCA1 increase risk for early-onset breast and ovarian cancer2,3, and are actionable, as more aggressive screening or prophylactic surgery lead to improved outcomes4,5. Clinical sequencing can implicate specific variants as risk-conferring6. However, as of January 2018, most BRCA1 SNVs are classified as VUS7. VUS are typified by rare missense SNVs, but also include variants potentially impacting mRNA levels. Further illustrating the challenge, there are hundreds of BRCA1 SNVs that have received conflicting interpretations7.
There are two major approaches for resolving VUS. The first approach, data sharing, relies on the expectation that as BRCA1 is sequenced in more individuals, the recurrent observation of a variant in individuals who either have or haven’t developed cancer will enable its interpretation. However, given that the vast majority of potential variants in BRCA1 are exceedingly rare and that the phenotype is incompletely penetrant, it’s unclear if sufficient numbers of humans will ever be sequenced to accurately quantify cancer risk for each possible variant.
The second approach, functional assessment, has spurred the development of diverse in vitro assays for BRCA18. As the homology-directed DNA repair (HDR) function of BRCA1 is key for tumor suppression, one commonly used assay asks whether expression of a BRCA1 variant can rescue HDR integrity9,10. Other approaches assay embryonic stem cell viability11, transcriptional activation12, drug sensitivity11, protein-protein interaction9,13, or splicing14,15. Computational predictions based on features such as conservation can add information but are insufficiently accurate to be used in the absence of genetic or experimental evidence16.
Functional assessments of BRCA1 variants have been limited in several ways. Chiefly, they are typically post hoc and haven’t kept pace with the accumulation of VUS. Additionally, assays expressing variants as cDNA-based transgenes removed from their genomic context9,13 fail to assess effects on splicing or transcript stability, and risk artifacts of overexpression17. Genome editing provides a means to overcome these challenges, but has yet to be applied to characterize any appreciable number of VUS in BRCA1 or other genes similarly linked to cancer predisposition.
Here we set out to apply genome editing to measure the functional consequences of all possible SNVs in key regions of BRCA1, regardless of whether they have been previously observed in a human. Given BRCA1’s immense size, we prioritized 13 exons that encode the RING and BRCT domains, which critically underlie its role as a tumor suppressor18–20. In addition to ~400 VUS or variants with conflicting interpretations, all 21 BRCA1 missense SNVs classified by an expert panel as pathogenic reside in these exons7, as do missense and splice variants shown to disrupt BRCA1 in functional assays11,21. In each experiment, a single exon is subjected to saturation genome editing (SGE)22, wherein all possible SNVs are simultaneously introduced and concurrently assayed. We used SGE to measure functional effects for 3,893 SNVs, comprising 96.5% of all possible SNVs in the targeted exons. These scores are bimodally distributed and nearly perfectly concordant with expert-based assessments of pathogenicity. We predict that our functional classifications will be of immediate clinical utility, and that scaling this approach to additional genes will substantially enhance the utility of genetic testing.
RESULTS
Saturation genome editing of BRCA1 exons
Many genes in the HDR pathway, including the hereditary cancer predisposition genes BRCA1, BRCA2, PALB2 and BARD16, have been deemed essential in the human haploid cell line HAP123 (Fig. 1a). To confirm this, we transfected HAP1 cells with a plasmid co-expressing Cas9 and guide RNAs (gRNAs) targeting each of these genes24. High cell death was evident by light microscopy, and a luminescence-based survival assay established that targeting any of these genes substantially reduces HAP1 viability (Extended Data Fig. 1a–c). Deep sequencing of the edited loci of BRCA1-targeted cells confirmed that cell death was consequent to mutations, as there was widespread selection against frameshifting indels (Extended Data Fig. 1d). Overall, these results confirm the essentiality of HDR pathway components in HAP1 cells.
Figure 1 |. BRCA1 and other HDR pathway genes are essential in HAP1 cells.
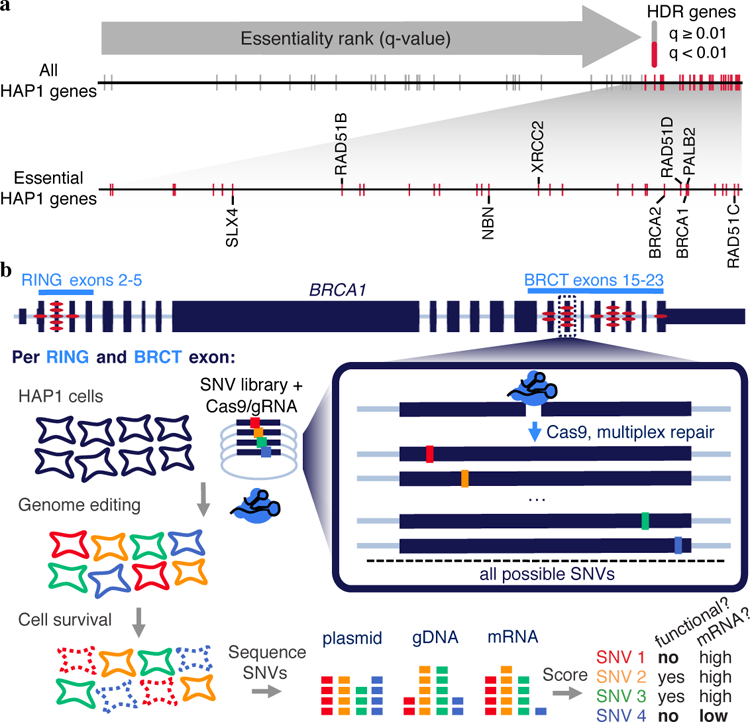
a, The q-value rankings23 of HDR pathway genes (n = 66) among 14,306 genes scored in a HAP1 gene trap screen for essentiality are indicated with tick marks. Essential HDR genes are colored red and those implicated in cancer predisposition are labelled in the enlargement below. Of the 66 HDR pathway genes scored, 34 including BRCA1 were ‘essential’, a 3.4-fold enrichment compared to non-HDR genes (Fisher’s exact P = 6.1 × 10⁻¹²). b, Saturation genome editing experiments were designed to introduce all possible SNVs across thirteen BRCA1 exons encoding the protein’s RING (exons 2–5, NCBI transcript ID NM_007294.3) and BRCT domains (exons 15–23). For each exon, a Cas9/gRNA construct was transfected with a library of plasmids containing all SNVs across ~100 bp of genomic sequence (the ‘SNV library’). SNV library plasmids contain homology arms, as well as fixed synonymous variants within the CRISPR target site to prevent re-cutting. Upon transfection, successfully edited cells harbor a single BRCA1 SNV from the library. Cells are sampled 5 and 11 days after transfection and targeted gDNA and RNA sequencing is performed to quantify SNV abundances. SNVs compromising BRCA1 function are selected against, manifesting in reduced gDNA representation, and SNVs impacting mRNA production are depleted in RNA samples relative to gDNA. The exonic locations of all 21 BRCA1 missense variants in ClinVar deemed pathogenic by an expert panel are indicated by red ovals.
We next designed and optimized experiments for SGE22 (Fig. 1b), focusing on the thirteen exons of BRCA1 encoding the RING and BRCT domains (exons 2–5 and 15–23, respectively; NCBI transcript ID NM_007294.3). To create a library of repair templates, we used array-synthesized oligo pools containing all possible SNVs spanning each exon and ~10 bp of adjacent intronic sequence. Oligo pools for each exon were cloned into plasmids with homology arms (‘SNV libraries’). Each design also included a fixed synonymous substitution at the Cas9 target site to reduce re-cutting after successful HDR22. Each SGE experiment targeted one exon. A population of 20 million HAP1 cells was co-transfected on day 0 with corresponding SNV library and Cas9/gRNA plasmid. Variant frequencies were quantified by targeted sequencing of the edited exon from genomic DNA (gDNA) harvested on day 5 and day 11.
We initially performed SGE in replicate for each exon in wild-type (WT) HAP1 cells. In each exon, we observed the expected depletion of frameshifting indels (Extended Data Fig. 2). However, to achieve more robust data, we optimized SGE in HAP1 cells in two ways. First, to increase HDR rates25, we generated a monoclonal LIG4 knockout HAP1 line (HAP1-Lig4KO) (Extended Data Fig. 3a,g). Second, as HAP1 cells can spontaneously revert to diploidy26, simply sorting HAP1 cells for 1N ploidy prior to editing improved reproducibility (Extended Data Fig. 3b,h).
We performed optimized SGE on each of the 13 exons in 1N-sorted HAP1-Lig4KO cells. We observed a median 3.6-fold increase in HDR rates on day 5 in HAP1-Lig4KO relative to WT HAP1 (Fig. 2a), allowing us to test nearly every possible SNV in replicate (Extended Data Fig. 3c). Because these optimizations increased reproducibility without substantially altering SNV effects on survival (Fig. 2b, Extended Data Figs. 3, 4), we moved forward with data from the 1N-sorted HAP1-Lig4KO cells. Additionally, targeted RNA sequencing of day 5 HAP1-Lig4KO samples was used to determine how abundant exonic SNVs were in BRCA1 mRNA (Fig. 2c).
Figure 2 |. Saturation genome editing enables functional classification of 3,893 BRCA1 SNVs.
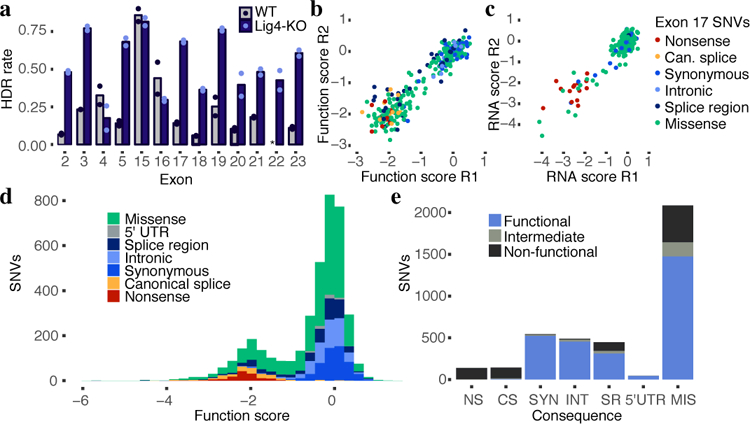
a, HDR editing rates were calculated for each exon as the fraction of day 5 reads containing the SNV library’s fixed synonymous variant (i.e. an ‘HDR marker’ edit). The average of two WT HAP1 replicates and two HAP1-Lig4KO replicates is plotted, with dots indicating rates for each replicate. (Asterisk denotes missing exon 22 data.) b,c, Measurements for exon 17 SNVs assayed in HAP1-Lig4KO cells are plotted to show correlations of function scores (b, n = 291, Spearman’s ⍴ = 0.88) and RNA expression scores (c, n = 231, Spearman’s ⍴ = 0.61). Reproducibility is detailed further in Extended Data Fig. 4. d, A histogram of 3,893 SNV function scores (averaged from n=2 replicates and normalized across exons) shows how each category of mutation compares to the overall distribution. e, The number of SNVs within each category is plotted and colored by functional classification. (NS = nonsense, CS = canonical splice, SYN = synonymous, INT = intronic, SR = splice region, 5’UTR = 5’ untranslated region, MIS = missense.)
Function scores for 3,893 BRCA1 SNVs
To calculate function scores, we first calculated the log2 ratio of each SNV’s frequency on day 11 vs. in the original plasmid library. Second, positional biases in editing rates were modeled (using day 5 SNV frequencies) and subtracted (Extended Data Fig. 5). Third, to enable comparisons between exons, we normalized function scores such that each experiment’s median synonymous and nonsense SNV matched global medians. Finally, a small number of SNVs were filtered out that couldn’t confidently be scored (Extended Data Fig. 6). Altogether, we obtained function scores for 3,893 SNVs, amounting to 96.5% of all possible SNVs within or immediately intronic to these exons (Supplementary Table 1; https://sge.gs.washington.edu/BRCA1/).
Function scores were bimodally distributed (Fig. 2d). All nonsense SNVs scored below –1.25 (N = 138, median = −2.12), whereas 98.7% of synonymous SNVs >3 bp from splice junctions scored above −1.25 (N = 544, median = 0.00). We classified all SNVs as ‘functional’, ‘non-functional’, or ‘intermediate’ by fitting a two-component Gaussian mixture model (Extended Data Fig. 7). 72.5% of SNVs were categorized as functional, 21.1% as non-functional, and 6.4% as intermediate.
Rare missense variants in BRCA1 are particularly challenging to interpret clinically. Of the missense SNVs assayed, 21.1% (441/2,086) were non-functional (Fig. 2e). Although most remaining missense SNVs were functional (70.6%), there was an enrichment for missense SNVs with intermediate effects (8.1% vs. 4.4% of all other SNVs; Fisher’s exact P = 2.7 × 10⁻⁶).
An advantage of genome editing is that the impact of variants on native regulatory mechanisms such as splicing can be ascertained22. Whereas SNVs disrupting canonical splice sites (the two intronic positions immediately flanking each exon) were overwhelmingly non-functional (89.5%) or intermediate (5.5%) (Fig. 2e), SNVs positioned 1–3 bp into the exon or 3–8 bp into the intron had variable effects. We defined SNVs in these regions that did not alter the amino acid sequence as ‘splice region’ variants, of which 22.9% were non-functional (Fig. 2e). SNVs positioned more deeply in introns or in the 5’ UTR were similar to non-splice-region synonymous SNVs, in that they were much less likely to score as non-functional (intronic: 1.8%, 5’ UTR: 0.0%, and synonymous: 1.3%, as non-functional).
Function scores accurately predict pathogenicity
We next asked how well our function scores agreed with clinical variant interpretations. Of 169 SNVs deemed ‘pathogenic’ in ClinVar that overlapped with our classifications, 162 were designated ‘non-functional’, 2 ‘functional’, and the remaining 5 ‘intermediate’. In contrast, of 22 SNVs deemed ‘benign’ in ClinVar, 20 were designated ‘functional’, 1 ‘non-functional’, and 1 ‘intermediate’ (Fig. 3a). The three SNVs that scored unambiguously discordant with ClinVar suggest potential errors in the available interpretations (Supplementary Note 1). A ROC curve showed a sensitivity of 96.7% at 98.2% specificity when we treat ‘likely pathogenic’ and ‘likely benign’ ClinVar annotations as pathogenic and benign, respectively (Fig. 3b). Importantly, sensitivity and specificity are high for missense and splice region SNVs (Extended Data Fig. 7f).
Figure 3 |. SGE function scores are highly accurate at predicting clinical interpretations of BRCA1 SNVs.
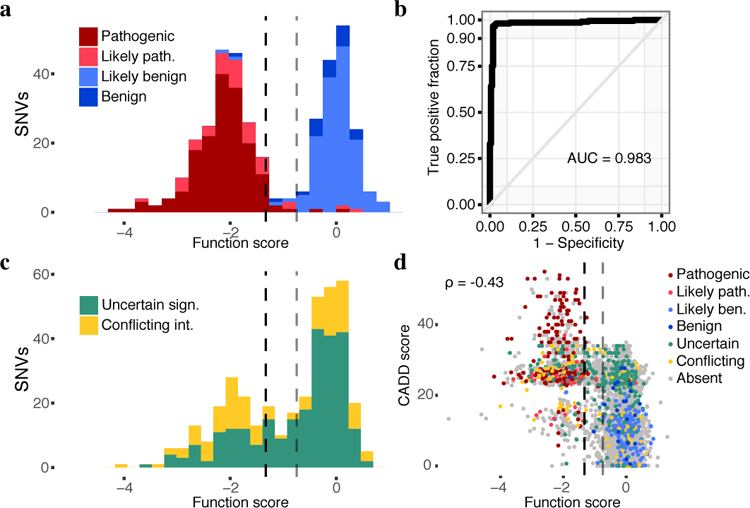
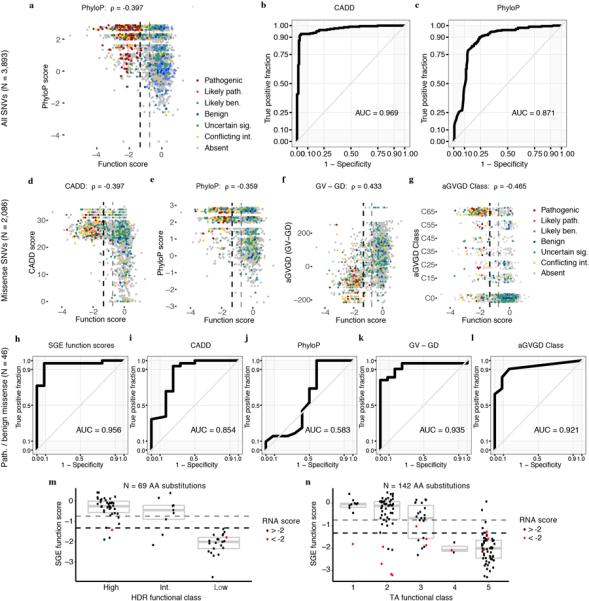
a, The distribution of SNV function scores colored by ClinVar interpretation. Scores are shown for n = 375 SNVs with at least a ‘1-star’ review status in ClinVar and either a ‘pathogenic’ or ‘benign’ interpretation (including ‘likely’). The dashed lines indicate the functional classification thresholds determined by mixture modeling. Gray divides ‘functional’ and ‘intermediate’ (function score = −0.748), and black divides ‘intermediate’ and ‘non-functional’ (function score = −1.328). b, An ROC curve reveals optimal sensitivity and specificity for classifying the same 375 SNVs in a at SGE function score cutoffs from −1.03 to −1.22. c, The distribution of scores plotted as in a for the 378 SNVs annotated as variants of uncertain significance or with conflicting interpretations. 91.3% of such variants are classified as ‘functional’ or ‘non-functional’ by SGE. . d, CADD scores, which predict deleteriousness, inversely correlate with function scores (Spearman’s, N = 3,893 SNVs). SNVs are colored by ClinVar annotation.
25.0% (64/256) of VUS and 49.2% (60/122) of SNVs with conflicting interpretations were scored as non-functional (Fig. 3c). Missense VUS from ClinVar were more likely to score as non-functional than missense SNVs absent from ClinVar (25.9% vs. 17.2%, P = 0.002). Of 3,140 assayed SNVs absent from ClinVar, 498 (15.9%) scored as non-functional. The distribution of function scores for the 29 firmly ‘pathogenic’ missense SNVs confirmed here to be non-functional doesn’t significantly differ from that of the 296 non-functional missense SNVs absent from ClinVar (median −2.05 vs. −1.97; Wilcoxon Ranked Sum P = 0.35).
We investigated the relationship between our function scores and allele frequencies in large-scale variant databases. Among 302 assayed SNVs that overlap with gnomAD27, higher allele frequencies were associated with higher function scores (Extended Data Fig. 8a). For instance, 33/166 (19.9%) of singleton variants were non-functional, whereas only 8/136 (5.9%) non-singleton variants were non-functional (Fisher’s exact P = 3 × 10⁻⁴). A similar trend was observed with the Bravo database (Extended Data Fig. 8b). The FLOSSIES database contains BRCA1 variants observed in women over seventy years old who have not developed breast or ovarian cancer28. Of 39 intersecting SNVs, only one scored as non-functional (Extended Data Fig. 8c). Collectively, these observations confirm that BRCA1 SNVs with higher allele frequencies are more likely to be functional.
Several computational metrics are currently used to the assess deleteriousness of variants and are often included in genetic testing reports. Although our function scores correlate with metrics such as CADD29, phyloP30, and Align-GVGD31, the modesty of these correlations underscores the value of functional assays (Fig. 3d, Extended Data Fig. 9a-g). ROC curve analysis restricted to the 46 missense SNVs deemed ‘pathogenic’ or ‘benign’ in ClinVar reveals that SGE function scores outperform these metrics (Extended Data Fig. 9h–l).
SGE function scores also strongly agree with the results of assays designed to test particular aspects of BRCA1 activity. For example, they are highly concordant with assays specific for BRCA1’s role in HDR9,13,32 and transcriptional activation12 (Extended Data Fig. 9m,n), as well as with the results of a multiplex assay that assesses BRCA1 variants’ function in HDR33.
Mechanisms of BRCA1 loss-of-function
To gain insights into the various mechanisms by which SNVs in BRCA1 compromise function, we performed targeted RNA sequencing of BRCA1 transcripts from edited day 5 cells. We normalized SNV frequencies in cDNA to their frequencies in gDNA to produce mRNA expression scores (‘RNA scores’) for 96% of the functionally characterized exonic SNVs. Together with function scores, RNA scores enable fine mapping of molecular consequences of SNVs (Fig. 4).
Figure 4 |. Sequence-function maps for 13 BRCA1 exons.
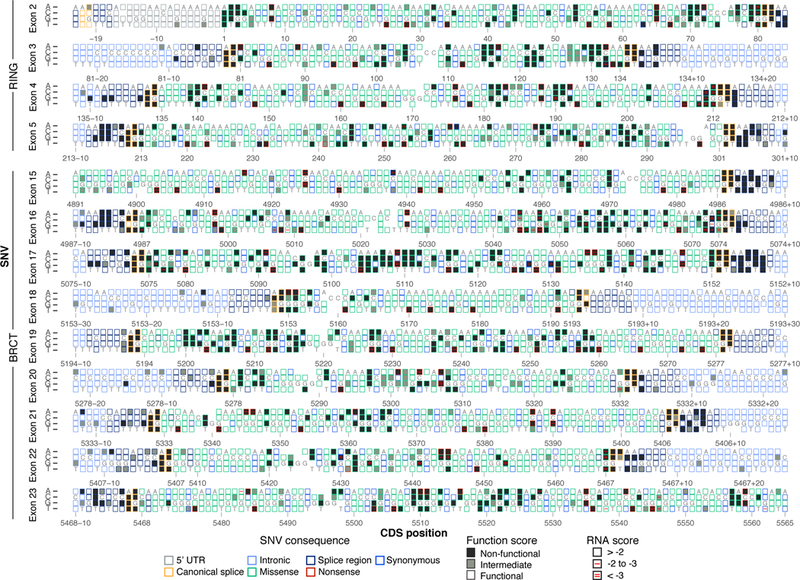
The 3,893 SNVs scored with SGE are each represented by a box corresponding to coding sequence position (NM_007294.3) and nucleotide identity. Boxes are filled corresponding to functional class, and outlined corresponding to the SNV’s mutational consequence. Red lines within boxes mark SNVs depleted in RNA; one line indicates an RNA score between −2 and −3 (log2 scale) and two lines indicate a score below −3. RNA measurements were determined only for exonic SNVs, excluding exon 18. Reference nucleotides are indicated; blank boxes indicate missing data.
Overall, 89% of non-functional missense SNVs did not reduce RNA levels substantially, suggesting their effects are mediated at the protein level (Fig. 5a, Supplementary Note 2). Many residues that are sensitive to missense SNVs not impacting RNA levels map to buried hydrophobic residues or to the zinc-coordinating loops required for proper RING domain folding34 (Fig. 5b-c). For example, 20 of 21 missense SNVs in c.5104-c.5112 scored non-functional, including 4 VUS (Fig. 4). This intolerance to variation is probably due to the hydrophobicity of Y1703 and F1704 and their internal position in the structure and the polar contacts made between K1702 and a phosphorylated binding partner35. This contrasts with a 51 bp stretch spanning exons 21 and 22 (c.5368-c.5418, p.1790–1806) in which none of the 104 missense SNVs assayed were non-functional.
Figure 5 |. Measuring SNV mRNA abundance and function in parallel delineates mechanisms of variant effect.
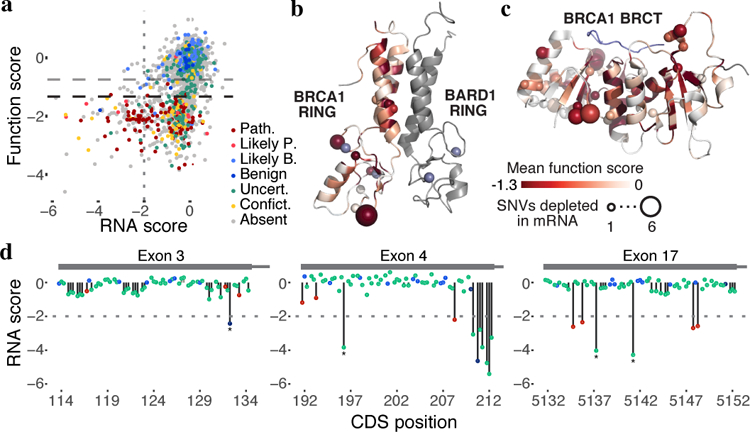
a, Function scores are plotted against RNA scores for all exonic synonymous and missense SNVs scored (N = 2,646). Horizontal dashed lines indicate functional thresholds, and the vertical dotted line marks an RNA score of −2. b,c, Function scores for all SNVs were mapped onto the structures of the RING (b, pdb 1JM7) and BRCT (c, pdb 1T29) domains in shades of red by averaging missense SNV scores at each amino acid position. The number of SNVs that cause >75% reduction in mRNA levels at each amino acid position is represented by the size of the sphere at the alpha-carbon at each residue. Grey denotes residues not assayed and the BACH1 peptide bound to the BRCT structure is colored blue. d, SNV RNA scores are plotted by transcript position, with lines to the x-axis denoting SNV functional classifications (no line = functional, gray line = intermediate, black line = non-functional). The horizontal dashed line in each plot marks an RNA score of −2, corresponding to 75% reduction in mRNA. Examples of non-functional SNVs with low RNA scores that create new 5’-GU splice donor motifs are indicated with asterisks.
SGE also implicates numerous SNVs impacting expression. For example, all SNVs that disrupt the translation initiation codon score as non-functional, and certain SNVs at the −3, +4 and +5 positions predicted to decrease translational efficiency36 score as intermediate or non-functional. 11% of non-functional missense SNVs are depleted from RNA by ≥4-fold, many of which map to unstructured regions (Fig. 5b-c), suggesting loss-of-function is consequent to reduced mRNA levels rather than disrupted protein function. Consistent with this, the 12 synonymous SNVs classified as non-functional also tended to markedly reduce mRNA levels (median 5.4-fold reduction).
Variants depleted in mRNA are most likely impacting RNA splicing. This is evidenced by an overrepresentation of non-functional exonic SNVs near splice junctions, including low scores for many SNVs at terminal G nucleotides of exons (Fig. 4), non-functional exonic SNVs with low mRNA levels that create new acceptor or donor sequences (Fig. 5d), and the presence of ~6–8 bp regions wherein many SNVs have strong effects on mRNA levels, suggestive of exonic splice enhancers37 (Extended Data Fig. 10a). Certain exons were particularly prone to harbor non-functional SNVs with low RNA scores. In exon 16, for instance, 46/244 SNVs (excluding nonsense) were non-functional (Extended Data Fig. 10a). Most of these (26/46) reduced RNA levels by ≥2-fold, and fifteen by ≥4-fold. In contrast, in exon 19, 55/234 SNVs (excluding nonsense) were non-functional, but none lowered expression by ≥2-fold (Extended Data Fig. 10b). Exon 19 also completely lacks non-functional SNVs in its flanking intronic regions (apart from the acceptor and donor sites), suggesting it is robustly spliced.
DISCUSSION
Here we applied SGE to critical domains of BRCA1, characterizing the consequences of nearly 4,000 SNVs in their native genomic context. A benefit of functional data is that measurements are systematically derived, independent of prior expectation38. Because we measured cell survival, the effects of SNVs on multiple layers of gene function (e.g. splicing, translation, protein activity) are effectively integrated. Our study has several caveats (Supplementary Note 3), most notably that we used a survival assay in HAP1 cells opposed to a more physiologically appropriate model. However, our data are validated by exceptionally high concordance with the available evidence for clinical pathogenicity.
High sensitivity and specificity were obtained for both missense and splice region SNVs, which are most problematic for clinical interpretation. Our review of firmly discordant SNVs suggests that our true accuracy may be higher than calculated using ClinVar assertions as a gold standard (Supplementary Note 1). These discordances highlight the importance of integrating new evidence as it becomes available and updating databases accordingly. For instance, the Breast Cancer Information Core’s submissions, which mostly date to the early 2000s, underlie 51 conflicting interpretations. SGE scores support the more recent classification the vast majority of the time (Supplementary Table 2).
The interpretation of genetic variation is presently the rate-limiting step for genomic medicine. The fact that >70% of ClinVar variants and >95% of non-ClinVar variants assayed here have never been observed in >120,000 humans represented in gnomAD illustrates the challenges facing observational approaches to variant interpretation. Given this, a pressing question is how to best to integrate functional data into existing clinical variant classification schemes39. The predictive power demonstrated here suggests SGE function scores classify variants with >95% accuracy. As current standards for defining ‘likely’ pathogenic and benign variants accept comparable uncertainty40, we argue that a failure to incorporate function scores would be a missed opportunity.
Optimal weighting of different approaches might further improve classification of variants lacking genetic evidence. For unexpected functional classifications, such as synonymous SNVs with low scores, and for cases where the clinical evidence is contradictory, functional data can provide specific hypotheses to test. For example, c.5044G>A, for which our data contradicts ClinVar, could be disambiguated by testing BRCA1 mRNA levels in individuals harboring this SNV. The ~6% of SNVs exhibiting intermediate function scores remain beyond definitive interpretation. The fact that we observe an excess of missense SNVs with intermediate scores suggests that some of these may be hypomorphic BRCA1 alleles41. Further studies will be necessary to assess the risk conferred by these variants.
We prioritized the RING and BRCT domains, but SGE of all exons of BRCA1 is justified, and the essentiality of BRCA2, PALB2, BARD1, and RAD51C in HAP1 cells suggests these genes are assayable by the same method. For other genes, assays compatible with saturation genome editing (e.g. drug selection, FACS on phenotypic markers) may need to be developed and validated. Scaling SGE to many loci also promises to improve our understanding of how diverse biological functions are encoded by the genome.
Here we show SGE is a viable strategy for functionally classifying thousands of variants in a clinically actionable gene, most of which have yet to be observed in a human. We anticipate function scores will prove highly valuable, both for adjudicating hundreds of observed BRCA1 variants whose interpretation is currently ambiguous, as well as for providing immediate functional assessments for newly observed variants. We further hope this work serves as a blueprint for the comprehensive functional analysis of all potential SNVs in clinically actionable genes.
METHODS
HDR pathway essentiality analysis in HAP1 cells
HAP1 cells were derived from KBM7 cells (a near-haploid immortalized chronic myelogenous leukemia line) by introduction of induced pluripotent stem cell factors45. HAP1 gene essentiality scores were obtained23 and filtered on genes with greater than 20 mapped gene-trap insertions (N = 14,306). Of 78 HDR genes defined by the Gene Ontology term ‘double-strand break repair via homologous recombination’ (GO:0000724), 66 were among the 14,306 genes included in analysis. To rank genes by essentiality, they were first ordered by q-value (low to high) and second by the proportion of gene-trap insertions in the sense orientation (low to high). HDR pathway genes implicated in cancer (labelled in Fig. 1a) were defined as those included on the University of Washington BROCA sequencing panel46.
gRNA design and cloning
All CRISPR gRNAs used in SGE and essentiality experiments were cloned into pX45924. This plasmid expresses the gRNA from a U6 promoter, as well as a Cas9–2A-puromycin resistance (-puroR) cassette. S. pyogenes Cas9 target sites were chosen for SGE experiments on multiple criteria, assessed in the following order: 1.) To induce cleavage within BRCA1 coding sequence, 2.) To target a genomic site permissive to synonymous substitution within the guanine dinucleotide of the PAM or the protospacer, 3.) To have minimal predicted off-target activity47, 4.) To have maximal predicted on-target activity48.
Complementary oligos ordered from Integrated DNA Technologies (IDT) were annealed, phosphorylated, diluted and ligated into BbsI-digested and gel-purified pX459, as described24. Ligation reactions were transformed into E. coli (Stellar competent cells, Takara), which were plated on ampicillin. Colonies were cultured and Sanger sequenced to confirm correct gRNA sequences. Purification of sequence-verified plasmids for transfection was performed with the ZymoPure Maxiprep kit (ZymoResearch). For targeting LIG4 in HAP1 cells, pX45824 was used instead of pX459, which expresses EGFP in lieu of puroR.
HDR library design and cloning
Array-synthesized oligos were designed as follows for each saturation genome editing region (i.e. a BRCA1 exon). The sequence to be mutated (~100bp) was obtained from the human genome (hg19) and a synonymous substitution was introduced at the chosen Cas9 target site (e.g. a substitution at the PAM site). This ‘fixed’ substitution in the library was included in design to serve multiple purposes: 1.) plasmid library molecules harboring the substitution are predicted to be cleaved less frequently by Cas9:gRNA complexes, 2.) SNVs introduced to cells are predicted to be depleted via Cas9 re-cutting less frequently as a consequence of the fixed substitution, and 3.) sequencing reads can be filtered on the fixed substitution to distinguish true SNVs introduced via HDR from sequencing errors. A second synonymous substitution at an alternative CRISPR target site was introduced to the sequence as well, such that each exon’s SNV library would be compatible with multiple gRNAs. Next, a sequence was created for every possible single nucleotide substitution on this template. For all sequences, adapters were added to both ends to enable PCR amplification from the oligo pool. For each SGE region, the total number of oligos designed was three times the length of the region, plus the oligo template without any SNV (e.g. for a 100 bp SGE region, 301 total oligos were designed).
Pooled oligos were synthesized (Agilent Technologies). Primers designed to amplify the subset of oligos corresponding to a single exon’s region were used to perform PCR with Kapa HiFi Hot-start Ready Mix (‘Kapa HiFi’, Kapa Biosystems). PCR products were purified with Ampure beads (Agencourt) to be used in subsequent library cloning reactions.
Homology arms were cloned into pUC19 by PCR-amplifying (Kapa HiFi) regions surrounding each targeted exon from HAP1 gDNA. Primers for these reactions were designed such that homology arms would be between 600 and 1,000 bp on both sides of the targeted region. Adapters homologous to pUC19 were added to primers to facilitate NEBuilder HiFi Assembly cloning (NEB) into a linearized pUC19 vector. Cloning reactions were transformed into Stellar competent cells and selected with ampicillin. Plasmid DNA was isolated from colonies (Qiagen MiniPrep kit) and sequence-verified.
To make the HDR library, homology arm plasmids were linearized via PCR using primers that conferred 15–20 bp of terminal overlap with the adapter sequences flanking each PCR-amplified oligo pool. This sequence overlap enabled cloning via the NEBuilder HiFi Assembly Cloning Kit (NEB). Cloning reactions were transformed into Stellar competent cells, and a small proportion (1%) of the transformation was plated on ampicillin-containing plates to assess efficiency. All remaining transformed cells were grown directly in 100 ml of media with ampicillin for 16–18 hours, and plasmid DNA from the culture was isolated (ZymoPure Maxiprep kit) to produce each final HDR library.
HAP1 cell culture
Quality-controlled WT HAP1 cells were purchased (Haplogen/Horizon Discovery) and cultured in media comprising Iscove’s Modified Dulbecco’s Medium (IMDM) with L-glutamine and 25 mM HEPES (GIBCO) supplemented with 10% fetal bovine serum (Rocky Mountain Biologicals) and 1% penicillin-streptomycin (GIBCO). Cells were grown on plates at 37C with 5% CO2, and passaged prior to becoming confluent. For routine passaging, cells were washed once with 1x phosphate buffered saline (PBS, Gibco), trypsinized with 0.25% trypsin with EDTA (Gibco), resuspended in media, centrifuged for 5 min at 300 rcf, and then resuspended and plated.
A monoclonal LIG4 knock-out HAP1 line (HAP1-Lig4KO) was generated by transfecting a plasmid expressing a Cas9–2A-GFP cassette and a gRNA targeting the human LIG4 coding sequence (gRNA sequence: 5’-GCATAATGTCACTACAGATC) into WT HAP1 cells. Single GFP-expressing HAP1 cells were sorted into wells of a 96-well plate and cultured. After two weeks, gDNA was harvested and Sanger sequencing was performed to assess LIG4 editing. A clone with a 4bp deletion was identified and expanded further for use in saturation genome editing experiments.
HAP1 cells can spontaneously revert to a diploid state in cell culture. Therefore, to sort a 1N-enriched population of cells prior to transfection, cells were stained for DNA content with Hoechst 34580 (BD Biosciences) at 5 ug/ml media for 1h at 37C. FACS was performed to isolate 1–2×10⁶ cells from the lowest intensity Hoechst peak, corresponding to 1N ploidy. These cells were expanded for seven days prior to transfection.
Transfection of HAP1 cells
For all experiments, HAP1 cells were transfected using TurboFectin 8.0 (Origene) according to manufacturer’s protocol. A 2.5x volume of Turbofectin was added to the transfection mix for each ug of plasmid DNA in Opti-Mem (Life Technologies). For each SGE transfection, 10 million cells were passaged to a 10 cm dish. The next day (day 0), cells were co-transfected with 12 ug of the Cas9/gRNA plasmid (pX459) and 3 ug of the SNV library corresponding to a single exon. Negative control transfections were performed for each library using a pX459 vector targeting HPRT1 instead of BRCA1, thus preventing genomic integration of the library. On day 1, cells were passaged into media supplemented with puromycin (1 ug/ml) to select for successfully transfected cells. On day 4, cells were washed twice and passaged to 6 cm plates in regular media.
Cell populations were sampled on day 5 and day 11 for all SGE experiments. On day 5, half of the cells were pelleted and frozen and the other half passaged. The cells were passaged on day 8 into 15 cm dishes and then harvested on day 11. Negative control transfections were harvested on day 5 and used to confirm that PCR amplicons were not derived from the plasmid DNA of the SNV library.
For the luminescence-based viability assay, HAP1 cells were plated at ~35–40% confluency in a 6-well dish (approximately 1.2 million cells per well per target) then transfected with 1.5 ug Cas9/gRNA plasmid targeting coding exons of HDR genes or controls the following day. 24 hours after transfection the cells were plated in time-point triplicates at 20,000 cells per well in 96-well clear bottom plates in media with and without puromycin. Cells without puromycin were assessed 4 hours after plating to establish baseline absorbance for each target. Cell survival was assessed at day 2, day 5, and day 7 post-transfection using the CellTiterGlow reagent (Promega, 1:10 dilution of suggested reagent). Luminescence at 135 nm absorbance was measured using a Synergy plate reader (Biotek Instruments).
Nucleic acid sampling and sequencing library production
For obtaining WT HAP1 genomic DNA for cloning homology arms and for genotyping the HAP1-Lig4KO cell line, DNA was isolated using the DNeasy kit (Qiagen). For each SGE experiment, DNA and total RNA were purified using the AllPrep kit (Qiagen). DNA samples were quantified with the Qubit dsDNA Broad Range kit (Thermo Fisher) and RNA samples by UV spectrometry (Nanodrop). PCR primers for genomic DNA were designed such that one primer would anneal outside of the homology arm sequence, thereby selecting for amplicons derived from gDNA and not plasmid DNA. PCR conditions were optimized using gradient qPCR on WT HAP1 gDNA.
All gDNA harvested from the population of day 5 cells was sampled by performing many PCR reactions in parallel on a 96-well plate, using 250 ng of gDNA per 50 ul reaction such that all day 5 gDNA was used in PCR (Kapa HiFi). At least as many PCR reactions were performed for day 11 samples (which yielded more gDNA) to ensure adequate sampling. PCRs were performed for the minimal number of cycles needed to complete amplification, with cycling conditions as specified in the Kapa HiFi protocol. An additional PCR was performed using day 5 gDNA from negative control transfections for each exon.
After PCR, multiple wells of amplicons from the same sample were pooled and purified using Ampure beads. Next, a nested qPCR was performed using the first reaction as template to produce a smaller amplicon with custom sequencing adapters (‘PU1L’ and ‘PU1R’), which was likewise purified with Ampure beads. The SGE libraries were also PCR-amplified at this step, starting from 50 ng of plasmid DNA. Lastly, a final qPCR was performed using purified products from the second reaction as template to add dual sample indexes and flow cell adapters.
RNA was sampled from day 5 HAP1-Lig4KO cells (AllPrep, Qiagen). Reverse transcription followed by RNase H treatment was performed on all RNA harvested or a maximum of 5 ug per sample (Superscript IV Kit, Life Technologies). This reaction was primed with a gene-specific primer complementary to the 3’ UTR in exon 23 of BRCA1. Primers were designed for each exon to amplify across exon junctions, and reaction conditions were optimized using gradient PCR. cDNA was distributed into 5 equal PCR reactions, which were run on a qPCR machine and then pooled in equal ratios. Flow cell adapters and sample indexes were added in an additional reaction (as for gDNA samples).
All sequencing libraries were purified with Ampure beads, quantified with the Qubit dsDNA High Sensitivity kit (Life Technologies), diluted and denatured for sequencing in accordance with protocols for the Illumina NextSeq or MiSeq machines.
Sequencing and data analysis
Sequencing was performed on an Illumina NextSeq or MiSeq instrument, allocating about 3 million reads to each gDNA and cDNA sample, 1 million reads for each HDR library, and 500,000 reads for each negative control sample. gDNA samples for individual exons were sequenced on the same run. 300 cycle kits were used, with 150 cycles for read 1 and read 2 each, and 19 cycles for dual index reads. Custom sequencing primers and indexing primers are provided in Supplementary Table 3. Illumina PhiX control DNA was added to each sequencing run (~10% MiSeq, ~30–40% NextSeq) to improve base calling.
Illumina’s bcl2fastq 2.16 was used to call bases and perform sample demultiplexing and fastqc 0.11.3 was run on all samples to assess sequencing quality. SeqPrep was used with the following parameters to perform adapter trimming and to merge perfectly matched overlapping read pairs: ‘-A GGTTTGGAGCGAGATTGATAAAGT -B CTGAGCTCTCTCACAGCCATTTAG -M 0.1 -m 0.001 -q 20 -o 20’. Merged reads containing ‘N’ bases were removed. Reads from cDNA samples were removed if they contained indels or did not perfectly match transcript sequence flanking each targeted exon. Remaining cDNA reads were processed to match genomic DNA amplicons by removing flanking exonic sequence and replacing it with the exon’s corresponding intronic sequence. All reads were then aligned to reference gDNA amplicons for each exon using the needleall command in the EMBOSS 6.4.0 package with the following parameters: ‘-gapopen 10 -gapextend 0.5 -aformat sam’. Reads not aligning to the reference amplicon (alignment score < 300) were removed from analysis. To analyze indels, unique cigar counts were quantified from day 5 and day 11 samples using a custom Python script. Reads were classified as HDR events for rate calculations if the programmed edit or edits to the PAM or protospacer (HDR marker edits) were observed in the alignment. Variants without identifiable markers of HDR were not used. Abundances of SNVs were quantified only from aligned reads that had no other mismatches or indels, with the exception of the HDR markers. SNV reads with only the cut-site proximal HDR marker were summed with reads that had both HDR markers to get total abundances for each SNV in each sample, to which a pseudocount of 1 was added to all variants present in either the library, day 5 or day 11 sample. Frequencies for each SNV were calculated as SNV reads over total reads. SNV measurements from WT HAP1 cells and HAP1-Lig4KO cells were processed separately at all steps.
Specific exon 2 splice junctions were queried by counting the number of reads from cDNA samples that perfectly matched specific isoform junctions. Two 14 bp sequences spanning the end of exon 1 and the beginning of exon 2 were counted to measure use of the canonical junction (TCTGGTTCATTGGA and TCTGGTTCACTGGA; the latter of which contains an HDR marker introduced during editing). The 14 bp sequence spanning the end of exon 1 and the portion of exon 2 corresponding to the reported alternative AG acceptor site49,50 was (TAAAGAAAGAAATG). The proportion of the total reads counted containing the latter sequence was used to approximate the relative contribution of the alternative acceptor site.
Modeling positional biases of library integration
Positional biases in editing rates were modeled for each SNV by using a LOESS regression to fit the log2 day 5 over library ratios as a function of chromosomal position. To avoid modeling biological effects instead of positional effects, the model was fit only on the subset of SNVs that were not substantially depleted between any two timepoints in the experiment (i.e. SNVs with day 5 over library ratios > 0.5 and day 11 over d5 ratios > 0.8.). The regression was performed for each exon replicate, using the ‘loess’ function in R with span = 0.15. Each model was extended flatly outward to include any positions not fit (a total of 22 nucleotides of sequence on the edges of the edited regions). We subtracted each SNV’s positional fit (e.g. the model’s output) from the SNV’s log2 day 11 over library ratio to get position-adjusted ratios for each SNV.
Normalizing scores within and across exons
Position-adjusted log2 day 11 over library ratios were normalized first across exon replicates, and then across all exons assayed. To do this, scores from within each replicate were linearly scaled such that the median synonymous and median nonsense SNVs within the replicate would match the median synonymous and median nonsense SNV values averaged across replicate experiments. The ensuing SNV scores for each replicate were then normalized across all exons in the same manner, such that each exon’s median synonymous and median nonsense SNV scores would match the global median synonymous and the global median nonsense SNV scores, respectively.
SNV functional class assignment
Function scores were averaged across replicates and a mixture model was used to estimate the probability that each SNV’s score was drawn from the non-functional distribution of scores. The non-functional distribution was defined as nonsense SNVs across all exons. The functional distribution was defined as exonic synonymous SNVs not within 3 bp of splice junctions and with RNA scores within 1 standard deviation of the median synonymous SNV. This definition does not fully guarantee that these SNVs have no functional consequence. The means and variances of the ‘non-functional’ and ‘functional’ groups were fixed and a model was fit using the normalmixEM function of the mixtools package in R, with starting component proportions set to 0.5. The posterior probabilities generated from the model were used as point estimates of the probability of drawing each SNV’s score from the non-functional distribution (Pnf). Functional classifications were made by setting thresholds for Pnf as follows: Pnf > 0.99 = ‘non-functional’, 0.01< Pnf < 0.99 = ‘intermediate’, Pnf <0.01 = ‘functional’.
Independent of mixture modelling, ROC curves were used to assess performance of SGE data and other metrics’ ability to predict assigned ClinVar classifications. These analyses were performed with the plotROC package in R, and Youden’s J-statistic (sensitivity plus specificity minus 1) was calculated to determine optimal values reported in text.
Variant filtering
A small minority of SNVs that could not be accurately scored were removed from analysis. If a SNV was not present in the HDR library at a frequency over 1 in 104, it was presumed to have been lost in oligo synthesis or cloning and was removed. Additionally, if a SNV was not observed with complete HDR markers at a frequency over over 1 in 105 in day 5 genomic DNA samples from both replicate experiments, it was removed. SNVs introduced near the CRISPR recognition site have the potential to facilitate Cas9 recutting of the locus (e.g. by replacing the PAM edit or introducing an alternative PAM site). Because these SNVs are likely to score lower consequent to Cas9 editing biases and not their effects on gene function, SNVs were filtered that created increased potential for re-cutting as follows: When an HDR marker mutation used to disrupt editing occurred at position 2 of the PAM (e.g. ‘NGG’ to ‘NCG’), SNVs that replaced this marker with an alternate base were removed to prevent biases introduced by recutting non-canonical S. pyogenes Cas9 PAMs (e.g. ‘NAG’, ‘NTG’). Additionally, variants that created a new PAM 1 bp 3’ of the mutated PAM were excluded due to the potential for recutting (e.g. unedited PAM: 5’-NGGA, edited PAM with HDR marker: 5’-NCGA, filtered out SNV that creates new PAM +1bp 3’: 5’-NCGG). (Extended Data Fig. 6 describes recutting observed at alternative PAMs.) To prevent misinterpretation, we also removed SNVs that created amino acid changes specific to the context of the library’s fixed edits (e.g. if in the unedited background, the SNV causes an X to Y change, but with a fixed edit in the same codon, the SNV causes an X to Z change). We also applied this logic to remove SNVs that introduced splice donor sites only in the context of the edited PAM, and SNVs that create splice donor sites in the unedited context but not in the context of the edited PAM.
The RNA scores for exon 18 samples were neither well correlated across replicates nor with SNV abundances in genomic DNA, indicating likely bottlenecking in library preparation. Therefore, RNA data from exon 18 was excluded. WT HAP1 function scores from exon 22 were excluded because there was an unusually high correlation between SNV frequencies sampled from the plasmid library and from day 5 gDNA, suggesting plasmid contamination in gDNA sequencing. This problem was fixed by designing a new primer to prepare gDNA sequencing samples from HAP1-Lig4KO cells.
External data sources
Variant annotations were downloaded from CADD29 version 1.3 (http://cadd.gs.washington.edu/download). This included the following scores: mammalian phyloP, Grantham deviation, SIFT, Polyphen-2, and CADD. Align-GVGD scores were obtained by running the Align-GVGD program on BRCA1 sequences conserved to sea urchin. ClinVar data were downloaded on 1/2/2018 for all germline SNVs with at least a 1-star annotation. SNVs annotated as ‘Benign/Likely benign’ were grouped with ‘Likely benign’ SNVs and SNVs classified ‘Pathogenic/Likely pathogenic’ were grouped with ‘Likely pathogenic’ SNVs. SNV allele frequencies were obtained from http://gnomad.broadinstitute.org/ on 12/26/2017 for gnomAD27, from https://bravo.sph.umich.edu/freeze5/hg38/ on 11/19/2017 for Bravo, and from https://whi.color.com/ on 10/9/2017 for FLOSSIES data. The hg19 UCSC Genome Browser was accessed from https://genome.ucsc.edu/ on 5/1/2018 for chr17:41,276,108–41,276,139. Throughout this study, BRCA1 exons, coding nucleotide positions, and amino acid positions are referenced by the ClinVar transcript annotation for BRCA1, NCBI transcript NM_007294.3.
Statistical reporting
All statistical tests described were performed as two-tailed tests using the R software package.
Extended Data
Extended Data Figure 1 |. CRISPR targeting of HDR pathway genes to confirm essentiality in HAP1 cells.
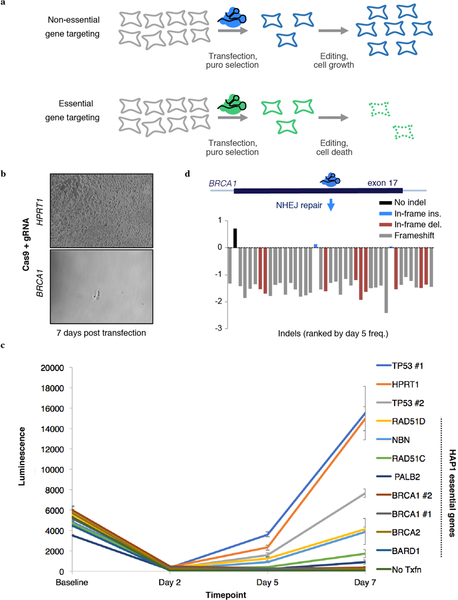
a, Schematic; HAP1 cells are transfected with a plasmid expressing a gRNA and a Cas9–2A-puromycin cassette24. Due to low transfection rates for HAP1 cells, puromycin selection reduces viable cells in all transfections. Over time, however, CRISPR targeting of non-essential genes leads to increased cell growth compared to CRISPR targeting of essential genes. b, HAP1 cell populations were transfected with a Cas9/gRNA plasmid either targeting the non-essential gene HPRT1 (control) or exon 17 of BRCA1 on day 0. Successfully transfected cells were selected with puromycin (days 1–4) and cultured until imaging on day 7, at which point cells were imaged. Images are representative of two transfection replicates. c, Cell viability of HAP1 cells transfected with Cas9/gRNA constructs targeting different HDR genes and controls (HPRT1, TP53) was measured using the CellTiterGlow assay. Luminescence is proportional to the number of living cells in each well when the assay is performed. Triplicate wells for each gRNA at each time point were processed, quantified on a plate reader and averaged. Error bars show the standard error of the mean. gRNA sequences are included in Supplementary Table 3. d, The targeted BRCA1 exon 17 locus was deeply sequenced from a population of transfected cells sampled on day 5 and day 11. The fold-change from day 5 to day 11 for each editing outcome observed at a frequency over 0.001 in day 5 sequencing reads is plotted.
Extended Data Figure 2 |. Analysis of Cas9-induced indels observed in BRCA1 SGE experiments.
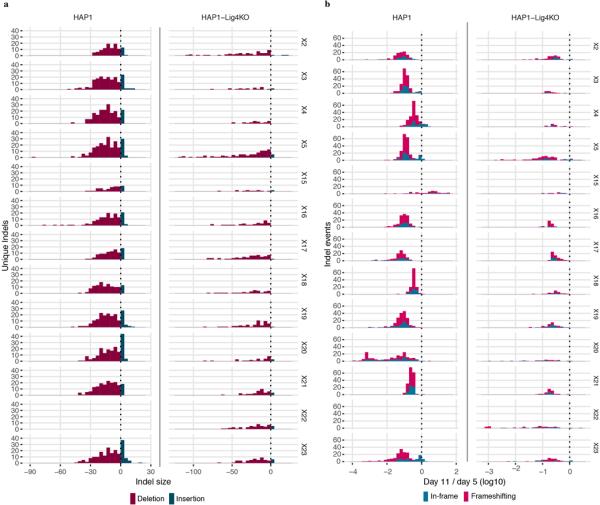
Variants observed in gDNA sequencing were included in this analysis if i) they aligned to the reference with either a single insertion or deletion within 15 bp of the predicted Cas9 cleavage site and ii) were observed at a frequency greater than 1 in 10,000 reads in both replicates. a, Histograms show the number of unique indels observed of each size, with negative sizes corresponding to deletions. More unique indels were observed in WT HAP1 cells compared to HAP1-Lig4KO cells for exons compared (WT data for exon 22 was excluded). b, Day 11 over day 5 indel frequencies were normalized to the median synonymous SNV in each replicate and then averaged across replicates to measure selection on each indel. The distribution of selective effects is shown for each experiment as a histogram, in which indels are colored by whether their size was divisible by 3 (i.e. ‘in-frame’ vs. ‘frameshifting’). Whereas frameshifting variants were consistently depleted, some exons were tolerant to in-frame indels.
Extended Data Figure 3 |. HAP1 cell line optimizations for saturation genome editing to assay essential genes.
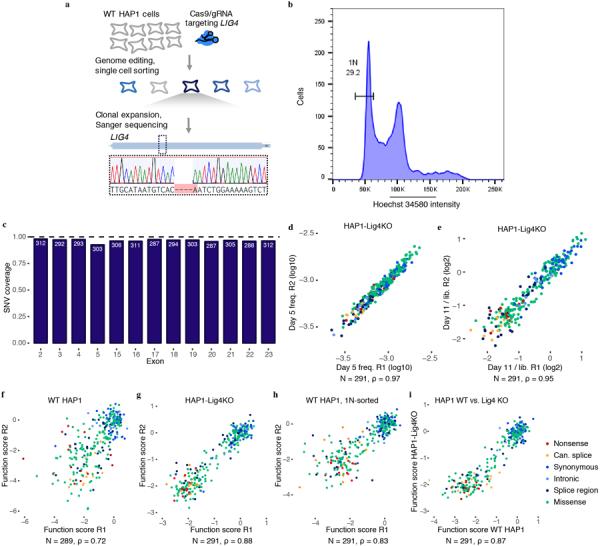
a, A gRNA targeting Cas9 to the coding sequence of LIG4, a gene integral to the non-homologous end-joining pathway, was cloned into a vector co-expressing Cas9–2A-GFP24. WT HAP1 cells were transfected, and single GFP-expressing cells were sorted into wells of a 96-well plate. Eight monoclonal lines were grown out over a period of three weeks and screened using Sanger sequencing for frameshifting indels in LIG4. The Sanger trace shows the frameshifting deletion present in the clonal line chosen for subsequent experiments, referred to as ‘HAP1-Lig4KO’. b, To purify HAP1 cells for haploid cells, live cells were stained for DNA content with Hoechst 34580 and sorted using a gate to select cells with the lowest DNA content, corresponding to 1N cells in G1. c, The fraction of all possible SNVs scored is shown for each exon. SNVs were excluded mainly due to proximity to the HDR marker and/or poor sampling (Methods). d,e, Measurements across replicates are plotted for exon 17 SNVs assayed in HAP1-Lig4KO cells to show correlations of day 5 frequencies (d) and day 11 over library ratios (e). f–h, Plots comparing SNV function scores across replicate experiments for exon 17 saturation genome editing experiments performed in unsorted WT HAP1 cells (f), HAP1-Lig4KO cells (g), and WT HAP1 cells sorted on 1N ploidy (h). i, Function scores (averaged across replicates) are plotted to compare results for exon 17 experiments performed in WT 1N-sorted HAP1 cells and HAP1-Lig4KO cells. The number of SNVs plotted and the Spearman correlation is displayed for each plot (d-i).
Extended Data Figure 4 |. Correlations for SNV measurements within single experiments, across transfection replicates, and to CADD scores for all SGE experiments.
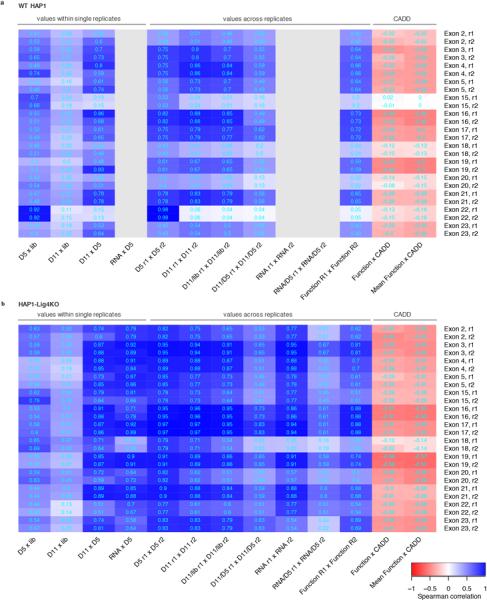
Heatmaps indicate Spearman correlation coefficients for SNV measurements from experiments in WT HAP1 cells (a) and in HAP1-Lig4KO cells (b). Gray boxes indicate absent RNA data from WT HAP1 cells. The four leftmost columns show how SNV frequencies correlate between samples from within a single replicate experiment. The unusually high correlations between exon 22 SNV frequencies in the plasmid library and in day 5 gDNA samples from WT HAP1 cells suggests plasmid contamination in gDNA. Indeed, primer homology to a repetitive element in the exon 22 library was identified. Consequently, the WT HAP1 exon 22 data was removed from analysis and a different primer specific to gDNA was used to prepare exon 22 sequencing amplicons from HAP1-Lig4KO cells. The low HAP1-Lig4KO correlations between exon 18 SNV frequencies in day 5 gDNA and RNA and between RNA replicates suggests RNA sample bottlenecking consequential to low RNA yields. Therefore, exon 18 RNA was also excluded from analysis. Consistent with the higher rates of HDR-mediated genome editing (Fig. 2a), replicate correlations (middle columns) were generally higher in HAP1-Lig4KO cells than WT HAP1 cells. CADD scores predict the deleteriousness of each SNV, and are therefore negatively correlated with function scores (rightmost columns).
Extended Data Figure 5 |. Models of SNV editing rates across BRCA1 exons to account for positional biases.

Gene conversion tracts arising during HDR in human cells are short such that library SNVs are introduced to the genome more frequently near the CRISPR target site. We modelled this positional effect in our data for N = 4,002 SNVs (pre-filtering) using a LOESS regression fit on day 5 over library SNV ratios. a, Plots shown here are of the average of n=2 replicates per exon, with the black line indicating the LOESS regression. By day 5, selective effects on gene function are evidenced by nonsense SNVs (red) appearing at lower frequencies compared to neighbouring SNVs. Therefore, to best approximate the SNV editing rate as a function of position alone (i.e. the ‘baseline’), the regression excluded SNVs that were selected against between day 11 and day 5 (see Methods). b,c, Day 11 over library SNV ratios were adjusted by the positional fit for each experiment in calculating function scores. This adjustment is illustrated here for an exon 3 replicate by plotting the day 11 over library ratio as a function of position before (b) and after (c) adjustment for (N = 298 SNVs). The elevated day 11 over library ratios for SNVs near the CRISPR cleavage site (indicated with an arrow) are corrected to achieve a more uniform baseline across the mutagenized region. d,e, The distributions of SNV day 11 over library ratios before and after accounting for positional effects are shown, colored by mutational consequence (N = 4,002 SNVs, averaged across n=2 replicates).
Extended Data Figure 6 |. SNV filtering to prevent erroneous functional classification.
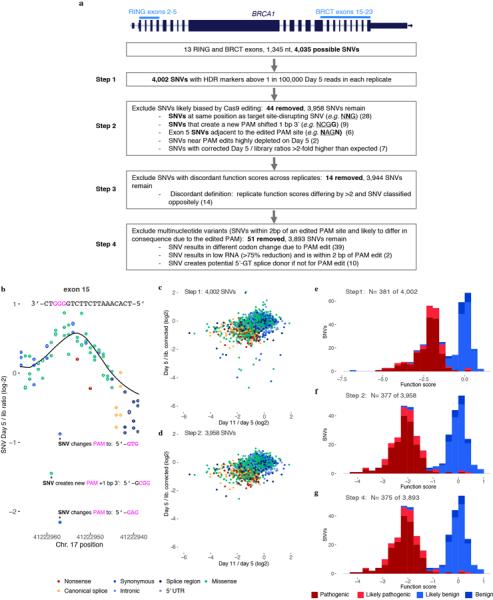
a, The flow chart describes filters used to produce the final SNV data set and shows how many SNVs were removed at each step. b, Raw day 5 over library SNV ratios are shown for a portion of exon 15 to illustrate how re-editing biases necessitate filtering. The three depleted SNVs marked with asterisks create alternative PAM sequences that likely allow the Cas9:gRNA complex to re-cut the locus and cause their removal. For other SNVs, the fixed PAM edit (a GGG to GCG synonymous change) minimalizes re-editing. The location of the target PAM is underlined and each indicated SNV is bolded in the annotations. The LOESS regression curve in shown in black. c,d, Plots show the relationship between day 5 over library and day 11 over day 5 ratios before (c) and after (d) filtering steps 1 and 2. Filtering removes outliers because editing biases primarily affect the day 5 over library ratio. e–g, Histograms show the distributions of function scores for SNVs deemed ‘pathogenic’ or ‘benign’ in ClinVar at different stages of filtering. Scores in e are derived prior to normalization across exons.
Extended Data Figure 7 |. Mixture modeling of scores to classify SNVs by functional effect.
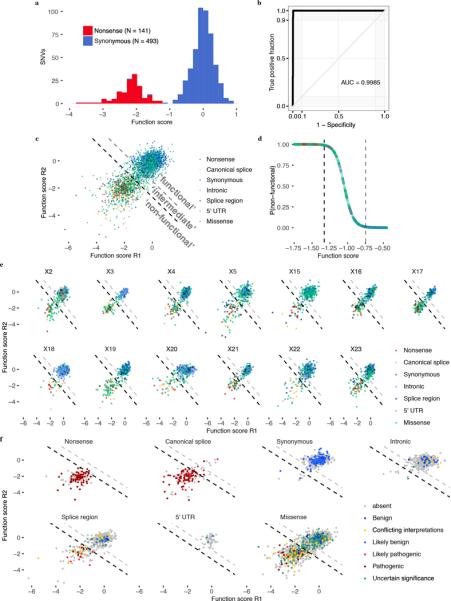
a, Distributions of ‘non-functional’ and ‘functional’ SNVs plotted here were defined respectively as all nonsense SNVs and all synonymous SNVs with RNA scores within 1 SD of the median synonymous SNV. b, An ROC curve was generated using SGE function scores to distinguish the 634 ‘functional’ and ‘non-functional’ SNVs defined in a. c, A two-component Gaussian mixture model was used to produce point estimates of the probability that each SNV was ‘non-functional’, P(nf), given its average function score across replicates. These P-values are plotted in d against function scores for a subset of the data. Thresholds were set such that P(nf) < 0.01 corresponds to ‘functional’, and P(nf) > 0.99 corresponds to ‘non-functional’, and 0.01 < P(nf) < 0.99 corresponds ‘intermediate’ classification. Functional classification thresholds are drawn as dashed lines; black denotes the non-functional threshold and gray the intermediate threshold. e,f, SNV function scores across replicates are plotted for each exon with SNVs colored by mutational consequence (e), and for each type of mutational consequence with SNVs colored by ClinVar status (f). Using the optimal function score cutoff for all SNVs tested (Fig. 3b), sensitivities and specificities for distinguishing ‘Pathogenic’/’Likely pathogenic’ from ‘Benign’/’Likely benign’ ClinVar annotations for each type of mutation are as follows: 92.7% and 92.9% for missense SNVs (N = 55), 100% and 100% for splice region SNVs (N = 23), and 95.2% sensitivity for canonical splice site SNVs (N = 83; specificity not calculable).
Extended Data Figure 8 |. BRCA1 SNVs observed more frequently in large-scale population sequencing are more likely to score as functional.
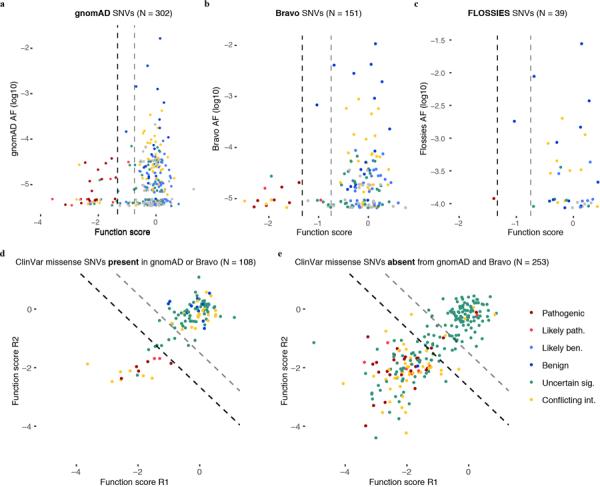
a–c, SNV function scores are plotted against gnomAD (a), Bravo (b), and FLOSSIES (c) allele frequencies. a, Among the 302 SNVs assayed also present in gnomAD, higher allele frequencies associate with higher function scores (Wilcoxon Signed Rank Test, P = 3.7 × 10⁻¹²). . b, Bravo is a collection of whole genome sequences ascertained from 62,784 individuals through the NHLBI TOPMed program. Similarly to SNVs present in gnomAD, higher allele frequencies in Bravo correlate with higher function scores. c, FLOSSIES is a database of variants seen in targeted sequencing of breast cancer genes sampled from approximately 10,000 cancer-free women at least 70 years old. Only 1 of 39 assayed SNVs present in FLOSSIES scored as non-functional. c,d, Missense SNVs in ClinVar are separated by whether they have (c) or have not (d) been seen in either gnomAD or Bravo and function scores across replicates are plotted, with dashed lines demarcating functional classes. A higher proportion of ClinVar missense SNVs absent from gnomAD and Bravo score as non-functional (50.6% vs. 15.7%, Fisher’s exact P = 1.80 × 10⁻¹⁷).
Extended Data Figure 9 |. SGE function scores correlate with computational metrics and perform favorably at predicting ClinVar annotations.
a, SNV function scores are plotted against mammalian phyloP scores, with colors indicative of ClinVar status (Spearman’s correlation shown). b,c, ROC curves show the performance of CADD scores and phyloP scores for discriminating ClinVar ‘pathogenic’ and ‘benign’ SNVs (including ‘likely’), as described in Fig. 3b for SGE data. d-g Plots as in a, but for missense SNVs only, showing correlations between SGE function scores and CADD29 scores, phyloP scores30, Grantham differences (Grantham amino acid variation minus Grantham amino acid deviation; GV - GD), and align-GVGD classifications42. Missense SNV function scores also correlate with SIFT scores43 (⍴ = 0.363) and PolyPhen-2 scores44 (⍴ = −0.277). (P < 1 × 10−37 for all correlations.) h–l, ROC curves assess the performance of SGE function scores and each indicated metric at distinguishing firmly ‘pathogenic’ and ‘benign’ missense SNVs. (i.e. not including ‘likely’). m,n, SGE scores for missense variants are plotted against results from homology-directed repair assays9,32 (m) and results from transcriptional activation assays12 (n). In cases where multiple SNVs assayed lead to same amino acid substitution, function scores were averaged and colored red if either SNV had an RNA score less than −2. Box plots depict the sample median (line) and the interquartile range (box).
Extended Data Figure 10 |. Evidence supporting SNV scores in discordance with ClinVar classifications.
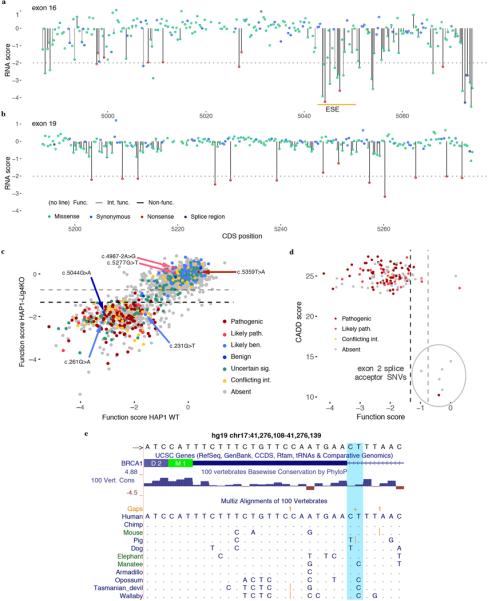
a,b, Complete maps of RNA scores for exons 16 (a) and exon 19 (b) reveal highly variable sensitivity to RNA depletion. The location of the strongest predicted exonic splice enhancer in exon 16 is indicated by the orange line37. c, Function scores (means from two replicates) are plotted to compare results from preliminary experiments in WT HAP1 to those in HAP1-Lig4KO. Data is shown only for experiments with Spearman’s correlations between replicates greater than 0.50 in WT HAP1 cells (2,096 SNV; exons 3, 4, 5, 16, 17, 19, 21). Discordantly classified SNVs are indicated with arrows. c.−19–2A>G was the only firmly discordant SNV whose function score could not be corroborated in WT HAP1, consequent to low reproducibility of exon 2 WT function scores. Indeed, c.−19–2A>G scored highly variably between WT replicates. d, The sequence-function map of exon 21 is shown with the function scores for the two ‘pathogenic’ SNVs observed in linkage indicated. Dashed lines demarcate functional classifications. c, Function scores are plotted against CADD scores for all canonical splice SNVs assayed, colored by ClinVar status. The six possible exon 2 splice acceptor SNVs (circled) have the lowest CADD scores among all canonical splice SNVs assayed, and none score as ‘non-functional’. e, A USCS Genome Browser shot shows the PhyloP conservation track and selected mammalian sequence alignments for the exon 2 acceptor region, with the canonical acceptor site nucleotides highlighted in light blue. (hg19 chr17:41,276,108–41,276,139). Multiple mammalian species are identified that have a G at position c.−19–2 of the human transcript (corresponding to a C in the plus-strand orientation shown).
Supplementary Material
ACKNOWLEDGEMENTS
We thank Malte Spielmann, Daniela Witten, Aaron McKenna, Martin Kircher, Max Dougherty, John Lazar, Yi Yin, and Brian Shirts for insights on data analysis and/or comments on the manuscript, Jacob Kitzman for sharing reagents and protocols, Rocío Acuña-Hidalgo, Jennifer Milbank, and Elke van Veen for experimental assistance, and the Feng Zhang lab for sharing Cas9/gRNA plasmids. This work was supported by an NIH Director’s Pioneer Award (DP1HG007811 to J.S.) and a training award from the National Cancer Institute (F30CA213728 to GMF). JS is an Investigator of the Howard Hughes Medical Institute.
Footnotes
DATA AND CODE AVAILABILITY
Function scores are freely available for all nonprofit uses (see https://sge.gs.washington.edu/BRCA1/), as well as by nonexclusive license under reasonable terms to commercial entities that have committed to open sharing of BRCA1 sequence variants. Sequencing data is available at GEO under accession GSE117159.
Custom scripts for analyzing sequencing data were written in Python and R. All code is available at: https://github.com/shendurelab/saturationGenomeEditing_pipeline.
AUTHOR INFORMATION
The authors declare no competing financial interests.
Correspondence should be addressed to J.S. (shendure@uw.edu) or L.M.S. (lstarita@uw.edu).
REFERENCES
- 1.Rehm HL et al. ClinGen — The Clinical Genome Resource. N. Engl. J. Med 372, 2235–2242 (2015). [DOI] [PMC free article] [PubMed] [Google Scholar]
- 2.Kuchenbaecker KB et al. Risks of Breast, Ovarian, and Contralateral Breast Cancer for BRCA1 and BRCA2 Mutation Carriers. JAMA 317, 2402–2416 (2017). [DOI] [PubMed] [Google Scholar]
- 3.Hall JM et al. Linkage of early-onset familial breast cancer to chromosome 17q21. Science 250, 1684–1689 (1990). [DOI] [PubMed] [Google Scholar]
- 4.Olopade OI & Artioli G Efficacy of risk-reducing salpingo-oophorectomy in women with BRCA-1 and BRCA-2 mutations. Breast J 10 Suppl 1, S5–9 (2004). [DOI] [PubMed] [Google Scholar]
- 5.Rebbeck TR et al. Bilateral prophylactic mastectomy reduces breast cancer risk in BRCA1 and BRCA2 mutation carriers: the PROSE Study Group. J. Clin. Oncol 22, 1055–1062 (2004). [DOI] [PubMed] [Google Scholar]
- 6.Easton DF et al. Gene-Panel Sequencing and the Prediction of Breast-Cancer Risk. N. Engl. J. Med 372, 2243–2257 (2015). [DOI] [PMC free article] [PubMed] [Google Scholar]
- 7.Landrum MJ et al. ClinVar: public archive of interpretations of clinically relevant variants. Nucleic Acids Res 44, D862–8 (2016). [DOI] [PMC free article] [PubMed] [Google Scholar]
- 8.Millot GA et al. A guide for functional analysis of BRCA1 variants of uncertain significance. Hum. Mutat 33, 1526–1537 (2012). [DOI] [PMC free article] [PubMed] [Google Scholar]
- 9.Ransburgh DJR, Chiba N, Ishioka C, Toland AE & Parvin JD Identification of breast tumor mutations in BRCA1 that abolish its function in homologous DNA recombination. Cancer Res 70, 988–995 (2010). [DOI] [PMC free article] [PubMed] [Google Scholar]
- 10.Pierce AJ, Hu P, Han M, Ellis N & Jasin M Ku DNA end-binding protein modulates homologous repair of double-strand breaks in mammalian cells. Genes Dev 15, 3237–3242 (2001). [DOI] [PMC free article] [PubMed] [Google Scholar]
- 11.Bouwman P et al. A high-throughput functional complementation assay for classification of BRCA1 missense variants. Cancer Discov 3, 1142–1155 (2013). [DOI] [PubMed] [Google Scholar]
- 12.Woods NT et al. Functional assays provide a robust tool for the clinical annotation of genetic variants of uncertain significance. Npj Genomic Medicine 1, 16001 (2016). [DOI] [PMC free article] [PubMed] [Google Scholar]
- 13.Starita LM et al. Massively Parallel Functional Analysis of BRCA1 RING Domain Variants. Genetics 200, 413–422 (2015). [DOI] [PMC free article] [PubMed] [Google Scholar]
- 14.Steffensen AY et al. Functional characterization of BRCA1 gene variants by mini-gene splicing assay. Eur. J. Hum. Genet 22, 1362–1368 (2014). [DOI] [PMC free article] [PubMed] [Google Scholar]
- 15.de la Hoya M et al. Combined genetic and splicing analysis of BRCA1 c.[594–2A>C; 641A>G] highlights the relevance of naturally occurring in-frame transcripts for developing disease gene variant classification algorithms. Hum. Mol. Genet 25, 2256–2268 (2016). [DOI] [PMC free article] [PubMed] [Google Scholar]
- 16.Ghosh R, Oak N & Plon SE Evaluation of in silico algorithms for use with ACMG/AMP clinical variant interpretation guidelines. Genome Biol 18, 225 (2017). [DOI] [PMC free article] [PubMed] [Google Scholar]
- 17.Gibson TJ, Seiler M & Veitia RA The transience of transient overexpression. Nat. Methods 10, 715 (2013). [DOI] [PubMed] [Google Scholar]
- 18.Moynahan ME, Chiu JW, Koller BH & Jasin M Brca1 controls homology-directed DNA repair. Mol. Cell 4, 511–518 (1999). [DOI] [PubMed] [Google Scholar]
- 19.Drost R et al. BRCA1 RING function is essential for tumor suppression but dispensable for therapy resistance. Cancer Cell 20, 797–809 (2011). [DOI] [PubMed] [Google Scholar]
- 20.Shakya R et al. BRCA1 Tumor Suppression Depends on BRCT Phosphoprotein Binding, But Not Its E3 Ligase Activity. Science 334, 525–528 (2011). [DOI] [PMC free article] [PubMed] [Google Scholar]
- 21.Vega A et al. The R71G BRCA1 is a founder Spanish mutation and leads to aberrant splicing of the transcript. Hum. Mutat 17, 520–521 (2001). [DOI] [PubMed] [Google Scholar]
- 22.Findlay GM, Boyle EA, Hause RJ, Klein JC & Shendure J Saturation editing of genomic regions by multiplex homology-directed repair. Nature 513, 120–123 (2014). [DOI] [PMC free article] [PubMed] [Google Scholar]
- 23.Blomen VA et al. Gene essentiality and synthetic lethality in haploid human cells. Science 350, 1092–1096 (2015). [DOI] [PubMed] [Google Scholar]
- 24.Ran FA et al. Genome engineering using the CRISPR-Cas9 system. Nat. Protoc 8, 2281–2308 (2013). [DOI] [PMC free article] [PubMed] [Google Scholar]
- 25.Beumer KJ et al. Efficient gene targeting in Drosophila by direct embryo injection with zinc-finger nucleases. Proc. Natl. Acad. Sci. U. S. A 105, 19821–19826 (2008). [DOI] [PMC free article] [PubMed] [Google Scholar]
- 26.Essletzbichler P et al. Megabase-scale deletion using CRISPR/Cas9 to generate a fully haploid human cell line. Genome Res 24, 2059–2065 (2014). [DOI] [PMC free article] [PubMed] [Google Scholar]
- 27.Lek M et al. Analysis of protein-coding genetic variation in 60,706 humans. Nature 536, 285–291 (2016). [DOI] [PMC free article] [PubMed] [Google Scholar]
- 28.whi.color.com. FLOSSIES Available at: https://whi.color.com/gene/ENSG00000012048. (Accessed: 9th October 2017)
- 29.Kircher M et al. A general framework for estimating the relative pathogenicity of human genetic variants. Nat. Genet 46, 310–315 (2014). [DOI] [PMC free article] [PubMed] [Google Scholar]
- 30.Pollard KS, Hubisz MJ, Rosenbloom KR & Siepel A Detection of nonneutral substitution rates on mammalian phylogenies. Genome Res 20, 110–121 (2010). [DOI] [PMC free article] [PubMed] [Google Scholar]
- 31.Tavtigian SV, Byrnes GB, Goldgar DE & Thomas A Classification of rare missense substitutions, using risk surfaces, with genetic- and molecular-epidemiology applications. Hum. Mutat 29, 1342–1354 (2008). [DOI] [PMC free article] [PubMed] [Google Scholar]
- 32.Towler WI et al. Analysis of BRCA1 variants in double-strand break repair by homologous recombination and single-strand annealing. Hum. Mutat 34, 439–445 (2013). [DOI] [PMC free article] [PubMed] [Google Scholar]
- 33.Starita LM, et al. A multiplexed homology-directed DNA repair assay reveals the impact of over 1,000 BRCA1 missense substitution variants on protein function. Am. J. Hum. Genet (in press) [DOI] [PMC free article] [PubMed] [Google Scholar]
- 34.Brzovic PS, Rajagopal P, Hoyt DW, King MC & Klevit RE Structure of a BRCA1-BARD1 heterodimeric RING-RING complex. Nat. Struct. Biol 8, 833–837 (2001). [DOI] [PubMed] [Google Scholar]
- 35.Shiozaki EN, Gu L, Yan N & Shi Y Structure of the BRCT repeats of BRCA1 bound to a BACH1 phosphopeptide: implications for signaling. Mol. Cell 14, 405–412 (2004). [DOI] [PubMed] [Google Scholar]
- 36.Wegrzyn JL, Drudge TM, Valafar F & Hook V Bioinformatic analyses of mammalian 5’-UTR sequence properties of mRNAs predicts alternative translation initiation sites. BMC Bioinformatics 9, 232 (2008). [DOI] [PMC free article] [PubMed] [Google Scholar]
- 37.Desmet F-O et al. Human Splicing Finder: an online bioinformatics tool to predict splicing signals. Nucleic Acids Res 37, e67 (2009). [DOI] [PMC free article] [PubMed] [Google Scholar]
- 38.Gasperini M, Starita L & Shendure J The power of multiplexed functional analysis of genetic variants. Nat. Protoc 11, 1782–1787 (2016). [DOI] [PMC free article] [PubMed] [Google Scholar]
- 39.Starita LM et al. Variant Interpretation: Functional Assays to the Rescue. Am. J. Hum. Genet 101, 315–325 (2017). [DOI] [PMC free article] [PubMed] [Google Scholar]
- 40.Plon SE et al. Sequence variant classification and reporting: recommendations for improving the interpretation of cancer susceptibility genetic test results. Hum. Mutat 29, 1282–1291 (2008). [DOI] [PMC free article] [PubMed] [Google Scholar]
- 41.Lovelock PK et al. Identification of BRCA1 missense substitutions that confer partial functional activity: potential moderate risk variants? Breast Cancer Res 9, R82 (2007). [DOI] [PMC free article] [PubMed] [Google Scholar]
- 42.Tavtigian SV et al. Comprehensive statistical study of 452 BRCA1 missense substitutions with classification of eight recurrent substitutions as neutral. J. Med. Genet 43, 295–305 (2006). [DOI] [PMC free article] [PubMed] [Google Scholar]
- 43.Kumar P, Henikoff S & Ng PC Predicting the effects of coding non-synonymous variants on protein function using the SIFT algorithm. Nat. Protoc 4, 1073–1081 (2009). [DOI] [PubMed] [Google Scholar]
- 44.Adzhubei I & Jordan DM Predicting functional effect of human missense mutations using PolyPhen‐2. Current protocols in Human Genetics 76, 7.20.1–7.20.41 (2013). [DOI] [PMC free article] [PubMed] [Google Scholar]
- 45.Carette JE et al. Ebola virus entry requires the cholesterol transporter Niemann-Pick C1. Nature 477, 340–343 (2011). [DOI] [PMC free article] [PubMed] [Google Scholar]
- 46.Walsh T et al. Detection of inherited mutations for breast and ovarian cancer using genomic capture and massively parallel sequencing. Proc. Natl. Acad. Sci. U. S. A 107, 12629–12633 (2010). [DOI] [PMC free article] [PubMed] [Google Scholar]
- 47.Hsu PD et al. DNA targeting specificity of RNA-guided Cas9 nucleases. Nat. Biotechnol 31, 827–832 (2013). [DOI] [PMC free article] [PubMed] [Google Scholar]
- 48.Doench JG et al. Optimized sgRNA design to maximize activity and minimize off-target effects of CRISPR-Cas9. Nat. Biotechnol 34, 184 (2016). [DOI] [PMC free article] [PubMed] [Google Scholar]
- 49.Colombo M et al. Comprehensive annotation of splice junctions supports pervasive alternative splicing at the BRCA1 locus: a report from the ENIGMA consortium. Hum. Mol. Genet 23, 3666–3680 (2014). [DOI] [PubMed] [Google Scholar]
- 50.Romero A et al. BRCA1 Alternative splicing landscape in breast tissue samples. BMC Cancer 15, 219 (2015). [DOI] [PMC free article] [PubMed] [Google Scholar]
Associated Data
This section collects any data citations, data availability statements, or supplementary materials included in this article.