

Abstract
Synaptic dysfunction and loss are core pathological features in Alzheimer disease (AD). In the vicinity of amyloid-β plaques in animal models, synaptic toxicity occurs and is associated with chronic activation of the phosphatase calcineurin (CN). Indeed, pharmacological inhibition of CN blocks amyloid-β synaptotoxicity. We therefore hypothesized that CN-mediated transcriptional changes may contribute to AD neuropathology and tested this by examining the impact of CN overexpression on neuronal gene expression in vivo. We found dramatic transcriptional downregulation, especially of synaptic mRNAs, in neurons chronically exposed to CN activation. Importantly, the transcriptional profile parallels the changes in human AD tissue. Bioinformatics analyses suggest that both nuclear factor of activated T cells (NFAT) and numerous microRNAs may all be impacted by CN, and parallel findings are observed in AD. These data and analyses support the hypothesis that at least part of the synaptic failure characterizing AD may result from aberrant CN activation leading to downregulation of synaptic genes, potentially via activation of specific transcription factors and expression of repressive microRNAs.
Graphical abstract
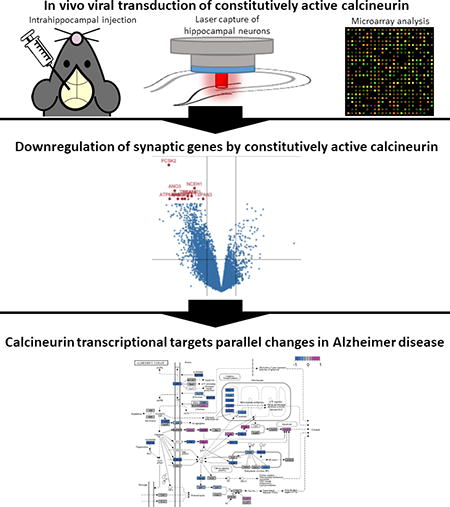
We hypothesized that calcineurin-mediated transcriptional changes may contribute to neuropathological changes in Alzheimer’s disease due to its involvement in amyloid-mediated synaptic defects. We tested this hypothesis by examining the impact of constitutively active calcineurin on neuronal gene expression in vivo by intrahippocampal viral transduction followed by laser capture of neuronal cell bodies and microarray analysis of gene expression. We found dramatic transcriptional downregulation, especially of synaptic mRNAs, in hippocampal neurons chronically transduced with constitutively active calcineurin. Importantly, the transcriptional profile parallels the changes in human Alzheimer’s disease tissue. Additional bioinformatics analyses suggest that both nuclear factor of activated T cells (NFAT) and numerous microRNAs may all be impacted by calcineurin, and parallel findings are observed in Alzheimer’s disease. These data and analyses support the hypothesis that at least part of the synaptic failure characterizing Alzheimer’s disease may result from aberrant calcineurin activation leading to downregulation of synaptic genes, potentially via activation of specific transcription factors and expression of repressive microRNAs.
Introduction
Calcium homeostasis dysregulation is an important component of neurotoxicity in Alzheimer disease (AD) and may underlie many of the neurotoxic effects of amyloid β (Aβ) (Mattson and Chan, 2003; Supnet and Bezprozvanny, 2010; Woods and Padmanabhan, 2012; Popugaeva et al., 2017). Elevation of cytosolic calcium is triggered by Aβ oligomers (Shankar et al., 2007; Kuchibhotla et al., 2008; Sepúlveda et al., 2014; Wu et al., 2010a; Arbel-Ornath et al., 2017), leading to downstream activation of many pathways, including the calcium/calmodulin-dependent serine/threonine-phosphatase calcineurin (CN, or protein phosphatase 2B) (Wu et al., 2010a; Kuchibhotla et al., 2008; Spires-Jones et al., 2011; Mohmmad Abdul et al., 2011a). Aβ-mediated calcineurin activation may have multiple mechanisms impacting the synapse, involving both direct dephosphorylation of cytoplasmic substrates such as GSK3b, cofilin, and AKAP79 (Hernández et al., 2010; Kamat et al., 2016; Zhou et al., 2004; Bhattacharyya et al., 2009; Jurado et al., 2010) as well as activation of transcription factors. CN dephosphorylates four of the five members of the nuclear factor of activated T-cells (NFAT) transcription factor family, (NFATc1, NFATc2, NFATc3, and NFATc4), all of which are activated by calcium-mediated signaling, inducing nuclear translocation and activation of target genes associated with neuronal survival, axonal outgrowth and dendritic arborization (Benedito et al., 2005; Nguyen and Di Giovanni, 2008; Schwartz et al., 2009; Serrano-Pérez et al., 2015). Increased NFAT localization in the nucleus is observed in brains from AD patients or from neurons derived from transgenic mice harboring amyloid precursor protein (APP) mutations (Abdul et al., 2009; Wu et al., 2010a), and NFAT blockade diminishes Aβ-induced dendritic spine loss in mice (Hudry et al., 2012) suggesting the activation of an NFAT-mediated transcriptional program in AD. By and large, most differentially expressed genes in AD tissue are downregulated (Berchtold et al., 2013) which has generally been attributed to loss of neurons. However, down regulation in AD may be a consequence of transcriptional repression rather than an artifact of cell loss; indeed, NFAT can act as a powerful transcriptional repressor in neurons (Nguyen et al., 2009). The study herein aims to clarify the transcriptional role of the CN and/or NFAT pathway in neurons as it relates to gene downregulation in AD.
In order to directly test the hypothesis that CN activation contributes to synaptic dysfunction in AD, we asked whether the pattern of genes altered by CN in neurons was similar to changes observed in AD. However, CN related gene alterations have not been previously explored in neurons in vivo. We therefore first expressed CN and constitutively activated CN (caCN) in hippocampal neurons in the mouse brain, using adeno-associated virus (AAV) transduction. This construct has previously been shown to increase translocation of NFAT to the nucleus and lead to NFAT-mediated transcription as measured by luciferase assay (Hudry et al., 2012). Truncated versions of CN is observed in the human AD brain, including versions lacking the auto-inhibitory C-terminal domain leading to constitutive activation of CN targets (Liu et al., 2005; Wu et al., 2010b; Mohmmad Abdul et al., 2011b); therefore AAV-mediated chronic caCN likely mimics the effects one might see in the context of AD. We then compared the pattern of gene expression changes following caCN activation with those previously reported to occur in human cases of AD. In mouse hippocampal neurons, CN led to substantial downregulation of numerous transcripts, especially those related to synaptic physiology. This pattern had striking overlap with the pattern of changes observed in AD brain, supporting the hypothesis that CN activation contributes to synaptic dysfunction in AD. Further, CN activation overall mediated a substantial downregulation in gene expression which we found may be related to activation of a large number of micro-RNAs (miRNAs), many of which are also expressed in AD, suggesting a potential mechanism for the overall transcriptional downregulation which we observed.
Materials and Methods
Animals
In vivo experiments were performed on 3–4 month old adult male C57BL/6J mice (the Jackson Laboratory, stock #00064, RRID:IMSR_JAX:000664) weighing 22–25 grams. Animals were socially housed with environmental enrichment (igloos) at 3–4 mice per cage with ad libitum access to food and water on a 12/12 light/dark cycle. Experiments were approved by the Massachusetts General Hospital Institutional Animal Care and Use Committee (protocol #2004N000092) and carried out in accordance with the Massachusetts General Hospital Subcommittee on Research Animal Care following guidelines set forth by the National Institutes of Health Guide for the Care and Use of Laboratory Animals. The study was not pre-registered.
Viral vectors construction and production
The constructions of AAV-CBA-HA-caCN and AAV-CBA-HA-wtCN backbones were previously described (Wu et al., 2010a). Briefly, CaNwt and CaNCA (amino acid residues 1–399) were subcloned into AAV–cytomegalovirus (CMV)/chicken β-actin (CBA)–woodchuck posttranscriptional regulatory element (WPRE) vector. The caCN construct includes amino acid residues 1–399, excluding the auto-inhibitory domain. As a control, we used a green fluorescent protein (GFP) virus, AAV-CBA-GFP, that was available at the Harvard Gene Therapy Core. AAV serotype 2 vectors were produced after triple-transfection of HEK293 cells and genome copy titers were determined by qRT-PCR by the Harvard Gene Therapy Core. All the constructs were verified by sequencing. We confirmed that the coding sequence of the two CN constructs were not complementary to the Affymetrix Mouse Genome 430 Array probe sequences for CN using Basic Local Alignment Search Tool (BLAST; Altschul et al., 1990). While the AAV promoter was the general promoter CBA, the AAV serotype 2 has selective tropism for neurons (Watakabe et al., 2015; Taymans et al., 2007; Choudhury et al., 2017).
Stereotactic intrahippocampal injections
Stereotactic intrahippocampal injections of AAV serotype 2 vectors were performed as described previously (Hudry et al., 2012). During the day in the laboratory surgical suite, animals were anesthetized by intraperitoneal injection of ketamine/xylazine (100mg/kg and 50mg/kg body weight, respectively) and positioned on a stereotactic frame (David Kopf Instruments, Tujunga, CA). Ketamine/xylazine was chosen as it is considered relatively safe in mice and achieves effective analgesia, muscle relaxation, and sedation. Injections of vectors were performed in the hippocampus of each hemisphere with 3µl of viral preparation (titer 2×10¹² vg/ml) using a 30-gauge sharp micropipette attached to a 10-µl Hamilton syringe (Hamilton Medical, Reno, NV) at a rate of 0.2 µl/minute. The hippocampus was chosen due to its pathological targeting in AD. Stereotactic coordinates of injection sites were calculated from bregma to target the hippocampus (anteroposterior −2 mm, mediolateral ± 1.7 mm and dorsoventral −2mm). In order to avoid the confounding factor of the injury from injection and viral immune activation (Lowenstein and Castro, 2003), we used both a non-viral (phosphate buffered saline, PBS) and viral (GFP) controls. Injections of each group occurred on different days in order to prevent repeated freeze-thaw cycles of the virus; therefore, there was no specific randomization for injection order. Mice were treated with buprenorphine (Buprenex Injection, #7571, 0.05mg/kg) subcutaneously immediately following surgery and given access to Tylenol water (Gericare NDC 57896-180-16, 10ml into 250ml of water) for the 3 days following surgery for analgesia; mice were monitored for appropriate recovery from surgery. The sample size was evaluated using the sample size calculators from Massachusetts General Hospital Biostatistics Center (http://hedwig.mgh.harvard.edu/sample_size/size.html). We estimated that 6 samples per group were needed in order to detect a difference in means of 30% and taking into account a standard deviation of the outcome variable of 0.1 (power set at 0.8 and a significance level of 0.05). An overall experimental outline is illustrated in Figure 1A.
Figure 1.

Experimental design, laser capture and confirmation of CN gene expression. (a) 6–7 male C57 mice were injected with AAV for caCN, wtCN, GFP, or injected with PBS as a control. 1 month later, mice were euthanized and their brains isolated and frozen for subsequent laser capture of hippocampal pyramidal neurons and microarray analysis. (b) An average of 460 neuronal cell bodies were selected from the hippocampus based on HA or GFP staining. Before and after images illustrate captured hippocampal cells. (c) In addition to staining for HA tag, AAV transduction was confirmed by qPCR using primers targeting the junction between CN and WPRE; data is shown as a normalized ratio of the Ct of CN/WPRE and the housekeeping gene GAPDH. Error bars indicate standard error of the mean.
Euthanasia, tissue processing, and laser capture
One month after injection with AAVs, mice were euthanized by CO2 asphyxiation. Brains were dissected and snap frozen in liquid nitrogen. Sections (10 µm) were generated on a cryostat, mounted on Gold Seal slides and stored at −80C for a few days before immunostaining and microdissection. After a short fixation step in cold acetone (1’), staining for HA (Mouse monoclonal anti-HA antibody, Biolegend #901513, RRID:AB_2565335) or GFP (Rabbit anti-GFP, Abcam #ab6556, RRID:AB_305564) was performed on ice following a rapid protocol in order to preserve the RNA integrity (15’ incubation with the primary antibodies and 10’ with appropriate Alexa-488 conjugated secondary antibodies). An average of 460 pyramidal neuronal cell bodies positive for either HA or GFP were dissected and collected mostly from hippocampal CA3/CA1 pyramidal neurons and DG granule neurons using laser capture (Figure 1B); the order of collection was randomized by mouse treatment group (simple randomization method). After RNA extraction using the Arcturus® PicoPure® Frozen RNA Isolation Kit (ThermoFisher Scientific #KIT0214), RNA quality and quantification was assessed using the Agilent RNA 6000 Pico Kit (Agilent Technologies, # 5067–1513). From the samples collected, 6–7 samples per condition (PBS, AAV-GFP, AAV-caCN, AAV-wtCN) were sent for microarray analysis after testing for expression of the AAV transgene by qPCR (Figure 1B). To examine expression of only AAV expressed CN and not endogenous CN, we used primers at the junction of the CN cassette and the Woodchuck Hepatitis Virus Posttranscriptional Regulatory Element (WPRE): 5'-TCTCAACATCTGCTCCGACGAT-3' (annealing on 3' end of CN cDNA) and 5'-AAGCAGCGTATCCACATAGCG-3' (annealing on 5' end of WPRE, present in the mRNA transcribed from AAV but not translated).
Microarray statistical analysis
Gene expression was measured using a GeneChip® High-throughput Perfect Match Array Mouse Genome 430 (HT MG-430 PM Array, Affymetrix, # 901258). Treatment groups were de-identified and replaced with numbers rather than names prior to samples being sent for microarray quantification as to blind the analysis; groups were identified following initial data analysis. Microarray data were first normalized using Robust Multichip Average (RMA) (Bolstad et al., 2003; Irizarry et al., 2003) using the justRMA Bioconductor package for R (https://www.bioconductor.org/packages/devel/bioc/manuals/affy/man/affy.pdf). The mean expression of technical replicates was computed for each sample. Principal component analysis (PCA) was performed to identify outlying samples, none were found. Surrogate Variable Analysis (SVA) was used to remove unwanted variation in the data (Leek and Storey, 2007); then differentially expressed genes were identified between the groups using the limma package in R (Ritchie et al., 2015) with an adjusted p-value cutoff of 0.05 and an absolute value fold change cutoff of 2 using the Benjamini–Hochberg procedure. Ensembl release 89’s BioMart was used to find human orthologs for the mouse genes (Yates et al., 2016). Functional categories of the differentially expressed genes were determined using DAVID EASE (Huang et al., 2009). Finally, the Gene Set Enrichment Analysis (GSEA) software (Subramanian et al., 2005) was used to compute enrichment of AD and NFAT/CN related gene sets, which were identified using the keywords “Alzheimer”, “NFAT” and “Calcineurin” (Subramanian et al., 2005). For genes with multiple microarray probes, data is reported as the probe that has the maximum difference in the experiment for each gene. All transcript names are reported as human gene orthologs.
Expression analysis of MSBB_Human_Hippocampus_B3_B1 dataset
RNA expression data was obtained from the Accelerating Medicines Partnership Alzheimer Disease (AMP-AD) knowledge portal (found at https://www.synapse.org/#!Synapse:syn2580853/). The human hippocampus dataset was downloaded from the Mount Sinai Brain Bank (MSBB) AD Cohort. The MSBB raw data underwent correction for covariates such as sex, PMI, pH and race prior to download and our downstream analysis; this original information can be obtained from the AMP-AD database directly. The 33 samples were grouped by a neuropathological score assessing the distribution of tau neurofibrillary tangles in the subject's brain (Braak and Braak, 1991). This analysis compared RNA expression observed in a group of Braak stages V/VI subject brain tissues with that observed in a group of normal and Braak stage I/II subject brains (Table 1). Analysis was performed using the Limma package in R (Ritchie et al., 2015). No prior filtering on probes was performed, neither on variance nor intensity.
Table 1.
Division of Braak stages for data analysis
| STAGING FOR ANALYSIS | BRAAK STAGE | REGIONS WITH TAU PATHOLOGY |
|---|---|---|
| B1 | 0, I/II | None, hippocampus |
| B2 | III/IV | Hippocampus, Entorhinal |
| B3 | V/VI | Hippocampus, Entorhinal, Neocortical |
GTEx, Determination of Hippocampus Expressed Genes
GTEX_HIPPOCAMPUS_EXPRESSED_GENES_FPKM10 includes genes expressed with a median FPKM value of 10 or greater in the 123 human hippocampus samples polyA+ RNA-sequenced by the Genotype-Tissue Expression (GTEx) Project. GTEX_HIPPOCAMPUS_EXPRESSED_GENES_FPKM1 is the same, however the cutoff is FPKM value of 1 or greater. The GTEx Project was supported by the Common Fund of the Office of the Director of the National Institutes of Health, and by NCI, NHGRI, NHLBI, NIDA, NIMH, and NINDS. The data used for the analyses described above were obtained from the GTEx Portal on 05/17/17.
Results
Sustained calcineurin expression after AAV intrahippocampal injection
One month following intracortical injection of the AAVs (Figure 1A), brains were sectioned, and cells stained for HA (to detect CN) or GFP. Robust staining of neuronal cell bodies was observed in the pyramidal cell layers of the hippocampus (CA3). To further confirm AAV transduction with CN, we measured expression of CN at the junction of the WPRE (which can detect both wtCN and caCN but not endogenous CN) in the injected mice (Figure 1B). Samples for which RNA quality and CN expression were verified were sent for further gene expression profiling. We specifically chose hippocampal CA3/CA1 pyramidal neurons and DG granule neurons based on location and cell morphology to ensure that we were only examining CN associated changes in neurons. We confirmed the expression of AAV-mediated CN expression by qPCR (Figure 1C) using primers designed to avoid detection of endogenous CN as described in the Methods section above and only used samples for further analysis that demonstrated expression of CN.
Overexpression of caCN or wtCN induces similar changes gene expression patterns in vivo
In order to have a general appreciation of the data dispersion between experimental groups (AAV-caCN, AAV-wtCN, AAV-GFP and PBS injected mice), a principal component analysis of the Affimetrix data was initially performed (PCA; Figure 2A). The caCN (blue) and wtCN (green) specimens cluster separately from the control samples (pink and red). Interestingly, we observed striking overlap between the gene expression patterns induced by wtCN (green) and caCN (blue), thus suggesting that overexpression of CN is sufficient to induce robust transcriptional changes, regardless of the presence of the auto-inhibitory subunit. We speculate that AAV transduction may lead to so much overexpression of wtCN, that there is essentially a “ceiling effect”, leading to effectively identical gene expression patterns between wtCN and caCN. The lack of differences between wtCN and caCN groups are illustrated by volcano plot in Figure 2B. This is in contrast to in vitro literature demonstrating differential effects on synaptotoxicity between wtCN and caCN (Wu et al., 2010a), although the in vitro experiments looked at an acute timepoint after CN overexpression compared to the relatively chronic timepoint of the in vivo experiments herein. The volcano plot comparing wtCN and caCN (Figure 2B) shows a single gene (Crh) that is significantly different between caCN and wtCN using an absolute value log2 fold-change cut off of 1 and an adjusted p-value of 0.05. The gene Crh, which encodes the corticotrophin releasing hormone (CRH), is upregulated in caCN compared to wtCN neurons by approximately 42-fold with an adjusted p-value of 0.046 which corresponds with previously published literature (Zhang et al., 2013).
Figure 2.

Microarray gene expression from laser captured hippocampal an average of 460 neurons treated with AAV-caCN, AAV-wtCN, AAV-GFP, or PBS (n=2 technical replicates of array). (a) PCA of gene expression between caCN, GFP, PBS, and wtCN shows overlap between two CN groups and differences between two control groups (n=6–7 mice pergroup). (b) Volcano plot showing differential expression between caCN and wtCN. Vertical lines indicate an absolute value log2 fold-change cutoff of 1 and a log odds cutoff of −2. (d) Volcano plot showing differential expression between AAV control and caCN. Vertical lines indicate an absolute value log2 fold-change cutoff of 1 and an adjusted p-value cutoff of 0.05. Red points indicate top ten differentially expressed genes between AAV control and caCN.
By contrast with the relative similar transcriptional profiles of caCN and wtCN expressing neurons, a large differential expression is observed between the GFP and PBS samples due the effect of AAV injections; the volcano plot in Figure 2C demonstrates these changes. Approximately 400 genes are differentially expressed between GFP and PBS controls using the same cutoffs; several of which of are ribosomal genes. Previous literature on the transcriptional impact of AAV transduction is relatively sparse, but a handful of studies have been reported, showing in particular that AAV serotype 2 could elicit an ER stress response and trigger UPR signaling pathways in HeLA cells, a phenomenon less prominent after single-stranded AAV2 transduction (Balakrishnan et al., 2013). Other literature reports immune pathways activated by AAV (Zhu et al., 2009; McCaffrey et al., 2008), although the AAV host responses likely vary upon the serotype, the injection route and the transduced cells. We did not observe increases in any of these previously reported pathways between PBS and GFP controls (data not shown).
Since no additional information appears to explain these similarities, as well as the changes between results from the comparison of wtCN and caCN, and because it is evident that the GFP control (which involves injection and expression of AAV) provides a type of control more appropriate for these analyses than PBS injection, we decided to analyze the gene expression alterations between caCN and GFP controls only. We chose the GFP as the control group in order to control for AAV- and protein overexpression-induced differences between the two groups.
Constitutively active CN induces broad changes in gene expression, involving synaptic targets and others
We then compared caCN to the AAV-GFP injected control group. Differential expression level of specific human gene orthologs is demonstrated by volcano plot (Figure 2D). Out of 45,141 mouse gene probes assessed by the microchip, a total of 1,529 genes probes were differentially expressed in caCN vs. GFP control with an adjusted p-value cut off of 0.05 and an absolute value fold-change cutoff of 2 (Supplemental Table 1, S1), which when converted to human gene orthologs was 1,166 out of 15,611 genes that were differentially expressed between caCN and GFP control. Functional categories of the differentially expressed genes, determined using DAVID EASE (Huang et al., 2009), included synapse (p=1.67E-12), membrane (p=8.61E-15), and ion channel (p=4.11E-04) proteins; complete table is available in Supplemental Table 2 (S2). All of the top ten are downregulated by caCN (Table 2), which is reflective of the overall dataset where approximately 90% of the differentially expressed genes are downregulated. Further, all of the top 10 differentially expressed genes are expressed in or specific for brain tissue according to previous literature (Uhlen et al., 2015).
Table 2.
Top ten differentially expressed genes between caCN and GFP
| PROBE | GENE | LOGFC | AVEEXPR | T | P.VALUE | ADJ.P.VAL |
|---|---|---|---|---|---|---|
| 1447992_PM_s_at | PCSK2 | −3.643492661 | 4.753897154 | −24.71465848 | 1.48E-10 | 6.68E-06 |
| 1455227_PM_at | NCEH1 | −1.86390642 | 4.508359 | −18.61877305 | 2.63E-09 | 5.93E-05 |
| 1443612_PM_at | ANO3 | −3.230727027 | 4.493378231 | −17.46060471 | 5.02E-09 | 7.56E-05 |
| 1456089_PM_at | TRIM23 | −2.335549565 | 4.940063923 | −15.8911655 | 1.29E-08 | 0.000125503 |
| 1426775_PM_s_at | SCAMP1 | −2.05968154 | 5.844562615 | −15.77400296 | 1.39E-08 | 0.000125503 |
| 1416009_PM_at | TSPAN3 | −1.264393426 | 7.510420773 | −14.91084693 | 2.44E-08 | 0.000162335 |
| 1442786_PM_s_at | RUFY3 | −2.533310313 | 4.572652538 | −14.80706568 | 2.61E-08 | 0.000162335 |
| 1434800_PM_at | SV2B | −3.014695908 | 6.161590692 | −14.62024925 | 2.96E-08 | 0.000162335 |
| 1422600_PM_at | RASGRF1 | −2.710947787 | 5.397846385 | −14.43618798 | 3.36E-08 | 0.000162335 |
| 1423662_PM_at | ATP6AP2 | −3.584771898 | 6.329993385 | −14.2859548 | 3.73E-08 | 0.000162335 |
We then performed Gene Set Enrichment Analysis (GSEA) on the caCN and GFP samples. The top 50 upregulated and top 50 downregulated features of the caCN and GFP samples determined by GSEA are displayed in the heatmap in Figure 3.
Figure 3.

Heatmap of the top 50 upregulated and top 50 downregulated genes of the caCN and GFP samples determined by GSEA. Colors signify log2 gene expression. Genes that are bolded are significantly different between caCN and GFP control (n=6–7 mice per group).
Calcineurin activated genes overlap with NFAT targets and genes expressed in late stage AD
To test the hypothesis that CN, via NFAT, triggers transcriptional changes in neurons analogous to the changes that occur in AD, GSEA was computed on 22 gene lists relevant to AD or NFAT and Calcineurin pathways. The results of GSEA are visualized using DOSE (Yu et al., 2015) in Figure 4A and 4B and effect sizes are listed in Table 3. GSEA shows significant enrichment of hippocampal genes (GTEX_HIPPOCAMPUS_EXPRESSED_GENES_FPKM10), previously identified human hippocampal AD signature (Blalock et al., 2011) (BLALOCK_ALZHEIMERS_DISEASE_DN), human gene expression signature of late Braak stages computed using human hippocampal data from Mount Sinai Brain Bank (MSBB_Human_Hippocampus_B3_B1), and NFAT/Calcineurin/AD pathways obtained from MSigDB (Liberzon et al., 2015). The NFAT computationally derived targets based on the promoter binding sequence TGGAAA (Xie et al., 2005) (TGGAAA_NFAT_Q4_01) was also significant as was the curated NFAT target set PID_NFAT_TFPATHWAY. The KEGG AD pathway impact by caCN is illustrated in Figure 4C.
Figure 4.

GSEA analysis of caCN vs GFP differential expression in Alzheimer and NFAT gene sets. (a) Joy plot of GSEA analysis. Plots the density of log2 fold-changes of genes in each gene set. Colors signify the FDR q-values for each GSEA gene set test. (b) Dot plot of GSEA analysis. Y-axis is gene sets. X-axis is ratio of gene set genes that are differential expressed. Colors signify the adjusted p-values for each GSEA gene set test. Dot size signifies gene set size. (c) Kegg Alzheimer pathway illustration of genes differentially expressed between caCN and GFP control. Colors signify log2 fold-change. (d) Heatmap of GSEA analysis revealed that caCN overexpression largely upregulates NFAT target set PID_NFAT_TFPATHWAY genes. Colors signify log2 gene expression. Genes that are bolded are significantly different between caCN and GFP control (n=6–7 mice per group.
Table 3.
| NAME | SIZE | ES | NES | NOM p-val. | FDR q-val | |
|---|---|---|---|---|---|---|
| Down GeneSets | BLALOCK_ALZHEIMER_DISEASE_DN | 1118 | −0.611 | −1.430 | 0.000 | 0.219 |
| KEGG_ALZHEIMER_DISEASE | 145 | −0.485 | −1.421 | 0.037 | 0.166 | |
| BIOCARTA_P35ALZHEIMERS_PATHWAY | 10 | −0.645 | −1.381 | 0.048 | 0.238 | |
| GTEX_HIPPOCAMPUS_EXPRESSED_GEBES_FPKM10 | 2956 | −0.511 | −1.379 | 0.066 | 0.192 | |
| BLALOCK_ALZHEIMER_DISEASE_INCIPIENT_DN | 148 | −0.551 | −1.377 | 0.006 | 0.164 | |
| GO_REGUATION_OF_NFAT_PROTEIN_IMPORT_INTO_NUCLEUS | 13 | −0.599 | −1.367 | 0.069 | 0.153 | |
| BIOCARTA_NFAT_PATHWAY | 47 | −0.386 | −1.359 | 0.052 | 0.142 | |
| BIOCARTA_CALCINEURIN_PATHWAY | 16 | −0.538 | −1.357 | 0.103 | 0.130 | |
| MSBB_HUMAN_HIPPOCAMPUS_B3_B1 | 454 | −0.440 | −1.352 | 0.018 | 0.123 | |
| TGGAAA_NFAT_Q4_01 | 1780 | −0.362 | −1.350 | 0.002 | 0.114 | |
| GO_POSITIVE_REGULATION_OF_NFAT_PROTEIN_IMPORT_INTO_NUCLEUS | 7 | −0.638 | −1.278 | 0.147 | 0.207 | |
| Up GeneSets | RAY_ALZHEIMERS_DISEASE | 9 | 0.595 | 1.303 | 0.151 | 0.194 |
| PID_NFAT_TFPATHWAY | 43 | 0.193 | 0.730 | 0.901 | 0.816 |
Next, we more closely examined the overlap of the curated NFAT target set PID_NFAT_TFPATHWAY, with genes differentially expressed in neurons with caCN overexpression (Figure 4D); this pathway was largely upregulated by caCN. However, the computationally derived TGGAAA_NFAT_Q4_01 pathway was largely downregulated in caCN-treated animals; in fact, most of the differentially expressed genes in caCN compared to GFP control were downregulated (see Supplemental Table 1, S1). We hypothesized that CN activation could suppress transcription via NFAT (Nguyen et al., 2009) or activation of suppressive elements such as microRNAs. We then performed GSEA on the MSigDB C3 collection of motif gene sets, including microRNA and transcription factor target sets (Supplemental Table 3, S3). 661 out of 836 gene sets were significantly (FDR q-value<0.25) downregulated in caCN treated animals compared to GFP-treated animals and a large proportion of these are microRNA target sets (190 gene sets).
Discussion
Previous in vivo expression of a version of caCN in mouse forebrain neurons demonstrated profound induction of long term potentiation and memory deficits that is independent of gene transcription (Winder et al., 1998; Mansuy et al., 1998), although work from our group has demonstrated an important role of NFAT-mediated transcriptional effects on calcineurin-induced synaptotoxicty in vitro (Hudry et al., 2012); the study herein bridges this gap understanding by examining the transcriptional effects of CN in vivo. Indeed, an advantage of the methodology utilized here, in comparison with previously reported microarray analyses of CN activation, is the use of chronic in vivo viral transduction of CN activation as opposed to in vitro analysis of activation. Use of an in vivo system including microglia and astrocytes, which monitor the status of nearby neurons (Nimmerjahn et al., 2005; Dallérac et al., 2013) likely mediates many of the observed effects of CN expression in the study herein, although we have focused on the transcriptional activity in CA3 neurons alone. Only mRNA captured within neuronal cell bodies was analyzed due to the technical limitations of isolating neurons inclusive of their processes by laser microdissection; this caveat is important to recognize due to the presence of mRNA in both proximal and apical dendrites (Bramham and Wells, 2007), although we anticipate that by looking at the chronic timepoint of 4 weeks that an accurate snapshot of CN-induced transcriptional activity may be captured.
The present study tested the hypothesis that increased CN activity via the transcription factor NFAT in neurons plays a causative role in AD pathology by examining the prediction that pathways associated with AD phenotypes, such as synaptotoxicity, would be altered when CN is activated. Statistical analysis of the microarray data overall support this hypothesis. The gene set enrichment data demonstrate a strong overlap between genes differentially regulated by caCN expression and gene pathways associated with synapses and AD as well as genes containing a computationally derived NFAT responsive sequence. For example, synapse related genes are dramatically and broadly down regulated in both AD and caCN overexpression, which is consistent with the synaptic dysfunction and loss observed in AD. Interestingly, many synapse related genes have been reported to be part of a class of calcium regulated synapse associated transcripts that have been observed to change in both normal aging, and, to a greater extent, in AD (Saetre et al., 2011).
Nearly all of the differentially expressed genes in the microarray were similarly affected by transduction with wtCN or caCN; only Crh emerged as differentially expressed between the two forms of wtCN and caCN. The two control groups (PBS and GFP) were found to be well separated from the two CN treatment groups by PCA. It is of note that while the PCA plot revealed a distinct separation of the CN groups from the control groups, the CN groups themselves show essentially complete overlap. Indeed, we noted only 1 gene in the array that was differentially regulated between wtCN and caCN. This may be reflective of the sensitivity of the CN pathway to perturbation, in that overexpression of CN, regardless of its form, is sufficient to shift the balance of the basal functions of CN (Lam et al., 2009; Mukherjee and Soto, 2011). We also found that the Crh gene was slightly upregulated in human AD cases compared to controls. However, previous reports have shown that Crh gene expression is significantly downregulated in AD (Blalock et al., 2003; Zhang et al., 2013) and is one of the top 20 most highly differentially expressed genes in AD brains compared to control brains (Zhang et al., 2013). Studies in several model systems of AD have suggested that Crh plays a role in AD pathology and synaptotoxicity (Dong et al., 2012, 2014; Filipcik et al., 2012; Pedersen et al., 2001). These data add to a conflicting set of data associating Crh with synaptotoxicity and AD and highlights a need for studies directly examining the interplay between Crh and AD.
In contrast to the dramatic upregulation of Crh, the analysis revealed that most of the transcripts differentially expressed between caCN and GFP controls were downregulated (1380 vs. 151); all of the top ten differentially expressed genes were downregulated. Six of these top ten genes overlap with the BLALOCK_ALZHEIMERS_DISEASE_DN gene set as well as the GO_NEURON_PART gene set. Scamp1, one of the most significantly downregulated gene in the caCN group, has been identified by GWAS as having the potential of involvement with AD in a small cohort (Shulman et al., 2011) and its deletion is associated with neural defects in Drosophila similar to AD model phenotypes (Zheng et al., 2014). Examination of the literature reveals that the many of the top gene hits are critical for neuronal synaptic function and are altered in AD and other dementias. Nceh1 protects against α-synuclein toxicity (Zhang et al., 2017) and is decreased in blood samples drawn from AD patients (Mandas et al., 2012); its normal function involved homeostatic cholesterol regulation which is disrupted in AD (Sato and Morishita, 2015). Similarly, Tspan3 plays a role in membrane and cholesterol regulation as well as amyloid precursor protein (APP) processing and presenilin function (Seipold and Saftig, 2016). Rasgrf1 is necessary for dendritic spine formation (Detrait et al., 2014), and is downregulated in AD and prion diseases (Tian et al., 2014). Sv2b is a synaptic vesicle protein that is downregulated in the temporal pole of AD patients (Tan et al., 2010). Psk1 regulates membrane morphology and microtubule binding during apoptosis, phosphorylates tau, and is present in tau tangles (Zihni et al., 2006; Tavares et al., 2013). Atpgap2 is important in the AD-disrupted autophagy and lysosome functions (Colacurcio et al., 2017) and is downregulated by caCN as well as in the Tg2576 AD mouse model (George et al., 2010). These data support the hypothesis that CN triggers transcriptional changes associated with AD pathology which we further examined below by GSEA.
Many of the other top genes differentially expressed by caCN are associated with AD (Wei et al., 2014; Ma et al., 2013; Tavares et al., 2013). On a systems level, Figure 4C demonstrates broad parallels between caCN-mediated transcriptional changes and those associated with late-stage AD. In particular, mitochondrial functional transcripts are disrupted in both, as are N-methyl D-aspartate receptor (NMDAR) and p25/p35. Interestingly, Ano3, one of the top downregulated genes by caCN, is vital to maintenance of the mitochondrial membrane potential and could be linked to the observed mitochondrial gene expression differences.
Of note, one interpretation of the down-regulation of neuronal genes in AD is simply a loss of neurons, with concomitant change in cell landscape form bulk samples. In the current analysis, however, laser capture microdissection was used to capture intact neuronal cell bodies, which nonetheless showed this same pattern of down regulation of most CN responsive genes. This suggests that the down regulation in AD is a consequence of gene transcription, likely related to CN activation and NFAT related transcriptional repression rather than primarily due to neuronal loss. NFAT can act as a powerful transcriptional repressor in neurons (Nguyen et al., 2009) and we have demonstrated here that many genes (with computationally derived NFAT binding sites) are downregulated (Figure 4D). It is relevant to note that some of those computationally generated genes with NFAT binding motifs may be false positives, not expressed in neurons, or require additional factors for activation. This downregulation of CN-responsive transcripts in neurons is in contrast to work examining CN-responsive transcripts in cultured astrocytes, where the majority of transcripts observed were upregulated (Norris et al., 2005). These contrasting results suggest that CN may have dramatically different effects in different cell types, perhaps due to expression of different downstream effectors, including different isoforms of NFAT.
In caCN neurons there was downregulation of several miRNA-regulated gene sets by GSEA (Supplemental Table 3, S3) which is in concordance with data from other groups demonstrating that several microRNAs are regulated by NFAT (Kannambath, 2016; Kang et al., 2013). Numerous miRNAs are associated with both induction of neurodegeneration and loss of neuroprotection in AD, via decreases in mir124 which normally suppresses β-secretase 1 (BACE1) and increases in mir34 which downregulates various synaptic genes, respectively (Reddy et al., 2017; Goodall et al., 2013). Both of these microRNA pathways were identified in GSEA analysis of MSigDB C3 motif gene sets, as well as several others that are altered in AD. Futhermore, the mir124 pathway, which was identified in the GSEA analysis of caCN, is capable of feeding back on NFAT and suppressing transcription via inhibition of elements of the transcriptional pathway. Spag9 and Tnpo1, both of which are regulated by mir124a and involve the NFAT pathway (Willingham et al., 2005), were downregulated in caCN-treated neurons. Tnpo1 encodes the protein importin β 1, which is necessary for NFAT translocation to the nucleus (Ishiguro et al., 2011) as well as translocation of several other transcription factors important to neuronal function including AP-1 and cAMP–response element binding protein (CREB) (Forwood et al., 2001). Indeed, targets of the CREB pathway are downregulated in caCN neurons (Supplemental Table 3, S3) and CREB signaling deficits are observed in AD (Saura and Valero, 2011). Further, CN directly blocks pro-synaptic CREB via desphosphorylation and inactivation (Bito et al., 1996).
We have interpreted these transcriptional changes as directly consequent to neuronal CN expression, but it is important to note that microglia and astrocytes monitor the status of nearby neurons (Nimmerjahn et al., 2005; Dallérac et al., 2013) and crosstalk between these cell types likely mediates some of the observed effects of CN expression. In accord with this caveat, it is clear that expression of CN in glia promotes numerous phenotypic changes that can impact neurons (Sompol et al., 2017; Furman et al.) and the transcriptional response to CN in astrocytes includes upregulation of transcripts (Norris et al., 2005) in opposition to the downregulation observed here, indicating important cell-type specific differences in the CN pathway. Moreover, we postulate that neuroinflammatory signals may play a major role in neuronal and glial CN activation, potentially linking neuroinflammation to a specific molecular mechanism that affects the neurodegenerative phenotype.
Conclusions
Overall, the current study indicates that chronic CN overexpression in neurons is sufficient to trigger a broad transcriptional program change, likely involving transcription factors NFAT, CREB, and micro-RNAs, leading to marked expression changes in genes associated with synapses and energy metabolism. The CN responsive gene set is overwhelmingly biased to down regulation, suggesting the possibility that CN-mediated transcriptional events like NFAT translocation acts largely as a transcriptional repressor in neurons. There is striking overlap between changes observed after chronic CN activation and those observed in AD, suggesting that dysregulation of CN homeostasis may be a major contributor to the marked transcriptional changes in synaptic genes and others observed in AD. Together with the previous observations that CN inhibition can improve synaptic morphology in mouse models of AD, these results are consistent with the possibility that CN inhibition may restore impact synaptic alterations in AD as well.
Supplementary Material
Acknowledgments
This work was supported by NIH/NIA 1K99AG047336-01A1 (EH); NIH grant AGR01AG041507 and a grant from Bristol Myers Squibb, and the Massachusetts Center for Alzheimer’s Therapeutic Studies (MassCATS), a cooperative agreement with the Commonwealth of Massachusetts supporting precompetive Alzheimer related research.
Abbreviations
- AAV
adeno-associated virus
- Ab
amyloid b
- AD
Alzheimer disease
- AMP-AD
Accelerating Medicines Partnership Alzheimer disease
- APP
Amyloid precursor protein
- BACE1
β-secretase 1
- BLAST
Basic Local Alignment Search Tool
- caCN
constitutively activated calcineurin
- CN
calcineurin
- CREB
cAMP response element binding protein
- GFP
green fluorescent protein
- GSEA
gene set enrichment analysis
- miRNAs
Micro-RNAs
- MSBB
Mount Sinai Brain Bank
- NFAT
nuclear factor of activated T cells
- NMDAR
N-methyl D-aspartate receptor
- PBS
phosphate buffered saline
- PCA
principal component Analysis
- RMA
Robust Multichip Average
- SVA
surrogate variable analysis
- WT
wild-type
- wtCN
wild-type calcineurin.
Footnotes
The authors have no additional financial interests.
Open Science Badges
This article has received a badge for *Open Materials* because it provided all relevant information to reproduce the study in the manuscript. The complete Open Science Disclosure form for this article can be found at the end of the article. More information about the Open Practices badges can be found at https://cos.io/our-services/open-science-badges/.
References
- Abdul HM, Sama MA, Furman JL, Mathis DM, Beckett TL, Weidner AM, Patel ES, Baig I, Murphy MP, LeVine H, Kraner SD, Norris CM. Cognitive Decline in Alzheimer’s Disease Is Associated with Selective Changes in Calcineurin/NFAT Signaling. J Neurosci. 2009;29:12957–12969. doi: 10.1523/JNEUROSCI.1064-09.2009. [DOI] [PMC free article] [PubMed] [Google Scholar]
- Altschul SF, Gish W, Miller W, Myers EW, Lipman DJ. Basic local alignment search tool. J Mol. Biol. 1990;215:403–410. doi: 10.1016/S0022-2836(05)80360-2. [DOI] [PubMed] [Google Scholar]
- Arbel-Ornath M, Hudry E, Boivin JR, Hashimoto T, Takeda S, Kuchibhotla KV, Hou S, Lattarulo CR, Belcher AM, Shakerdge N, Trujillo PB, Muzikansky A, Betensky RA, Hyman BT, Bacskai BJ. Soluble oligomeric amyloid-β induces calcium dyshomeostasis that precedes synapse loss in the living mouse brain. Mol. Neurodegener. 2017;12:27. doi: 10.1186/s13024-017-0169-9. [DOI] [PMC free article] [PubMed] [Google Scholar]
- Balakrishnan B, Sen D, Hareendran S, Roshini V, David S, Srivastava A, Jayandharan GR. Activation of the cellular unfolded protein response by recombinant adeno-associated virus vectors. PLoS One. 2013;8:e53845. doi: 10.1371/journal.pone.0053845. [DOI] [PMC free article] [PubMed] [Google Scholar]
- Benedito AB, Lehtinen M, Massol R, Lopes UG, Kirchhausen T, Rao A, Bonni A. The transcription factor NFAT3 mediates neuronal survival. J Biol. Chem. 2005;280:2818–25. doi: 10.1074/jbc.M408741200. [DOI] [PubMed] [Google Scholar]
- Berchtold NC, Coleman PD, Cribbs DH, Rogers J, Gillen DL, Cotman CW. Synaptic genes are extensively downregulated across multiple brain regions in normal human aging and Alzheimer’s disease. Neurobiol. Aging. 2013;34:1653–61. doi: 10.1016/j.neurobiolaging.2012.11.024. [DOI] [PMC free article] [PubMed] [Google Scholar]
- Bhattacharyya S, Biou V, Xu W, Schlüter O, Malenka RC. A critical role for PSD-95/AKAP interactions in endocytosis of synaptic AMPA receptors. Nat. Neurosci. 2009;12:172–181. doi: 10.1038/nn.2249. [DOI] [PMC free article] [PubMed] [Google Scholar]
- Bito H, Deisseroth K, Tsien RW. CREB phosphorylation and dephosphorylation: a Ca(2+)- and stimulus duration-dependent switch for hippocampal gene expression. Cell. 1996;87:1203–14. doi: 10.1016/s0092-8674(00)81816-4. [DOI] [PubMed] [Google Scholar]
- Blalock EM, Buechel HM, Popovic J, Geddes JW, Landfield PW. Microarray analyses of laser-captured hippocampus reveal distinct gray and white matter signatures associated with incipient Alzheimer’s disease. J Chem. Neuroanat. 2011;42:118–26. doi: 10.1016/j.jchemneu.2011.06.007. [DOI] [PMC free article] [PubMed] [Google Scholar]
- Blalock EM, Chen K-C, Sharrow K, Herman JP, Porter NM, Foster TC, Landfield PW. Gene Microarrays in Hippocampal Aging: Statistical Profiling Identifies Novel Processes Correlated with Cognitive Impairment. J Neurosci. 2003;23:3807–3819. doi: 10.1523/JNEUROSCI.23-09-03807.2003. [DOI] [PMC free article] [PubMed] [Google Scholar]
- Bolstad BM, Irizarry RA, Astrand M, Speed TP. A comparison of normalization methods for high density oligonucleotide array data based on variance and bias. Bioinformatics. 2003;19:185–93. doi: 10.1093/bioinformatics/19.2.185. [DOI] [PubMed] [Google Scholar]
- Braak H, Braak E. Neuropathological stageing of Alzheimer-related changes. Acta Neuropathol. 1991;82:239–59. doi: 10.1007/BF00308809. [DOI] [PubMed] [Google Scholar]
- Bramham CR, Wells DG. Dendritic mRNA: transport, translation and function. Nat. Rev. Neurosci. 2007;8:776–789. doi: 10.1038/nrn2150. [DOI] [PubMed] [Google Scholar]
- Choudhury SR, Hudry E, Maguire CA, Sena-Esteves M, Breakefield XO, Grandi P. Viral vectors for therapy of neurologic diseases. Neuropharmacology. 2017;120:63–80. doi: 10.1016/j.neuropharm.2016.02.013. [DOI] [PMC free article] [PubMed] [Google Scholar]
- Colacurcio DJ, Pensalfini A, Jiang Y, Nixon RA. Dysfunction of Autophagy and Endosomal-lysosomal Pathways: Roles in Pathogenesis of Down Syndrome and Alzheimer’s Disease. Free Radic. Biol. Med. 2017 doi: 10.1016/j.freeradbiomed.2017.10.001. [DOI] [PMC free article] [PubMed] [Google Scholar]
- Dallérac G, Chever O, Rouach N. How do astrocytes shape synaptic transmission? Insights from electrophysiology. Front. Cell. Neurosci. 2013;7:159. doi: 10.3389/fncel.2013.00159. [DOI] [PMC free article] [PubMed] [Google Scholar]
- Detrait E, Maurice T, Hanon E, Leclercq K, Lamberty Y. Lack of synaptic vesicle protein SV2B protects against amyloid-β25–35-induced oxidative stress, cholinergic deficit and cognitive impairment in mice. Behav. Brain Res. 2014;271:277–285. doi: 10.1016/j.bbr.2014.06.013. [DOI] [PubMed] [Google Scholar]
- Dong H, Murphy KM, Meng L, Montalvo-Ortiz J, Zeng Z, Kolber BJ, Zhang S, Muglia LJ, Csernansky JG. Corticotrophin releasing factor accelerates neuropathology and cognitive decline in a mouse model of Alzheimer’s disease. J Alzheimers. Dis. 2012;28:579–92. doi: 10.3233/JAD-2011-111328. [DOI] [PMC free article] [PubMed] [Google Scholar]
- Dong H, Wang S, Zeng Z, Li F, Montalvo-Ortiz J, Tucker C, Akhtar S, Shi J, Meltzer HY, Rice KC, Csernansky JG. Effects of corticotrophin-releasing factor receptor 1 antagonists on amyloid-β and behavior in Tg2576 mice. Psychopharmacology (Berl) 2014;231:4711–22. doi: 10.1007/s00213-014-3629-8. [DOI] [PMC free article] [PubMed] [Google Scholar]
- Filipcik P, Novak P, Mravec B, Ondicova K, Krajciova G, Novak M, Kvetnansky R. Tau protein phosphorylation in diverse brain areas of normal and CRH deficient mice: up-regulation by stress. Cell. Mol. Neurobiol. 2012;32:837–45. doi: 10.1007/s10571-011-9788-9. [DOI] [PMC free article] [PubMed] [Google Scholar]
- Forwood JK, Lam MH, Jans DA. Nuclear import of Creb and AP-1 transcription factors requires importin-beta 1 and Ran but is independent of importin-alpha. Biochemistry. 2001;40:5208–17. doi: 10.1021/bi002732+. [DOI] [PubMed] [Google Scholar]
- Furman JL, Sompol P, Kraner SD, Pleiss MM, Putman EJ, Dunkerson XJ, Abdul HM, Roberts KN, Scheff SW, Norris CM. Blockade of Astrocytic Calcineurin/NFAT Signaling Helps to Normalize Hippocampal Synaptic Function and Plasticity in a Rat Model of Traumatic Brain Injury. doi: 10.1523/JNEUROSCI.1930-15.2016. [DOI] [PMC free article] [PubMed] [Google Scholar]
- George AJ, Gordon L, Beissbarth T, Koukoulas I, Holsinger RMD, Perreau V, Cappai R, Tan S-S, Masters CL, Scott HS, Li Q-X. A Serial Analysis of Gene Expression Profile of the Alzheimer’s Disease Tg2576 Mouse Model. Neurotox. Res. 2010;17:360–379. doi: 10.1007/s12640-009-9112-3. [DOI] [PubMed] [Google Scholar]
- Goodall EF, Heath PR, Bandmann O, Kirby J, Shaw PJ. Neuronal dark matter: the emerging role of microRNAs in neurodegeneration. Front. Cell. Neurosci. 2013;7:178. doi: 10.3389/fncel.2013.00178. [DOI] [PMC free article] [PubMed] [Google Scholar]
- Hernández F, Gómez de Barreda E, Fuster-Matanzo A, Lucas JJ, Avila J. GSK3: A possible link between beta amyloid peptide and tau protein. Exp. Neurol. 2010;223:322–325. doi: 10.1016/j.expneurol.2009.09.011. [DOI] [PubMed] [Google Scholar]
- Huang DW, Sherman BT, Lempicki RA. Bioinformatics enrichment tools: paths toward the comprehensive functional analysis of large gene lists. Nucleic Acids Res. 2009;37:1–13. doi: 10.1093/nar/gkn923. [DOI] [PMC free article] [PubMed] [Google Scholar]
- Hudry E, Wu H-Y, Arbel-Ornath M, Hashimoto T, Matsouaka R, Fan Z, Spires-Jones TL, Betensky RA, Bacskai BJ, Hyman BT. Inhibition of the NFAT pathway alleviates amyloid β neurotoxicity in a mouse model of Alzheimer’s disease. J Neurosci. 2012;32:3176–92. doi: 10.1523/JNEUROSCI.6439-11.2012. [DOI] [PMC free article] [PubMed] [Google Scholar]
- Irizarry RA, Hobbs B, Collin F, Beazer-Barclay YD, Antonellis KJ, Scherf U, Speed TP. Exploration, normalization, and summaries of high density oligonucleotide array probe level data. Biostatistics. 2003;4:249–264. doi: 10.1093/biostatistics/4.2.249. [DOI] [PubMed] [Google Scholar]
- Ishiguro K, Ando T, Maeda O, Watanabe O, Goto H. Cutting Edge: Tubulin Functions as an Adaptor in NFAT-Importin Interaction. J Immunol. 2011;186:2710–2713. doi: 10.4049/jimmunol.1003322. [DOI] [PubMed] [Google Scholar]
- Jurado S, Biou V, Malenka RC. A calcineurin/AKAP complex is required for NMDA receptor–dependent long-term depression. Nat. Neurosci. 2010;13:1053–1055. doi: 10.1038/nn.2613. [DOI] [PMC free article] [PubMed] [Google Scholar]
- Kamat PK, Kalani A, Rai S, Swarnkar S, Tota S, Nath C, Tyagi N. Mechanism of Oxidative Stress and Synapse Dysfunction in the Pathogenesis of Alzheimer’s Disease: Understanding the Therapeutics Strategies. Mol. Neurobiol. 2016;53:648–661. doi: 10.1007/s12035-014-9053-6. [DOI] [PMC free article] [PubMed] [Google Scholar]
- Kang K, Peng X, Zhang X, Wang Y, Zhang L, Gao L, Weng T, Zhang H, Ramchandran R, Raj JU, Gou D, Liu L. MicroRNA-124 Suppresses the Transactivation of Nuclear Factor of Activated T Cells by Targeting Multiple Genes and Inhibits the Proliferation of Pulmonary Artery Smooth Muscle Cells. J Biol. Chem. 2013;288:25414–25427. doi: 10.1074/jbc.M113.460287. [DOI] [PMC free article] [PubMed] [Google Scholar]
- Kannambath S. Micro-RNA Feedback Loops Modulating the Calcineurin/NFAT Signaling Pathway. Non-Coding RNA. 2016;2:3. doi: 10.3390/ncrna2020003. [DOI] [PMC free article] [PubMed] [Google Scholar]
- Kuchibhotla KV, Goldman ST, Lattarulo CR, Wu H-Y, Hyman BT, Bacskai BJ. Aβ Plaques Lead to Aberrant Regulation of Calcium Homeostasis In Vivo Resulting in Structural and Functional Disruption of Neuronal Networks. Neuron. 2008;59:214–225. doi: 10.1016/j.neuron.2008.06.008. [DOI] [PMC free article] [PubMed] [Google Scholar]
- Lam BYH, Zhang W, Enticknap N, Haggis E, Cader MZ, Chawla S. Inverse Regulation of Plasticity-related Immediate Early Genes by Calcineurin in Hippocampal Neurons. J Biol. Chem. 2009;284:12562–12571. doi: 10.1074/jbc.M901121200. [DOI] [PMC free article] [PubMed] [Google Scholar]
- Leek JT, Storey JD. Capturing heterogeneity in gene expression studies by surrogate variable analysis. PLoS Genet. 2007;3:1724–35. doi: 10.1371/journal.pgen.0030161. [DOI] [PMC free article] [PubMed] [Google Scholar]
- Liberzon A, Birger C, Thorvaldsdóttir H, Ghandi M, Mesirov JP, Tamayo P. The Molecular Signatures Database (MSigDB) hallmark gene set collection. Cell Syst. 2015;1:417–425. doi: 10.1016/j.cels.2015.12.004. [DOI] [PMC free article] [PubMed] [Google Scholar]
- Liu F, Grundke-Iqbal I, Iqbal K, Oda Y, Tomizawa K, Gong C-X. Truncation and Activation of Calcineurin A by Calpain I in Alzheimer Disease Brain. J Biol. Chem. 2005;280:37755–37762. doi: 10.1074/jbc.M507475200. [DOI] [PubMed] [Google Scholar]
- Lowenstein PR, Castro MG. Inflammation and adaptive immune responses to adenoviral vectors injected into the brain: peculiarities, mechanisms, and consequences. Gene Ther. 2003;10:946–954. doi: 10.1038/sj.gt.3302048. [DOI] [PubMed] [Google Scholar]
- Ma Y, Bao J, Zhao X, Shen H, Lv J, Ma S, Zhang X, Li Z, Wang S, Wang Q, Ji J. Activated Cyclin-Dependent Kinase 5 Promotes Microglial Phagocytosis of Fibrillar β-Amyloid by Up-regulating Lipoprotein Lipase Expression. Mol. Cell. Proteomics. 2013;12:2833–2844. doi: 10.1074/mcp.M112.026864. [DOI] [PMC free article] [PubMed] [Google Scholar]
- Mandas A, Abete C, Putzu P, la Colla P, Dessì S, Pani A. Changes in cholesterol metabolism-related gene expression in peripheral blood mononuclear cells from Alzheimer patients. Lipids Health Dis. 2012;11:39. doi: 10.1186/1476-511X-11-39. [DOI] [PMC free article] [PubMed] [Google Scholar]
- Mansuy IM, Mayford M, Jacob B, Kandel ER, Bach ME. Restricted and regulated overexpression reveals calcineurin as a key component in the transition from short-term to long-term memory. Cell. 1998;92:39–49. doi: 10.1016/s0092-8674(00)80897-1. [DOI] [PubMed] [Google Scholar]
- Mattson MP, Chan SL. Neuronal and glial calcium signaling in Alzheimer’s disease. Cell Calcium. 2003;34:385–97. doi: 10.1016/s0143-4160(03)00128-3. [DOI] [PubMed] [Google Scholar]
- McCaffrey AP, Fawcett P, Nakai H, McCaffrey RL, Ehrhardt A, Pham T-TT, Pandey K, Xu H, Feuss S, Storm TA, Kay MA. The Host Response to Adenovirus, Helper-dependent Adenovirus, and Adeno-associated Virus in Mouse Liver. Mol. Ther. 2008;16:931–941. doi: 10.1038/mt.2008.37. [DOI] [PubMed] [Google Scholar]
- Mohmmad Abdul H, Baig I, Levine H, Guttmann RP, Norris CM. 2011a. Proteolysis of calcineurin is increased in human hippocampus during mild cognitive impairment and is stimulated by oligomeric Abeta in primary cell culture. Aging Cell. 10:103–13. doi: 10.1111/j.1474-9726.2010.00645.x. [DOI] [PMC free article] [PubMed] [Google Scholar]
- Mohmmad Abdul H, Baig I, Levine H, Guttmann RP, Norris CM. 2011b. Proteolysis of calcineurin is increased in human hippocampus during mild cognitive impairment and is stimulated by oligomeric Abeta in primary cell culture. Aging Cell. 10:103–13. doi: 10.1111/j.1474-9726.2010.00645.x. [DOI] [PMC free article] [PubMed] [Google Scholar]
- Mukherjee A, Soto C. Role of calcineurin in neurodegeneration produced by misfolded proteins and endoplasmic reticulum stress. Curr. Opin. Cell Biol. 2011;23:223–230. doi: 10.1016/j.ceb.2010.12.006. [DOI] [PMC free article] [PubMed] [Google Scholar]
- Nguyen T, Di Giovanni S. NFAT signaling in neural development and axon growth. Int. J. Dev. Neurosci. 2008;26:141–145. doi: 10.1016/j.ijdevneu.2007.10.004. [DOI] [PMC free article] [PubMed] [Google Scholar]
- Nguyen T, Lindner R, Tedeschi A, Forsberg K, Green A, Wuttke A, Gaub P, Di Giovanni S. NFAT-3 Is a Transcriptional Repressor of the Growth-associated Protein 43 during Neuronal Maturation. J Biol. Chem. 2009;284:18816–18823. doi: 10.1074/jbc.M109.015719. [DOI] [PMC free article] [PubMed] [Google Scholar]
- Nimmerjahn A, Kirchhoff F, Helmchen F. Resting microglial cells are highly dynamic surveillants of brain parenchyma in vivo. Science. 2005;308:1314–8. doi: 10.1126/science.1110647. [DOI] [PubMed] [Google Scholar]
- Norris CM, Kadish I, Blalock EM, Chen K-C, Thibault V, Porter NM, Landfield PW, Kraner SD. Calcineurin triggers reactive/inflammatory processes in astrocytes and is upregulated in aging and Alzheimer’s models. J Neurosci. 2005;25:4649–58. doi: 10.1523/JNEUROSCI.0365-05.2005. [DOI] [PMC free article] [PubMed] [Google Scholar]
- Pedersen WA, McCullers D, Culmsee C, Haughey NJ, Herman JP, Mattson MP. Corticotropin-releasing hormone protects neurons against insults relevant to the pathogenesis of Alzheimer’s disease. Neurobiol. Dis. 2001;8:492–503. doi: 10.1006/nbdi.2001.0395. [DOI] [PubMed] [Google Scholar]
- Popugaeva E, Pchitskaya E, Bezprozvanny I. Dysregulation of neuronal calcium homeostasis in Alzheimer’s disease - A therapeutic opportunity? Biochem. Biophys. Res. Commun. 2017;483:998–1004. doi: 10.1016/j.bbrc.2016.09.053. [DOI] [PMC free article] [PubMed] [Google Scholar]
- Reddy PH, Tonk S, Kumar S, Vijayan M, Kandimalla R, Kuruva CS, Reddy AP. A critical evaluation of neuroprotective and neurodegenerative MicroRNAs in Alzheimer’s disease. Biochem. Biophys. Res. Commun. 2017;483:1156–1165. doi: 10.1016/j.bbrc.2016.08.067. [DOI] [PMC free article] [PubMed] [Google Scholar]
- Ritchie ME, Phipson B, Wu D, Hu Y, Law CW, Shi W, Smyth GK. limma powers differential expression analyses for RNA-sequencing and microarray studies. Nucleic Acids Res. 2015;43:e47. doi: 10.1093/nar/gkv007. [DOI] [PMC free article] [PubMed] [Google Scholar]
- Saetre P, Jazin E, Emilsson L. Age-related changes in gene expression are accelerated in Alzheimer’s disease. Synapse. 2011;65:971–974. doi: 10.1002/syn.20933. [DOI] [PubMed] [Google Scholar]
- Sato N, Morishita R. The roles of lipid and glucose metabolism in modulation of β-amyloid, tau, and neurodegeneration in the pathogenesis of Alzheimer disease. Front. Aging Neurosci. 2015;7:199. doi: 10.3389/fnagi.2015.00199. [DOI] [PMC free article] [PubMed] [Google Scholar]
- Saura CA, Valero J. The role of CREB signaling in Alzheimer’s disease and other cognitive disorders. Rev. Neurosci. 2011;22:153–69. doi: 10.1515/RNS.2011.018. [DOI] [PubMed] [Google Scholar]
- Schwartz N, Schohl A, Ruthazer ES. Neural Activity Regulates Synaptic Properties and Dendritic Structure In Vivo through Calcineurin/NFAT Signaling. Neuron. 2009;62:655–669. doi: 10.1016/j.neuron.2009.05.007. [DOI] [PubMed] [Google Scholar]
- Seipold L, Saftig P. The Emerging Role of Tetraspanins in the Proteolytic Processing of the Amyloid Precursor Protein. Front. Mol. Neurosci. 2016;9:149. doi: 10.3389/fnmol.2016.00149. [DOI] [PMC free article] [PubMed] [Google Scholar]
- Sepúlveda FJ, Fierro H, Fernandez E, Castillo C, Peoples RW, Opazo C, Aguayo LG. Nature of the neurotoxic membrane actions of amyloid-β on hippocampal neurons in Alzheimer’s disease. Neurobiol. Aging. 2014;35:472–81. doi: 10.1016/j.neurobiolaging.2013.08.035. [DOI] [PubMed] [Google Scholar]
- Serrano-Pérez MC, Fernández M, Neria F, Berjón-Otero M, Doncel-Pérez E, Cano E, Tranque P. NFAT transcription factors regulate survival, proliferation, migration, and differentiation of neural precursor cells. Glia. 2015;63:987–1004. doi: 10.1002/glia.22797. [DOI] [PubMed] [Google Scholar]
- Shankar GM, Bloodgood BL, Townsend M, Walsh DM, Selkoe DJ, Sabatini BL. Natural Oligomers of the Alzheimer Amyloid- Protein Induce Reversible Synapse Loss by Modulating an NMDA-Type Glutamate Receptor-Dependent Signaling Pathway. J Neurosci. 2007;27:2866–2875. doi: 10.1523/JNEUROSCI.4970-06.2007. [DOI] [PMC free article] [PubMed] [Google Scholar]
- Shulman JM, Chipendo P, Chibnik LB, Aubin C, Tran D, Keenan BT, Kramer PL, Schneider JA, Bennett DA, Feany MB, De Jager PL. Functional screening of Alzheimer pathology genome-wide association signals in Drosophila. Am. J. Hum. Genet. 2011;88:232–8. doi: 10.1016/j.ajhg.2011.01.006. [DOI] [PMC free article] [PubMed] [Google Scholar]
- Sompol P, Furman JL, Pleiss MM, Kraner SD, Artiushin IA, Batten SR, Quintero JE, Simmerman LA, Beckett TL, Lovell MA, Murphy MP, Gerhardt GA, Norris CM. Calcineurin/NFAT Signaling in Activated Astrocytes Drives Network Hyperexcitability in Aβ-Bearing Mice. J Neurosci. 2017;37:6132–6148. doi: 10.1523/JNEUROSCI.0877-17.2017. [DOI] [PMC free article] [PubMed] [Google Scholar]
- Spires-Jones TL, Kay K, Matsouka R, Rozkalne A, Betensky RA, Hyman BT. Calcineurin inhibition with systemic FK506 treatment increases dendritic branching and dendritic spine density in healthy adult mouse brain. Neurosci. Lett. 2011;487:260–3. doi: 10.1016/j.neulet.2010.10.033. [DOI] [PMC free article] [PubMed] [Google Scholar]
- Subramanian A, Tamayo P, Mootha VK, Mukherjee S, Ebert BL, Gillette MA, Paulovich A, Pomeroy SL, Golub TR, Lander ES, Mesirov JP. Gene set enrichment analysis: a knowledge-based approach for interpreting genome-wide expression profiles. Proc. Natl. Acad. Sci. U. S. A. 2005;102:15545–50. doi: 10.1073/pnas.0506580102. [DOI] [PMC free article] [PubMed] [Google Scholar]
- Supnet C, Bezprozvanny I. The dysregulation of intracellular calcium in Alzheimer disease. Cell Calcium. 2010;47:183–189. doi: 10.1016/j.ceca.2009.12.014. [DOI] [PMC free article] [PubMed] [Google Scholar]
- Tan MG, Chua W-T, Esiri MM, Smith AD, V Vinters H, Lai MK. Genome wide profiling of altered gene expression in the neocortex of Alzheimer’s disease. J Neurosci. Res. 2010;88:1157–69. doi: 10.1002/jnr.22290. [DOI] [PubMed] [Google Scholar]
- Tavares IA, Touma D, Lynham S, Troakes C, Schober M, Causevic M, Garg R, Noble W, Killick R, Bodi I, Hanger DP, Morris JDH. Prostate-derived Sterile 20-like Kinases (PSKs/TAOKs) Phosphorylate Tau Protein and Are Activated in Tangle-bearing Neurons in Alzheimer Disease. J Biol. Chem. 2013;288:15418–15429. doi: 10.1074/jbc.M112.448183. [DOI] [PMC free article] [PubMed] [Google Scholar]
- Taymans J-M, Vandenberghe LH, Van Den Haute C, Thiry I, Deroose CM, Mortelmans L, Wilson JM, Debyser Z, Baekelandt V. Comparative Analysis of Adeno-Associated Viral Vector Serotypes 1, 2, 5, 7, And 8 in Mouse Brain. Hum. Gene Ther. 2007;18:195–206. doi: 10.1089/hum.2006.178. [DOI] [PubMed] [Google Scholar]
- Tian C, Liu D, Xiang W, Kretzschmar HA, Sun Q-L, Gao C, Xu Y, Wang H, Fan X-Y, Meng G, Li W, Dong X-P. Analyses of the similarity and difference of global gene expression profiles in cortex regions of three neurodegenerative diseases: sporadic Creutzfeldt-Jakob disease (sCJD), fatal familial insomnia (FFI), and Alzheimer’s disease (AD) Mol. Neurobiol. 2014;50:473–81. doi: 10.1007/s12035-014-8758-x. [DOI] [PubMed] [Google Scholar]
- Uhlen M, Fagerberg L, Hallstrom BM, Lindskog C, Oksvold P, Mardinoglu A, Sivertsson A, Kampf C, Sjostedt E, Asplund A, Olsson I, Edlund K, Lundberg E, Navani S, Szigyarto CA-K, Odeberg J, Djureinovic D, Takanen JO, Hober S, Alm T, Edqvist P-H, Berling H, Tegel H, Mulder J, Rockberg J, Nilsson P, Schwenk JM, Hamsten M, von Feilitzen K, Forsberg M, Persson L, Johansson F, Zwahlen M, von Heijne G, Nielsen J, Ponten F. Tissue-based map of the human proteome. Science (80-.) 2015;347:1260419–1260419. doi: 10.1126/science.1260419. [DOI] [PubMed] [Google Scholar]
- Watakabe A, Ohtsuka M, Kinoshita M, Takaji M, Isa K, Mizukami H, Ozawa K, Isa T, Yamamori T. Comparative analyses of adeno-associated viral vector serotypes 1, 2, 5, 8 and 9 in marmoset, mouse and macaque cerebral cortex. Neurosci. Res. 2015;93:144–157. doi: 10.1016/j.neures.2014.09.002. [DOI] [PubMed] [Google Scholar]
- Wei Z, Sun M, Liu X, Zhang J, Jin Y. Rufy3, a protein specifically expressed in neurons, interacts with actin-bundling protein Fascin to control the growth of axons. J Neurochem. 2014;130:678–692. doi: 10.1111/jnc.12740. [DOI] [PubMed] [Google Scholar]
- Willingham AT, Orth AP, Batalov S, Peters EC, Wen BG, Aza-Blanc P, Hogenesch JB, Schultz PG. A strategy for probing the function of noncoding RNAs finds a repressor of NFAT. Science. 2005;309:1570–3. doi: 10.1126/science.1115901. [DOI] [PubMed] [Google Scholar]
- Winder DG, Mansuy IM, Osman M, Moallem TM, Kandel ER. Genetic and pharmacological evidence for a novel, intermediate phase of long-term potentiation suppressed by calcineurin. Cell. 1998;92:25–37. doi: 10.1016/s0092-8674(00)80896-x. [DOI] [PubMed] [Google Scholar]
- Woods NK, Padmanabhan J. Neuronal calcium signaling and Alzheimer’s disease. Adv. Exp. Med. Biol. 2012;740:1193–217. doi: 10.1007/978-94-007-2888-2_54. [DOI] [PubMed] [Google Scholar]
- Wu H-Y, Hudry E, Hashimoto T, Kuchibhotla K, Rozkalne A, Fan Z, Spires-Jones T, Xie H, Arbel-Ornath M, Grosskreutz CL, Bacskai BJ, Hyman BT. 2010a. Amyloid beta induces the morphological neurodegenerative triad of spine loss, dendritic simplification, and neuritic dystrophies through calcineurin activation. J Neurosci. 30:2636–49. doi: 10.1523/JNEUROSCI.4456-09.2010. [DOI] [PMC free article] [PubMed] [Google Scholar]
- Wu H-Y, Hudry E, Hashimoto T, Kuchibhotla K, Rozkalne A, Fan Z, Spires-Jones T, Xie H, Arbel-Ornath M, Grosskreutz CL, Bacskai BJ, Hyman BT. 2010b. Amyloid Induces the Morphological Neurodegenerative Triad of Spine Loss, Dendritic Simplification, and Neuritic Dystrophies through Calcineurin Activation. J Neurosci. 30:2636–2649. doi: 10.1523/JNEUROSCI.4456-09.2010. [DOI] [PMC free article] [PubMed] [Google Scholar]
- Xie X, Lu J, Kulbokas EJ, Golub TR, Mootha V, Lindblad-Toh K, Lander ES, Kellis M. Systematic discovery of regulatory motifs in human promoters and 3’ UTRs by comparison of several mammals. Nature. 2005;434:338–45. doi: 10.1038/nature03441. [DOI] [PMC free article] [PubMed] [Google Scholar]
- Yates A, Akanni W, Amode MR, Barrell D, Billis K, Carvalho-Silva D, Cummins C, Clapham P, Fitzgerald S, Gil L, Girón CG, Gordon L, Hourlier T, Hunt SE, Janacek SH, Johnson N, Juettemann T, Keenan S, Lavidas I, Martin FJ, Maurel T, McLaren W, Murphy DN, Nag R, Nuhn M, Parker A, Patricio M, Pignatelli M, Rahtz M, Riat HS, Sheppard D, Taylor K, Thormann A, Vullo A, Wilder SP, Zadissa A, Birney E, Harrow J, Muffato M, Perry E, Ruffier M, Spudich G, Trevanion SJ, Cunningham F, Aken BL, Zerbino DR, Flicek P. Ensembl 2016. Nucleic Acids Res. 2016;44:D710–6. doi: 10.1093/nar/gkv1157. [DOI] [PMC free article] [PubMed] [Google Scholar]
- Yu G, Wang L-G, Yan G-R, He Q-Y. DOSE: an R/Bioconductor package for disease ontology semantic and enrichment analysis. Bioinformatics. 2015;31:608–9. doi: 10.1093/bioinformatics/btu684. [DOI] [PubMed] [Google Scholar]
- Zhang B, Gaiteri C, Bodea L-G, Wang Z, McElwee J, Podtelezhnikov AA, Zhang C, Xie T, Tran L, Dobrin R, Fluder E, Clurman B, Melquist S, Narayanan M, Suver C, Shah H, Mahajan M, Gillis T, Mysore J, MacDonald ME, Lamb JR, Bennett DA, Molony C, Stone DJ, Gudnason V, Myers AJ, Schadt EE, Neumann H, Zhu J, Emilsson V. Integrated systems approach identifies genetic nodes and networks in late-onset Alzheimer’s disease. Cell. 2013;153:707–20. doi: 10.1016/j.cell.2013.03.030. [DOI] [PMC free article] [PubMed] [Google Scholar]
- Zhang S, Glukhova SA, Caldwell KA, Caldwell GA. NCEH-1 modulates cholesterol metabolism and protects against α-synuclein toxicity in a C. elegans model of Parkinson’s disease. Hum. Mol. Genet. 2017;26:3823–3836. doi: 10.1093/hmg/ddx269. [DOI] [PMC free article] [PubMed] [Google Scholar]
- Zheng JC, Tham CT, Keatings K, Fan S, Liou AY-C, Numata Y, Allan D, Numata M. Secretory Carrier Membrane Protein (SCAMP) deficiency influences behavior of adult flies. Front. Cell Dev. Biol. 2014;2:64. doi: 10.3389/fcell.2014.00064. [DOI] [PMC free article] [PubMed] [Google Scholar]
- Zhou Q, Homma KJ, Poo M. Shrinkage of Dendritic Spines Associated with Long-Term Depression of Hippocampal Synapses. Neuron. 2004;44:749–757. doi: 10.1016/j.neuron.2004.11.011. [DOI] [PubMed] [Google Scholar]
- Zhu J, Huang X, Yang Y. The TLR9-MyD88 pathway is critical for adaptive immune responses to adeno-associated virus gene therapy vectors in mice. J Clin. Invest. 2009;119:2388–2398. doi: 10.1172/JCI37607. [DOI] [PMC free article] [PubMed] [Google Scholar]
- Zihni C, Mitsopoulos C, Tavares IA, Ridley AJ, Morris JDH. Prostate-derived Sterile 20-like Kinase 2 (PSK2) Regulates Apoptotic Morphology via C-Jun N-terminal Kinase and Rho Kinase-1. J Biol. Chem. 2006;281:7317–7323. doi: 10.1074/jbc.M513769200. [DOI] [PubMed] [Google Scholar]
Associated Data
This section collects any data citations, data availability statements, or supplementary materials included in this article.