

Abstract
Aims and Objectives
The aim of this study was to compare cephalograms for the hard and soft tissue changes observed in skeletal Class III patients of Indian origin who had undergone either single-jaw mandibular setback (BSSO) or bimaxillary surgery (Le Fort I advancement + BSSO setback) and also to derive a correlation between the changes brought about in the soft tissues by the surgical alteration in hard tissue.
Materials and Methods
The study included records comprising 18 treated skeletal Class III patients, who were divided into two groups based on the surgical procedures advocated: Group I: single-jaw procedure comprised of only mandibular set back, Group II: bimaxillary surgery. Presurgical and post-treatment cephalograms were calibrated and traced using Ilexis FACAD AB-2014 Version 3.8.0.0 software and analyzed with COGS hard tissue analysis and soft tissue analysis. All values for the hard tissue and soft tissue measurements were compared with the norms prescribed for the Indian population.
Results
Upper lip changes were evident in both groups but greater significance was observed in bi-jaw group. Single-jaw patients showed positive correlation for hard to soft tissue mandibular position. Bi-jaw surgical cases exhibited positive correlations between changes Wits variable to soft tissue convexity as well as mandibular position.
Conclusion
The soft tissues changes between Class III patients treated by single-jaw surgery and those treated by bimaxillary surgery when compared revealed that significant differences were observed only in relation to certain measurements such as facial convexity, maxillary prognathism, and upper lip protrusion.
Keywords: Orthognathic surgery, Soft tissue, Class III skeletal malocclusion
Introduction
The concept of “the envelope of discrepancy” given by Proffit and Ackerman showed that the surgical approach brings about the maximum amount of change in all dimensions as compared to other forms of treatment such as camouflage and growth modification.
In recent times, there had been a paradigm shift from hard tissue to the soft tissue envelope and how it is affected by treatment. Visualizing the hard tissues alone, i.e., the teeth and jaws in terms of discrepancy presented a problem which could be tackled in a more or less direct manner to achieve ideal values. But when the soft tissue drape was also thrown into the mix, it compounded the problem. This is due to the variability in soft tissue thickness covering the teeth and bone [1]. As a result, the hard tissue measurements may deviate considerably from the overlying facial form expressed by the patient. This was true in many Class III cases, where a higher degree of dentoalveolar compensation masked the severity of the bony discrepancy. This was then reflected in the soft tissue profile.
While the changes in the hard tissues using various procedures were more predictable, the soft tissue changes showed much greater variability.
Management of any severe Class III malocclusion often required a combination of orthodontic and surgical procedures to improve the facial esthetics and harmonize the facial profile. Two commonly used techniques are (1) single jaw (BSSO setback) and (2) bi-jaw (BSSO setback + Le Fort I advancement osteotomy). The severity of the condition aids the clinician to decide the surgical procedure to be advocated.
A study by Robinson et al. [2] indicated a ratio of 1:1 in relation to lower lip and chin changes. Preoperative lip thickness [3, 4], gender [5], stability of hard tissue correction [6], and even population [7, 8] were some of the other variables taken into account in these studies.
The soft tissue drape varies with ethnicity, and the Indian population often presented increased soft tissue thickness when compared to their Caucasian counterparts. Since the changes brought about by orthognathic surgery in skeletal Class III patients are more profound and easily appreciable, this study aims to assess the changes in hard and soft tissue parameters and correlate these changes in our population.
Materials and Methods
This retrospective study was conducted at the Department of Orthodontics and Dentofacial Orthopedics, Meenakshi Ammal Dental College and Hospital, Chennai.
The study initially included records of 23 treated skeletal Class III patients. A total of 5 case records were discarded:
three records due to improper presurgical records.
one record where genioplasty was performed.
one patient was treated for cleft lip and palate along with orthognathic procedure.
Records of 18 patients which met the inclusion criteria were divided into two groups based on the surgical procedure used for treatment:
Group I: 9 BSSO setback (single-jaw surgery).
Group II: 9 BSSO setback + Le Forte I osteotomy advancement (bimaxillary surgery).
Inclusion Criteria
Patients were selected according to the following inclusion criteria:
Class III molar relation with evident skeletal component.
Presurgical orthodontics carried out by fixed appliance therapy.
All patients were surgically treated by bilateral sagittal split osteotomy (BSSO) or a combination of Le Forte I osteotomy and BSSO.
Lateral cephalograms taken before surgery and 4–12 months after surgery.
Patients of Indian origin.
Exclusion Criteria
Patients who did not complete their orthodontic treatment postsurgery.
Patients who underwent adjunctive surgical procedures such as genioplasty and rhinoplasty.
Patients with cleft lip or palate.
Patients with syndromic conditions.
History of previous orthodontic and prosthodontic treatment.
The lateral cephalograms of patients in the department were standardized with a set of norms to reduce magnification errors.
The presurgical and post-treatment lateral cephalograms of all patients were taken using PLANMECA (PROMAX).
The film distance to the X-ray tube was fixed at 5 feet and was taken in natural head position (NHP) [9].
Films were exposed at 60–72 kV, 1–16 mAS, and a filter of 2.5 mm aluminum equivalent was used.
Presurgical and post-treatment cephalograms were calibrated and traced using Ilexis, (Sweden) FACAD AB-2014 Version 3.8.0.0 software [10]. The cephalometric analyses performed were as follows:
Fig. 1.
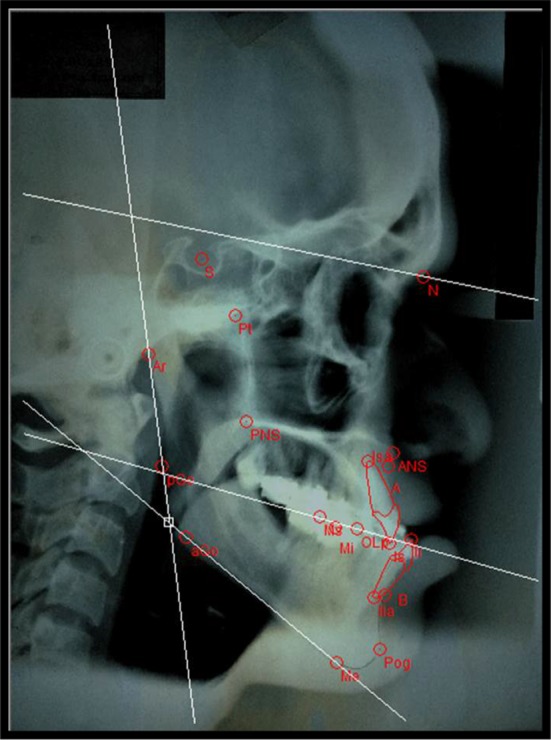
Presurgical COGS hard tissue
Fig. 2.
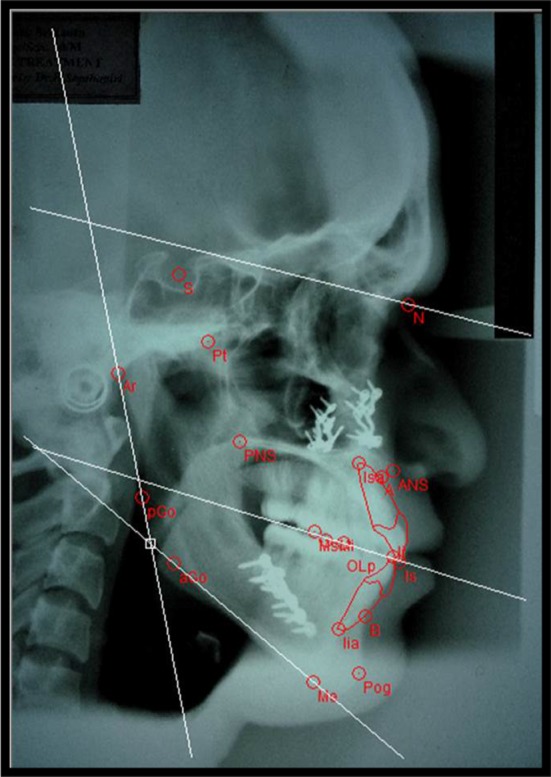
Post-treatment COGS hard tissue
Fig. 3.

Presurgical COGS soft tissue
Fig. 4.

Post-treatment COGS soft tissue
Previous studies carried out by Jokic et al. [4] involved studying the responses of the soft tissue structures to the above-mentioned procedures based on normative values given by Legan and Burstone for the Caucasian population [7]. But the fact that ideal facial balance did vary greatly among different ethnic groups was well established. Hence, it would be inappropriate to apply the norms given by Burstone to the Indian population.
Studies carried out by certain Indian authors [8, 12] have analyzed these variables and have provided the normative values for the Indian population. Using these adjusted values, the current study was able to better define the ideal facial balance for an Indian patient.
Normal values for the hard tissue and soft tissue measurements were taken based on the findings of Yadav et al. [8] for the Indian population.
A total of 11 hard tissue measurements and 13 soft tissue measurements were computed. The same operator traced all cephalometric reference points for the Burstone hard tissue and Legan, Burstone soft tissue analysis. The presurgical and post-treatment phases were represented by T1 and T2, respectively. These cephalograms were retraced after 2 weeks by the same operator to check for errors in tracing.
Statistical Analysis
A power analysis was performed using G Power Version 3.1 on the paired samples t test for one statistically significant change in a hard and soft tissue variable. The result of the power analysis was 0.95. The data obtained were subjected to statistical analysis using IBM software package SPSS Statistics V.15 (SPSS Inc, Chicago, IL, USA) to obtain the necessary information. Differences between the results before and after surgical orthodontic therapy were compared with t tests for paired samples. Comparison of the changes in hard tissue measurements and changes in soft tissue measurements between single-jaw and bimaxillary surgery procedures were determined with the Mann–Whitney test. Correlations between certain hard tissue and soft tissue variables were determined with Kendall’s tau_b correlation coefficient. A p value of < 0.05 level of significance was used for all tests.
Results
A comparison of presurgical (T1) and post-treatment (T2) hard tissue cephalometric values of 18 samples of the single-jaw (9) and bi-jaw (9) groups along with their respective p values is presented in Tables 1 and 2, respectively. For the single-jaw group (Group I), N-A-Pg and Wits appraisal showed a statistically significant increase when compared to T1. N-B, N-Pg and L1-MP showed a statistically significant decrease in T2 when compared to T1. For the bi-jaw group (Group II) (Table 2), N-A-Pg, N-A, L1-MP and Wits appraisal showed statistically significant increases when compared to T1, whereas values such as ANS-Gn, N-B, N-Pg, and Go-Pg showed a statistically significant decrease when compared to T1.
Table 1.
Comparison of presurgical (T1) and post-treatment (T2) hard and soft tissue lateral cephalometric analysis parameters (N = 9, samples: single-jaw surgery)
| Parameters | T1 | T2 | T2–T1 | p value |
|---|---|---|---|---|
| Mean ± SD | Mean ± SD | Mean ± SD | ||
| Group 1: Single-jaw hard tissue | ||||
| NAPg | − 3.95 ± 6.41 | 1.14 ± 4.01 | 5.10 ± 6.01 | 0.034* |
| NB | 6.74 ± 4.19 | 0.83 ± 3.83 | − 5.91 ± 2.12 | 0.000* |
| NPg | 8.62 ± 4.29 | 3.05 ± 3.89 | − 5.56 ± 3.12 | 0.001* |
| L1MP | 90.98 ± 7.72 | 85.57 ± 10.07 | − 5.41 ± 4.75 | 0.009* |
| Wits | − 6.34 ± 2.48 | − 1.27 ± 2.87 | 5.06 ± 3.69 | 0.003* |
| Group 1: Single-jaw soft tissue | ||||
| Facial convexity | 5.77 ± 5.21 | 9.35 ± 3.20 | 3.57 ± 5.05 | 0.066* |
| Ls-Is | 18.34 ± 2.16 | 16.7 ± 2.93 | − 1.55 ± 1.71 | 0.026* |
| Mandibular prog. | 11.57 ± 5.01 | 5.85 ± 2.65 | − 5.72 ± 3.88 | 0.002* |
| Lower lip prot. | 7.43 ± 2.10 | 4.56 ± 1.32 | − 2.86 ± 1.78 | 0.000* |
| Nasolabial angle | 87.52 ± 16.87 | 91.34 ± 12.31 | 3.82 ± 6.91 | 0.136 NS |
*p value < 0.05 denotes statistically significant
NS—p value > 0.05 denotes statistically not significant
Table 2.
Comparison of presurgical (T1) and post-treatment (T2) hard and soft tissue lateral cephalometric analysis parameters (N = 9, samples: bi-jaw surgery)
| Parameters | T1 | T2 | T2–T1 | p value |
|---|---|---|---|---|
| Mean ± SD | Mean ± SD | Mean ± SD | ||
| Group 2: Bi-jaw hard tissue | ||||
| NAPg | − 12.87 ± 5.60 | 3.95 ± 5.92 | 16.83 ± 6.3 | 0.000* |
| NA | − 1.61 ± 4.45 | 3.32 ± 4.58 | 4.933 ± 1.90 | 0.000* |
| ANSGn | 64.288 ± 10.97 | 61.38 ± 9.33 | − 2.90 ± 3.46 | 0.036* |
| NB | 6.75 ± 3.79 | 0.61 ± 6.73 | − 6.14 ± 4.77 | 0.005* |
| NPg | 8.61 ± 5.16 | 2.96 ± 7.73 | − 5.64 ± 4.51 | 0.006* |
| Go-Pg | 76.61 ± 4.88 | 70.06 ± 5.56 | − 6.54 ± 6.88 | 0.021* |
| L1MP | 85.70 ± 13.17 | 90.14 ± 10.40 | 4.44 ± 5.26 | 0.035* |
| Wits | − 13.28 ± 3.96 | − 3.85 ± 3.18 | 9.43 ± 3.66 | 0.000* |
| Group 2: Bi-jaw soft tissue | ||||
| Facial convexity | − 0.25 ± 6.16 | 10.08 ± 7.06 | 10.34 ± 4.67 | 0.000* |
| Maxillary prog. | 5.32 ± 4.38 | 7.53 ± 4.02 | 2.21 ± 1.38 | 0.001* |
| Upper lip prot. | 1.07 ± 3.06 | 4.57 ± 2.01 | 3.50 ± 1.86 | 0.000* |
| Mandibular prog. | 10.45 ± 5.55 | 5.38 ± 6.06 | − 5.06 ± 1.88 | 0.000* |
| Lower lip prot. | 7.36 ± 3.63 | 4.07 ± 2.33 | − 3.28 ± 3.16 | 0.014* |
*p value < 0.05 denotes statistically significant
NS—p value > 0.05 denotes statistically not significant
Soft tissue presurgical (T1) and post-treatment (T2) cephalometric values of the 18 samples of Group I (9) and Group II (9) along with their respective p values are presented in Tables 1 and 2, respectively. For Group I, maxillary soft tissue values such as upper lip thickness(Ls-Is) and also facial convexity (G-Sn-Pg′) showed a statistically significant increase in post-treatment values while mandibular values such as mandibular prognathism (G-Pg′) and lower lip protrusion (Li-SnPg′) showed a statistically significant decrease in post-treatment values. For Group II (Table 2), maxillary values such as maxillary prognathism (G-Sn), upper lip protrusion (Ls-SnPg′), Ls-Is and also facial convexity (G-Sn-Pg′) showed a statistically significant increase in post-treatment values whereas mandibular values such as mandibular prognathism (G-Pg′) and lower lip protrusion (Li-SnPg′) showed a statistically significant decrease in post-treatment values.
A comparison of changes seen in the hard tissue landmarks between single-jaw and bi-jaw surgeries of the 18 skeletal Class III cases along with their respective p values are shown in Table 3. N-A-Pg, N-A, Wits appraisal, and L1-MP (angle) showed statistically significant changes between single-jaw and bi-jaw groups. The comparison of changes seen in the soft tissue landmarks between single-jaw and bi-jaw surgeries of the 18 skeletal Class III cases along with their respective p values is also shown in Table 3. Facial convexity, maxillary prognathism, and upper lip protrusion (Ls-SnPg′) showed statistically significant changes between single-jaw and bi-jaw groups.
Table 3.
Comparison of changes seen in hard tissue landmarks between single-jaw and bi-jaw surgeries (N = 18, samples: single jaw and bi-jaw)
| Hard tissue parameters | Group 1: Single jaw | Group 2: Bi-jaw | p value |
|---|---|---|---|
| N = 9 | N = 9 | ||
| Mean ± SD | Mean ± SD | ||
| NAPg diff | 5.10 ± 6.01 | 16.83 ± 6.30 | 0.001* |
| NA diff | − 0.38 ± 1.85 | 4.9 ± 1.90 | 0.000* |
| Wits diff | 5.06 ± 3.69 | 9.43 ± 3.66 | 0.019* |
| L1-MP diff | − 5.41 ± 4.75 | 4.44 ± 5.26 | 0.001* |
| Soft tissue parameters | Group 1: Single Jaw | Group 2: Bi-jaw | p value |
|---|---|---|---|
| N = 9 | N = 9 | ||
| Mean ± SD | Mean ± SD | ||
| Facial convexity diff | 3.58 ± 5.05 | 10.34 ± 4.67 | 0.007* |
| Max. prog diff | − 1.34 ± 2.24 | 2.21 ± 1.38 | 0.002* |
| Ls-SnPg′ diff | − 0.15 ± 0.96 | 3.50 ± 1.86 | 0.000* |
*p value < 0.05 denotes statistically significant
NS—p value > 0.05 denotes statistically not significant
Correlation analyses were conducted between various hard tissue and soft tissue parameters for both single-jaw and bi-jaw groups (Table 4). Changes in N-A-Pg and changes facial convexity showed statistically significant correlation for both single-jaw and bi-jaw groups. Changes in Wits appraisal and changes in facial convexity showed statistically significant correlation for the bi-jaw group, but were insignificant for the single-jaw group. Changes in N-Pg and changes in mandibular prognathism showed statistically significant changes for the single-jaw group, but were insignificant for the bi-jaw group.
Table 4.
Correlation analysis between hard and soft tissue changes in single-jaw and bi-jaw surgeries (N = 18, samples: single jaw and bi-jaw)
| Single Jaw | Bi-Jaw | |||
|---|---|---|---|---|
| NAPg diff | Facial convexity diff | NAPg diff | Facial convexity diff | |
| NAPg diff | 1 | r = 0.535 | 1 | r = 0.886 |
| p value | – | 0.046* | – | 0.001** |
| Facial convexity diff | 0.535 | 1 | 0.886 | 1 |
| p value | 0.046* | – | 0.001** | – |
| Wits diff | Facial convexity diff | Wits diff | Facial convexity diff | |
|---|---|---|---|---|
| Wits diff | 1 | r = 0.197 | 1 | r = 0.543 |
| p value | – | 0.463 NS | – | 0.045* |
| Facial convexity diff | 0.197 | 1 | 0.543 | 1 |
| p value | 0.463 NS | – | 0.045* | – |
| N-Pg diff | Mand. prog diff | N-Pg diff | Mand. prog diff | |
|---|---|---|---|---|
| N-Pg diff | 1 | r = 0.535 | 1 | r = 0.418 |
| p value | – | 0.046* | – | 0.132 NS |
| Mand. prog diff | 0.535 | 1 | 0.418 | 1 |
| p value | 0.046* | – | 0.132 NS | – |
Hard tissue and soft tissue analysis of Class III surgical cases
*p value < 0.05 denotes statistically significant
**p value < 0.05 highly significant
Discussion
Factors involved in the treatment planning for skeletal Class III cases are numerous. Most often clinicians resort to single-jaw surgeries owing to the dental compensations which camouflage the skeletal discrepancies and the cost factor. These often result in less than ideal treatment outcomes especially in relation to the soft tissue. Hence, this study has assessed the changes brought about by single- and bi-jaw surgeries necessary to institute ideal treatment planning concepts among clinicians.
Both bi-jaw and single-jaw groups exhibited a pattern of increasing convexity in the hard tissue profile which was highly significant. The difference between the two groups lies in the severity of the initial concavity and the aggregate change brought about post-treatment. Most cases treated with bi-jaw surgery displayed evident maxillary retrognathism in combination with mandibular prognathism. The additional maxillary advancement required in these cases brought about these increased changes [13]. The maxillary hard tissue position showed a statistically significant increase in N-A from the presurgical to post-treatment phase in bi-jaw cases [14]. This was insignificant in the single-jaw group due to the lack of upper jaw advancement. There was statistically significant reduction in the mandible and chin position from presurgical to post-treatment phases, but the difference between the groups was statistically insignificant as mandibular setback was common to both groups.
The changes in maxillary teeth inclination were not significant in both groups and between them as the changes were evaluated from presurgical to post-treatment phases in which the incisors were brought within the normal inclination range by decompensation. But, there was considerable change in lower incisor inclination between the two groups. The incisors retroclined from an upright position in single-jaw group owing to the Class III elastics in postsurgical settling and proclined in the bi-jaw group as they underwent complete decompensation for stable results [15].
On assessing mandibular plane angle changes, single-jaw cases exhibited a mild increase due to the wedging effect in the posteriors after the setback was completed. On the other hand, bi-jaw cases showed a reduction after treatment as the wedging effect in the posteriors had been moved more anteriorly due to the maxillary advancement [16]. Mandibular length (Go-Pg) values reduced from presurgical to post-treatment phases. In single-jaw patients, the amount of change was statistically insignificant as variable levels of setback were performed depending on the severity of the mandibular prognathism, while in bi-jaw cases the difference was significant as nearly all cases were treated by a similar amount of setback due to increased skeletal discrepancy [17]. The lack of significance in chin prominence can be ascribed to the fact that all the cases of the sample did not show the same level of chin prominence [18]. For those cases having a reduced chin prominence, an adjunctive surgical procedure such as advancement genioplasty was advised once the soft and hard tissue profiles had been re-evaluated after the first surgery, so as to achieve optimal facial balance.
On evaluating the soft tissue parameters both the groups showed an increase in G-Sn-Pg′ from concave to an orthognathic profile which was statistically significant but greater in treatment of bimaxillary surgical cases as it involved a maxillary advancement along with the mandibular setback which reflected its changes in the soft tissue [13].
Single-jaw patients showed only a mild reduction in the mean soft tissue maxillary prognathism (G-Sn) which was statistically insignificant as most of the presurgical maxillary values of single-jaw cases ranged from orthognathic to mildly prognathic and did not warrant any upper surgical intervention. Dentoalveolar compensation in the form of upper incisor proclination may have also played a role in the initial pseudo-positioning of the soft tissue. Bi-jaw cases on the other hand showed an increase in G-Sn from presurgical to post-treatment phases and were statistically significant due to the evident underlying maxillary retrognathism [16].
Post-treatment upper lip protrusion (Ls-SnPg′) and lip thickness (Ls-Is) showed reduction in values, but the changes were statistically significant only for the lip thickness in single-jaw group. This reduction may have occurred due to the pseudo-position occupied by the upper lip before surgery as a result of the underlying dentoalveolar compensation [6]. While maxillary advancement was performed in the other group a larger increase in the upper lip protrusion was statistically significant. In contrast, statistically insignificant reduction in upper lip thickness was evident in bi-jaw cases as the presurgical lip thickness in these cases were increased and hence experienced minimal change after surgery. A similar phenomenon had been explained by earlier studies [3, 19] on Class III cases with maxillary deficiency where patients with thin lips experienced three times more change than those with thick lips for the same amount of bone movement.
Both groups showed reduction tendencies in soft tissue mandibular prognathism (G-Pg′) and lower lip protrusion from presurgical to post-treatment phases and were statistically significant as a result of the setback procedure [13, 16].
Lower lip thickness (Li-Ii) and chin thickness (Pg-Pg′) increased from presurgical to post-treatment phases but was statistically insignificant. This increase can be attributed to the mandibular setback as the surgical intervention relieves the pressure against the soft tissue in the area allowing it to increase in thickness. Also the changes in the lower incisor inclination during postsurgical orthodontics may have had an effect on the change in lower lip thickness [4].
Mentolabial sulcus (B-Sli) in both groups of patients showed very minimal mean reduction from presurgical to post-treatment phases as the soft tissue in this area closely followed the amount of hard tissue change brought about by the mandibular setback procedure [20].
Single-jaw cases showed an acute nasolabial angle presurgically which increased in the post-treatment phase but was statistically insignificant. This increase in Cm-Sn-Ls could have been caused by the reduction in the upper lip (Ls) from its pseudo-position due to the initial dentoalveolar compensation [21]. Bi-jaw cases, however, showed relatively normal to reduced presurgical values which reduced further to acute Cm-Sn-Ls angles in the post-treatment phase but was statistically insignificant. This change in Cm-Sn-Ls can be attributed to the Le Fort I advancement performed on the maxilla in these cases, which caused the upper lip (Ls) also to advance and also caused the rotation of the nasal tip in an upward direction [22, 23] making the angle more acute in the process. An additional side effect of this procedure is the widening of the alar base. This may be corrected by an adjunctive rhinoplasty to achieve optimal facial esthetics.
When orthognathic surgeries are performed, it is imperative to relate the amount of soft tissue change brought about by the hard tissue correction. The ratio of change often varies with different ethnic groups. Hence, this study has provided an insight to the significant hard to soft tissue relation in Indian population.
The groups showed a statistically significant positive correlation in the change in N-A-Pg to the change in soft tissue facial convexity indicating that any increase in N-A-Pg value also resulted in an increase in the soft tissue facial convexity in all cases of the sample. The level of correlation, however, varied between the two groups. Single-jaw cases showed a relatively low level of positive correlation (r2 = 28%) indicating that the soft tissue facial convexity would only follow up to 28% of the change in N-A-Pg brought about by surgical intervention. This can be attributed to the fact that the initial concavity was relatively mild and only one jaw was surgically altered in these cases hence causing reduced change in the related overlying soft tissue profile. Bi-jaw cases on the other hand showed a high level of positive correlation (r2 = 78%) indicating that the soft tissue convexity would follow the surgical change in N-A-Pg up to 78% of the distance. This level of correlation is observed as a result of the highly negative convexity observed presurgically due to the additional maxillary retrognathism, which when corrected caused a greater overall change in the soft tissue profile that closely followed hard tissue change [24].
Single-jaw cases showed a positive correlation (r2 = 4%) between the change in Wits appraisal and the soft tissue facial convexity but was statistically insignificant. Bi-jaw cases, on the other hand, showed a positive correlation between the two measurements which was statistically significant (r2 = 29%).The level of change in Group 2 indicated that the soft tissue facial convexity showed up to 29% of the change in Wits variable [18].
Single-jaw cases showed a (r2 = 28%) moderate level of positive correlation between hard and soft tissue chin changes which was statistically significant. This level of change can be attributed to the mandibular setback procedure carried out in these cases which permits the overlying soft tissue to fall back to a certain extent. Group 2, on the other hand, showed a mean positive correlation between the two measurements (r2 = 17%) but was statistically insignificant. This can be attributed to the fact that the preoperative soft tissue thickness in the chin area, and their response to the surgical change can vary greatly from one patient to the next [18, 25, 26].
The surgical procedures examined in this study were limited to Le Fort I advancement and bilateral sagittal split osteotomy setback. The effect of other surgeries such as single-jaw maxillary advancement and adjunctive procedures like genioplasty, rhinoplasty, lip procedures (augmentation or reduction), and submental procedures could produce different results in terms of soft tissue changes. Further research into the response of the soft tissues to each procedure can improve the accuracy of prediction models created by imaging programs which are commonly used today.
Conclusion
The present study provides evidence of the following results:
Bimaxillary surgical cases treated by a BSSO setback along with a Le Fort I advancement osteotomy showed an increase in the facial convexity and Wits appraisal by a much larger extent than their single-jaw counterparts, due to the correction of the additional maxillary retrognathism.
Increase in upper lip protrusion and maxillary prognathism (soft tissue) was significant.
Mandibular hard and soft tissue measurements showed a reduction from presurgical to post-treatment phases as a result of the surgical setback.
The upper lip thickness showed reduction in bi-jaw cases due to maxillary skeletal advancement. In single-jaw patients, upper lip changes were evident due to the pseudo-position taken up by the lip as a result of dental compensations. The lower lip thickness alone showed a mildly increasing trend between the two phases, which was, however, statistically insignificant.
Correlation analyses indicated significant positive correlations between Wits variable to G-Sn-Pg in bi-jaw cases, in addition single-jaw cases showed positive correlation between N-Pg to G-Pg′ (hard to soft tissue chin position), while N-A-Pg to G-Sn-Pg′ (hard to soft tissue convexities) correlation was positive in both groups.
In conclusion, both groups of patients attained orthognathic values for all measurements with the exception of the nasolabial angle for certain bimaxillary surgical cases which was shown to be more acute in the post-treatment phase. However, the overall facial appearance was greatly improved in all cases further highlighting the importance of the soft tissue in diagnosis and treatment planning.
References
- 1.McCollum AGH, Evans WG. Facial soft tissue the alpha and omega of treatment planning in orthognathic surgery. Semin Orthod. 2009;15:196–216. doi: 10.1053/j.sodo.2009.03.004. [DOI] [Google Scholar]
- 2.Robinson SW, Speider TM, Isaacson RJ, Worms FW. Soft tissue profile change produced by reduction of mandibular prognathism. Angle Orthod. 1972;42(3):227–235. doi: 10.1043/0003-3219(1972)042<0227:STPCPB>2.0.CO;2. [DOI] [PubMed] [Google Scholar]
- 3.McCollum AGH, Dancaster JT, Evans WG, Becker PJ. Sagittal soft-tissue changes related to the maxillary deficient Class-III malocclusions. Semin Orthod. 2009;15:172–184. doi: 10.1053/j.sodo.2009.03.003. [DOI] [Google Scholar]
- 4.Jokic D, Jokic D, Uglesic V, et al. Soft tissue changes after mandibular setback and bimaxillary surgery in Class III patients. Angle Orthod. 2013;83:817–823. doi: 10.2319/100112-775.1. [DOI] [PMC free article] [PubMed] [Google Scholar]
- 5.Mobarak KA, Krogstad O, Espeland L, et al. Factors influencing the predictability of soft tissue profile. Angle Orthod. 2001;71(3):216–227. doi: 10.1043/0003-3219(2001)071<0216:FITPOS>2.0.CO;2. [DOI] [PubMed] [Google Scholar]
- 6.Ingervall B, Thuer U, Vuillemin T. Stability and effect on the soft tissue profile of mandibular setback with sagittal split osteotomy and rigid internal fixation. Int J Adult Orthod Orthognath Surg. 1995;10(1):15–25. [PubMed] [Google Scholar]
- 7.Legan H, Burstone CJ. Soft tissue cephalometric analysis for orthognathic surgery. J Oral Surg. 1980;38:744–751. [PubMed] [Google Scholar]
- 8.Yadav AO, Walia CS, Borle RM, et al. Cephalometric norms for Central Indian population using Burstone and Legan analysis. Indian J Dent Res. 2011;22:28–33. doi: 10.4103/0970-9290.79970. [DOI] [PubMed] [Google Scholar]
- 9.Moorrees CFA. Natural head position—a revival. Am J Orthod Dentofac Orthop. 1994;105:512–513. doi: 10.1016/S0889-5406(94)70014-1. [DOI] [PubMed] [Google Scholar]
- 10.Naoumova J, Lindman R. A comparison of manual traced images and corresponding scanned radiographs digitally traced. Eur J Orthod. 2009;31:247–253. doi: 10.1093/ejo/cjn110. [DOI] [PubMed] [Google Scholar]
- 11.Burstone CJ, James RB, Legan H, et al. Cephalometrics for orthognathic surgery. J Oral Surg. 1978;36:26–277. [PubMed] [Google Scholar]
- 12.Kalha AS, Latif A, Govardhan SN. Soft-tissue cephalometric norms in a South Indian ethnic population. Am J Orthod Dentofac Orthop. 2008;133:876–881. doi: 10.1016/j.ajodo.2006.05.043. [DOI] [PubMed] [Google Scholar]
- 13.Chew MT. Soft and hard tissue changes after bimaxillary surgery. Angle Orthod. 2005;75:959–963. doi: 10.1043/0003-3219(2005)75[959:SAHTCA]2.0.CO;2. [DOI] [PubMed] [Google Scholar]
- 14.Lin SS, Kerr WJS. Soft and hard tissue changes in Class III patients treated by bimaxillary surgery. Eur J Orthod. 1998;20:25–33. doi: 10.1093/ejo/20.1.25. [DOI] [PubMed] [Google Scholar]
- 15.Kim DK, Baek SH. Change in maxillary incisor inclination during surgical-orthodontic treatment of skeletal Class III malocclusion: comparison of extraction and nonextraction of the maxillary first premolars. Am J Orthod Dentofac Orthop. 2013;143(3):324–335. doi: 10.1016/j.ajodo.2012.10.014. [DOI] [PubMed] [Google Scholar]
- 16.Hu J, Wang D, Luo S, et al. Differences in soft tissue profile changes following mandibular setback in Chinese men and women. J Oral Maxillofac Surg. 1999;57:1182–1186. doi: 10.1016/S0278-2391(99)90481-0. [DOI] [PubMed] [Google Scholar]
- 17.Alijani S, Nouri M, Akbarzade A. Changes in craniofacial morphology, head and neck posture following mandibular setback surgery. Iran J Orthod. 2013;8:47–56. [Google Scholar]
- 18.Altug-Atac AT, Bolatoglu H, Memikoglu UT. Facial soft tissue profile following bimaxillary orthognathic surgery. Angle Orthod. 2008;78(1):50–57. doi: 10.2319/122206-525.1. [DOI] [PubMed] [Google Scholar]
- 19.Stella JP, Streater MR, Epker BN. Predictability of upper lip soft tissue changes with maxillary advancement. J Oral Maxillo fac Surg. 1989;47:697–703. doi: 10.1016/S0278-2391(89)80008-4. [DOI] [PubMed] [Google Scholar]
- 20.Chew MT, Sandham A, Wong HB. Evaluation of the linearity of soft to hard tissue movement after orthognathic. Am J Orthod Dentofac Orthop. 2008;134:665–670. doi: 10.1016/j.ajodo.2006.12.017. [DOI] [PubMed] [Google Scholar]
- 21.Naoumova J, Söderfeldt B, Lindman R. Soft tissue profile changes after vertical ramus osteotomy. Eur J Orthod. 2008;30:359–365. doi: 10.1093/ejo/cjn025. [DOI] [PubMed] [Google Scholar]
- 22.McCance AM, Moss JP, Wright WR, et al. A three-dimensional soft tissue analysis of 16 skeletal class III patients. Brit J Oral Maxillofac Surg. 1992;30:221–232. doi: 10.1016/0266-4356(92)90264-J. [DOI] [PubMed] [Google Scholar]
- 23.Proffit WR, Fields HW, Sarver DM, Ackerman JL. Contemporary orthodontics, chapter 19. 5. Amsterdam: Elsevier; 2013. pp. 705–708. [Google Scholar]
- 24.Marsan G, Oztas E, Kuvat SV, et al. Changes in soft tissue profile after mandibular setback surgery in Class III subjects. Int J Oral Maxillofac Surg. 2009;38:236–240. doi: 10.1016/j.ijom.2008.12.005. [DOI] [PubMed] [Google Scholar]
- 25.Gaggl A, Schultes G, Kurcher H. Changes in soft tissue profile after sagittal split osteotomy and retropostioning of the mandible. J Oral Maxillofac Surg. 1999;57:542–546. doi: 10.1016/S0278-2391(99)90072-1. [DOI] [PubMed] [Google Scholar]
- 26.Chou JIC, Fong HJ, Kuang SH, et al. A retrospective analysis of the stability and relapse of soft and hard tissue change after BSSO for mandibular setback of 64 Taiwanese patients. J Oral Maxillofac Surg. 2005;63(3):355–361. doi: 10.1016/j.joms.2004.05.228. [DOI] [PubMed] [Google Scholar]