Abstract
Cardiac MRI tagging is a valuable technique for evaluating regional heart function. Currently, there are a number of different techniques for analyzing the tagged images. Specifically, k-space-based analysis techniques showed to be much faster than image-based techniques, where harmonic-phase (HARP) and sine-wave modeling (SinMod) stand as two famous techniques of the former group, which are frequently used in clinical studies. In this study, we compared HARP and SinMod and studied inter-observer variability between the two techniques for evaluating myocardial strain and apical-to-base torsion in numerical phantom, nine healthy controls, and thirty diabetic patients. Based on the ground-truth numerical phantom measurements (strain =−20% and rotation angle=−4.4°), HARP and SinMod resulted in overestimation (in absolute value terms) of strain by 1% and 5% (strain values), and of rotation angle by 0.4° and 2.0°, respectively. For the in-vivo results, global strain and torsion ranges were −10.6–35.3% and 1.8–12.7° /cm in patients, and −17.8–−32.7% and 1.8–12.3° /cm in volunteers. On average, SinMod overestimated strain measurements by 5.7% and 5.9% (strain values) in the patients and volunteers, respectively, compared to HARP, and overestimated torsion measurements by 2.9° /cm and 2.5° /cm in the patients and volunteers, respectively, compared to HARP. Location-wise, the ranges for basal, midventricular, and apical strain in patients (volunteers) were −8.4–−31.5% (−11.6–−33.3%), 6.3–−37.2% (−17.8–−33.3%), and −5.2–−38.4% (−20.0–−33.2%), respectively. SinMod overestimated strain in the basal, mid-ventricular, and apical slices by 4.7%(5.7%), 5.9%(5.5%), and 8.9%(6.8%), respectively, compared to HARP in the patients(volunteers). Nevertheless, there existed good correlation between the HARP and SinMod measurements. Finally, there were no significant strain or torsion measurement differences between patients and volunteers. There existed good interobserver agreement, as all measurement differences lied within the Bland-Altman ±2 standard-deviation (SD) difference limits. In conclusion, despite the consistency of the results by either HARP or SinMod and acceptable agreement of the generated strain and torsion patterns by both techniques, SinMod systematically overestimated the measurements compared to HARP. Under current operating conditions, the measurements from HARP and SinMod cannot be used interchangeably.
Keywords: heart, tagging, HARP, SinMod, strain, torsion
1. Introduction
Cardiac MRI tagging is a valuable technique for evaluating regional heart function [1–6]. Compared to global heart function (e.g. ejection fraction), regional heart function parameters (e.g. myocardial strain and torsion) evaluated by MRI tagging provide information about segmental myocardial dysfunction, which typically precedes global dysfunction [7], thus allowing for early medical intervention and better treatment outcome [8, 9].
The tagging pulse sequence is a modified version of the conventional cine sequence, in which magnetization excitation and data acquisition are preceded by a tagging preparation module. Most commonly, spatial modulation of magnetization (SPAMM) tagging is implemented as the tagging preparation module [10, 11]. In its simplest form, the SPAMM module is comprised of two non-selective (hard) 90° radiofrequency (RF) pulses that are interspersed by a modulation gradient and followed by a spoiler gradient. The first RF pulse in the tagging module excites the magnetization by tipping it into the transverse plane, where it is spatially modulated based on the magnitude and direction of the applied modulation gradient. The modulated magnetization is then tipped back into the longitudinal direction by the second RF pulse. The remaining transverse magnetization is then removed by the spoiler gradient.
The tagging preparation module results in generating parallel planes of saturated magnetization applied perpendicular to the imaged slice. For application of a tagging grid, two tagging modules are applied in two orthogonal directions immediately after each other, such that the tagging grid results as the product of the two generated sets of orthogonal taglines. As magnetization is an intrinsic tissue characteristic, then during the cardiac cycle when the myocardium experiences deformation, the taglines are deformed correspondingly, i.e. the taglines act as virtual intramyocardial markers. Myocardial displacement can then be measured by acquiring a cine set of images during different timeframes (heart phases) in the cardiac cycle and applying a tagging analysis technique to track the taglines deformation from one timeframe to another. Based on the calculated displacement, different deformation parameters can be calculated to describe regional heart function.
Different tagging analysis techniques have been developed, which can be broadly divided into image-based and k-space-based techniques. The magnitude-based techniques are based on directly analyzing the tagged images by identifying the taglines and tracking their deformation from one timeframe to another. Examples of the techniques in this category include optical flow [12–15], deformable models [16, 17], and active contour analysis [18–21]. Alternatively, the k-space-based techniques are based on analyzing the Fourier transform (FT), also known as k-space, of the tagged images. Famous techniques in this category include harmonic phase (HARP) [22–26] and sinewave modeling (SinMod) [27–29] analysis. Compared to the image-based-techniques, the k-space-based techniques are much faster and less prone to image artifacts [2, 30–32].
The purpose of this study is to compare the HARP and SinMod tagging analysis techniques for evaluating myocardial strain and torsion in healthy volunteers and patients with type-1 diabetes mellitus.
2. Methods
2.1. HARP Analysis
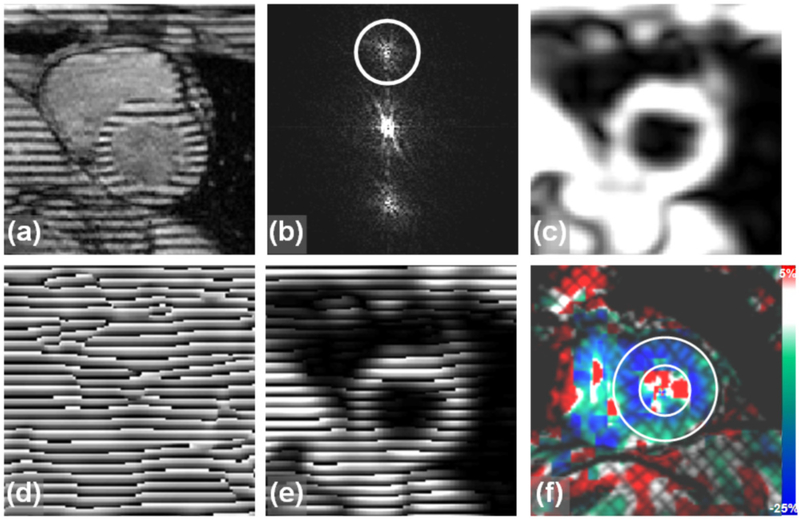
HARP analysis is based on isolating the harmonic signal peak in the k-space of the tagged image and constructing a harmonic-phase (HARP) image, which is the product of the magnitude and phase images of the inverse FT of the filtered image, as illustrated in Figure 1.
Figure 1.
The HARP technique. Constructing the harmonic phase (HARP) image. (a) Original SPAMM tagged image. (b) k-space of the tagged image. HARP applies a spatial bandpass filter to extract only the first harmonic peak. (c) Magnitude image extracted by applying a low-pass filter to the k-space in (b). The image shows the underlying anatomical structure in the tagged image. (d) Phase image extracted by applying a band-pass filter to the k-space in (b). (e) Multiplying the magnitude and phase images results in the HARP image with modulation pattern very similar to that in the original tagged image. (f) An example of a grid-tagged image analyzed with HARP, showing color-coded strain. (Figure reproduced from Ibrahim, JCMR 2011, 13:36 [1]).
The basic underlying principle of HARP tracking is that the harmonic phase, φ, of a material point, p, is an imposed material property that is invariant in time, t, i.e. [22]
| (1) |
where subscript m is the frame number. Thus, by tracking the harmonic phase vector of each pixel over time, one can track the position and, by extension, the displacement of each pixel over time. A neighborhood search is typically performed to find the pixel position Pm+1 at time tm+1 that has a harmonic phase identical to the harmonic phase of the defined pixel pm at time tm. This step is repeated for each incrementing timeframe to yield the path line of motion for each selected pixel. Finding a solution to equation (1) is a multi-dimensional, nonlinear problem, which can be solved iteratively.
Grid-tagged cine images are usually acquired, from which the HARP images are reconstructed by isolating the first harmonic peak (in the k-space) along the x- and y-directions. Nevertheless, the HARP image that is reconstructed for each direction is phase-wrapped. The relationship between the wrapped 2D harmonic phase vector (a) and the true 2D harmonic phase vector (φ) can be expressed as
| (2) |
where is the nonlinear wrapping function, defined as
| (3) |
| (4) |
where 𝑚𝑜𝑑 is the modulation (remainder) function, and φ1 and φ2 are the tag point’s harmonic phases in the x- and y-directions, respectively. The spatial gradient of φ is equal to the spatial gradient of the wrapped harmonic phase vector a, except at points of discontinuities, i.e.
| (5) |
| (6) |
Let us consider two material points p0, and p0, at time t = 0. The strain between these two points at time tm is expressed as
| (7) |
To measure circumferential strain, the two points are selected to be located along the left ventricle (LV) circumference. To measure radial strain, the two points are selected to be located along the LV radius. HARP has been previously validated against conventional tagging [33].
2.2. SinMod Analysis
The SinMod technique is a frequency-based method for extracting myocardial motion from the tagged images based on sinusoidal approximation [27]. In SinMod, the intensity distribution in the neighborhood of each pixel is modeled as a summation of sinusoidal wavefronts (selected by tuned 2D bandpass filter (BPF)), which describe the motion of the myocardial tissue. For each sinusoidal wave, the displacement perpendicular to the wavefront is estimated for each pixel, resulting in a map showing this displacement component. By combining maps for different wave directions, 2D motion can be determined in the imaging plane. Specifically, the image intensity in the environment of each pixel (P, Q) is modeled as part of a cosine wave with local frequency and amplitude, represented as
| (8) |
| (9) |
where ωp and 𝜑 are the spatial frequency and phase of the wave, respectively; 𝐴1 and 𝐴2 are the wave magnitudes in the first and second images I1 and I2 (representing temporal frames at times t1 and t2, respectively); 𝜂1 and 𝜂2 are added noises, reflecting low image quality and signal-to-noise ratio (SNR); and 𝑢 is the displacement between these two images at position (P, Q) along the P direction.
The flowchart of the SinMod algorithm is shown in Figure 2. The principle behind SinMod tracking is that both the phase and frequency of each pixel are determined directly from the frequency analysis, such that the displacement can be calculated from the quotient of the phase difference and local frequency.
Figure 2.
Flow diagram of the algorithm for displacement mapping using SinMod analysis. The tagged images I1 and I2 (at timeframes t1 and t2) are Fourier transformed, followed by wave vector extraction. A window around the band-passed frequencies (BPF) is inversely Fourier transformed to obtain the power spectra. Displacement is then obtained along the direction of the wave vector, along with a quality measure of the measurement accuracy. Repeating the algorithm with a perpendicularly directed wave vector allows for mapping the 2D displacement vector.
After obtaining FT of the input images I1(P, Q) and I2(P, Q), the same BPF is applied to both images to isolate corresponding spectral peaks and produce a pair of complex images in the Fourier domain. Let us refer to these two images as IBf1(ωP, ωQ) and IBf2(ωP, ωQ). Applying a lowpass filter (LPF) and a highpass filter (HPF) to both IBf1 and IBf2 followed by an inverse FT leads to four complex images: IBfLf1(P, Q), IBfHf1(P, Q), IBfLf2(P, Q), and IBfHf2(P, Q). The reason for applying LPF and HPF to IBf1 and IBf2 is to determine the local spatial frequency using power spectra. The two power spectra and the cross-power spectrum are given by
| (10) |
| (11) |
| (12) |
where is the complex conjugate of I. The local frequency ωp and local displacement 𝑢 can then be estimated as
| (13) |
| (14) |
where ωc is BPF center frequency and arg is argument function. The quality measure is derived from cross-power spectrum, which reflects SNR and phase homogeneity in the images.
2.3. Numerical Phantom Experiments
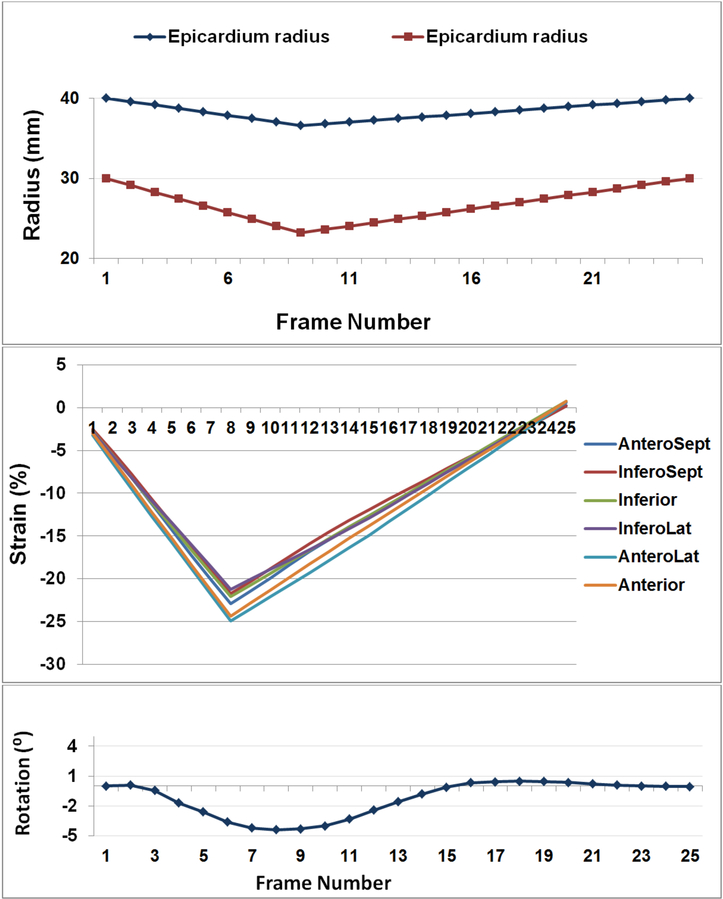
A numerical phantom (Figures 3 and 4) was built to evaluate the results of HARP and SinMod results against ground-truth data. This phantom consisted of a series of 25 images of size 256×256 pixels and field-of-view of 145×145 mm2, which represent different timeframes throughout the cardiac cycle with average peak circumferential strain (difference between end-systolic and end-diastolic strains) of −20% and average peak rotation of −4.4°. Each image contains an annular object that represents a shortaxis (SAX) view of a mid-cavity left ventricular (LV) slice with inner (endocardial) and outer (epicardial) radii of 30 and 40 mm, respectively, at end-diastole. The tag spacing is set to 7 mm, and the tagging pattern is tilted by 45° from the 𝑥-axis. The tagging pattern is created according to the formula:
| (15) |
where Itag is the myocardial signal intensity, 𝐴 is the amplitude of the sinusoidal signal, ω is the fundamental frequency of the sinusoidal pattern, and (𝑥′, 𝑦′) represents the spatial axes rotated by 45° with respect to (𝑥, 𝑦):
| (16) |
The tagline fading due to magnetization relaxation is modeled as:
| (17) |
where Itag,0 represents the initial tagging pattern at the beginning if the cardiac cycle, ut and vt represent spatial displacements at time t in the 𝑥′ and 𝑦′ directions, respectively, and 𝑓𝑎𝑑(t) is the fading function, which reflects the effect of the fading on the signal intensity. Finally, white Gaussian noise with power = 45 dB was added to the images.
Figure 3.
Numerical phantom of a short-axis tagged slice of the left ventricle. The images are shown at different timepoints (left to right and top to bottom) through the cardiac cycle. The tagging pattern shows myocardial contraction and rotation during systole, and opposite mechanics during diastole. Tags fading during the cardiac cycle was taken into consideration based on longitudinal magnetization relaxation.
Figure 4.
Ground-truth measurements of the numerical phantom. (a) Enodcardial and epicardial radii changes through different frames. (b) Circumferential strain measured for different segments. (c) Average rotation angle.
The synthetic displacement field is expressed in polar coordinates such that the radius 𝑅 between any pixel and the center of the myocardium linearly decreases and increases in the cases of radial contraction and expansion, respectively, during the cardiac cycle. The angle 𝜃 is of any pixel rotates with a predefined angle ∅ along the cardiac cycle. Hence, the shift di in radius Ri for any pixel 𝑖 at time t is calculated as follow:
| (18) |
Where
| (19) |
and (t) and Rendo(t) are the epicardium and endocardium radii, respectively, at time t. Δepi and Δendo are the shift in the epicardium and endocardium radii, respectively. Hence, the radius of each pixel in the image (with respect to the LV center) is calculated as follow
| (20) |
In the same way, the angle of each pixel in the image is calculated as
| (21) |
After measurement of tissue deformation in the polar coordinates, it is transformed back to the Cartesian coordinate to obtain (𝑥′ + 𝑢t) and (𝑦′ + 𝑣t), where an interpolating surface is constructed using linear interpolation to regrid the scattered positions at timepoint t.
2.4. In vivo Experiments
The study protocol has been approved by University of Michigan Internal Review Board, and informed consent was obtained from participants. Thirty type-1 diabetic patients and nine matched healthy volunteers were imaged on a 3.0T Philips Achieva MRI scanner (Philips Healthcare, Best, The Netherlands). Table 1 shows demographics information of the studied subjects. The subjects were imaged using a cardiac phased-array coil and a SPAMM tagging sequence with the following imaging parameters: retrospective electrocardiogram (ECG)-gated gradient-echo echo-planar imaging (TFEPI) sequence, # slices = 3 (short-axis slices at the LV basal, mid-ventricular, and apical levels), # reconstructed phases per cardiac cycle = 25, tag spacing = 7 mm, tagging grid angle = 45°, repetition time (TR) = 8.8 ms, echo time (TE) = 1.5 ms, flip angle = 10°, echo train length = 9, matrix = 256×256, spatial resolution = 1.25 mm, slice thickness = 8 mm, sensitivity-encoding (SENSE) acceleration factor = 2, readout bandwidth (BW) = 1231 Hz/pixels, and scan time = 11 s / slice. All images were obtained during breath-holding at end inspiration.
Table 1.
Demographic information of studied subjects.
| Parameter (unit) | Cases | Controls |
|---|---|---|
| Number | 30 | 9 |
| Sex (m/f) | 16/14 | 5/4 |
| Age (years) | 36.8±13.6 | 35.5±12.8 |
| BSA (m2) | 1.9±0.2 | 1.8±0.2 |
| HR (bpm) | 69.3±11.5 | 66.9±10.0 |
Abbreviations: bpm, beats per minute; BSA, body surface area; HR, heart rate; LV, left ventricle.
2.5. Data Analysis
The numerical phantom and in vivo tagged images were analyzed by two experts (EHI and SDS) using the HARP module (Diagnosoft, Inc, Durham, NC, USA) and SinMod by inTag plugin (Creatis Lab, Lyon, France) to measure peak systolic circumferential strain (Ecc) and apical-to-base torsion. Ecc was measured at the basal, mid-ventricular, and apical levels, as well as for the ventricle as a global value equal to the average of the strain measurements from all 17 American Heart Association (AHA) segments. Torsion was measured as the difference between the basal and apical rotations, divided by the distance between the two slices.
Strain and torsion measurements are represented as mean ± standard deviation (SD). Correlation and regression analyses were conducted to evaluate the relationship between HARP and SinMod measurements. Bland-Altman analysis was conducted to measure inter-observer variability in the strain and torsion measurements. Student’s ttest was conducted to evaluate the significance of the measurements’ differences between HARP and SinMod, inter-observer measurements, and patients and volunteers (P<0.05 was considered significant).
3. Results
3.1. Numerical Phantom Results
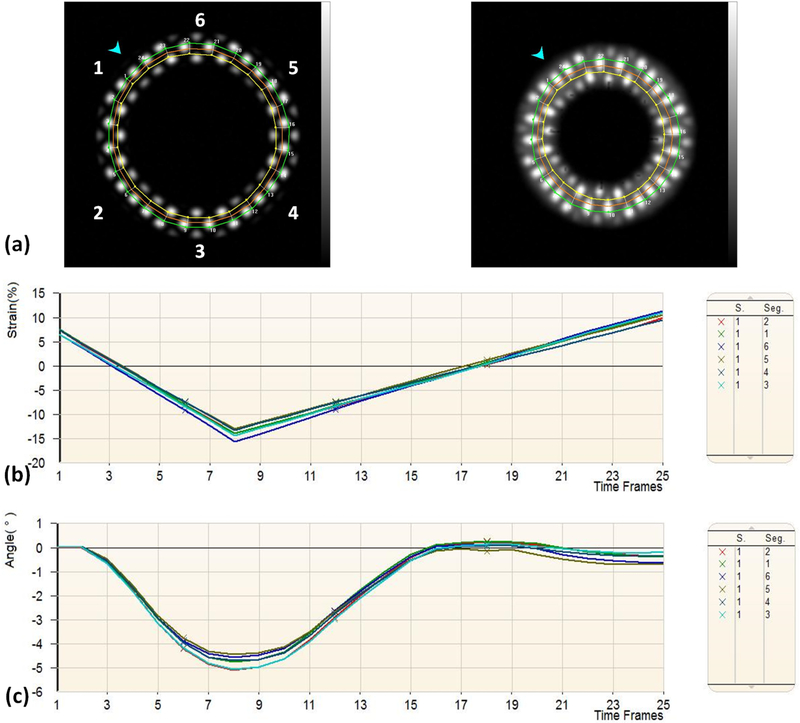
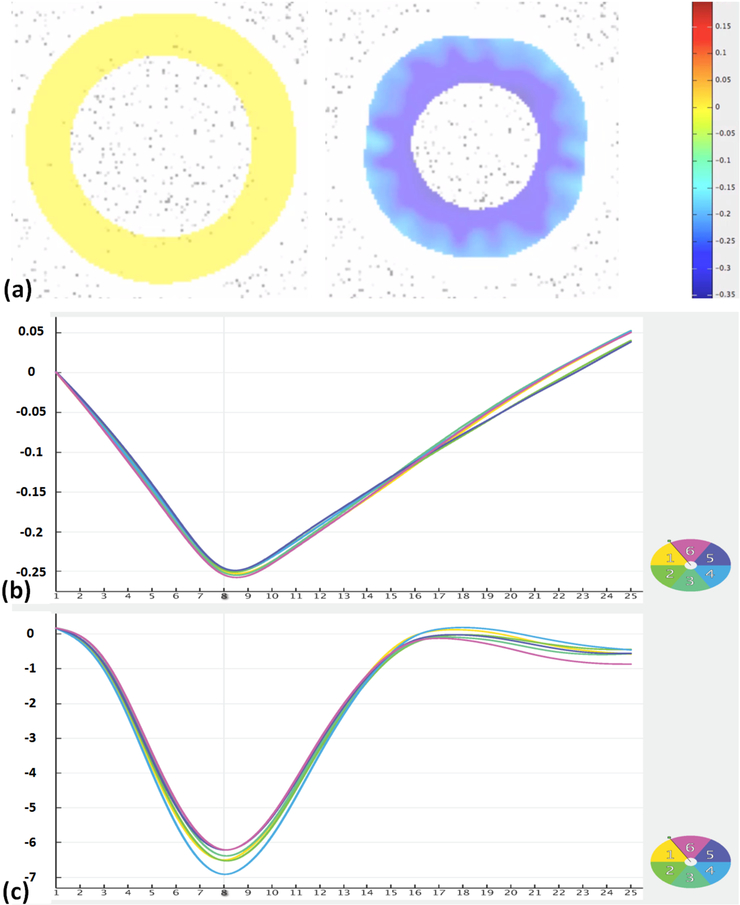
Figures 5 and 6 show the results of the numerical phantom analysis by HARP and SinMod, respectively. Average (over all slice segments) peak circumferential strain (difference between end-systolic and end-diastolic strains) was −21% and −25.8% by HARP and SinMod, respectively, which overestimated actual strain (in absolute value terms) by 1% and 5%, respectively. Average rotation angle was −4.8⁰ and −6.4⁰ by HARP and SinMod, respectively, which overestimated actual rotation angle (in absolute value terms) by 0.4° and 2.0°, respectively.
Figure 5.
HARP analysis results of the numerical phantom. (a) Tagged images and tracked mesh at end-diastole (left) and end-systole (right), with segment number shown on the left. (b) Circumferential strain of different segments. (c) Rotation angle of different segments.
Figure 6.
SinMod analysis results of the numerical phantom. (a) Color-coded strain maps at end-diastole (left) and end-systole (right). (b) Circumferential strain of different segments. (c) Rotation angle (°) of different segments.
3.2. In vivo Results
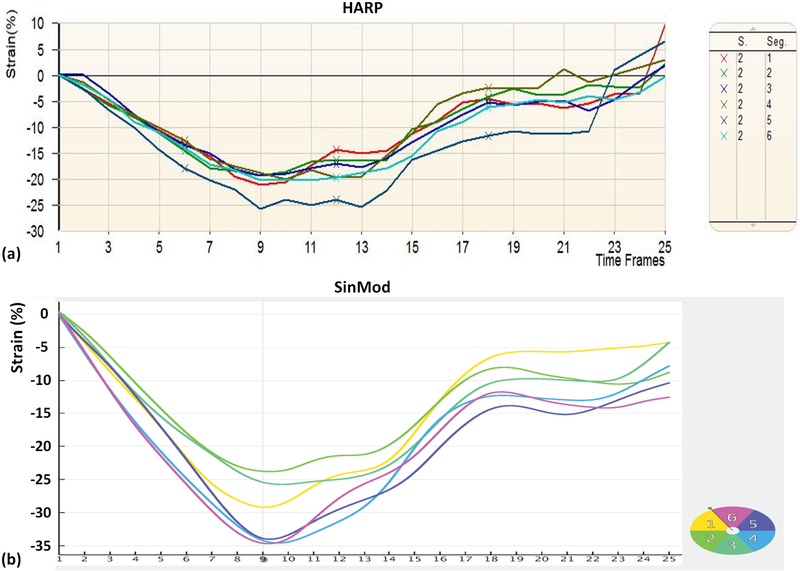
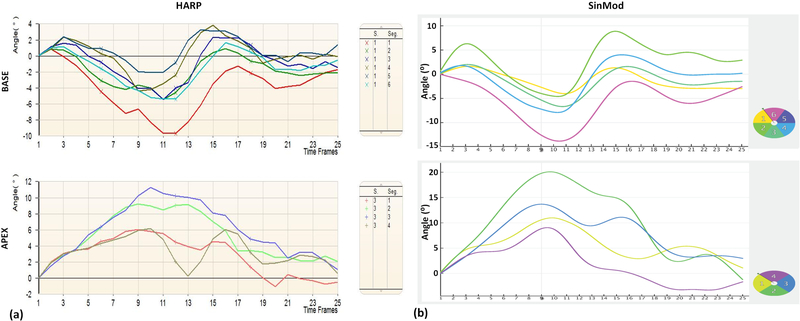
In general, global strain and torsion ranges were −10.6–−35.3% and 1.8–12.7⁰/cm in patients, and −17.8– −32.7% and 1.8–12.3°/cm in volunteers. Figures 7 and 8 show examples of the generated myocardial strain and rotation curves, respectively, using both HARP and SinMod in a patient. The figures show similar strain and rotation patterns despite measurements overestimation by SinMod compared to HARP (strain overestimation values between HARP and SinMod are reported here as strain units).
Figure 7.
Example HARP and SinMod strain curves of the same subject. Circumferential strain curves of different segments in a mid-ventricular short-axis slice in a patient using HARP (a) and SinMod (b). Note measurements overestimation by SinMod compared to HARP, despite the agreement of the strain curves between both techniques.
Figure 8.
Example HARP and SinMod rotation curves of the same subject. Basal (top) and apical (bottom) rotation curves of different segments in short-axis slices in a patient using HARP (a) and SinMod (b). Note measurements overestimation by SinMod compared to HARP, despite the agreement of the torsion curves between both techniques.
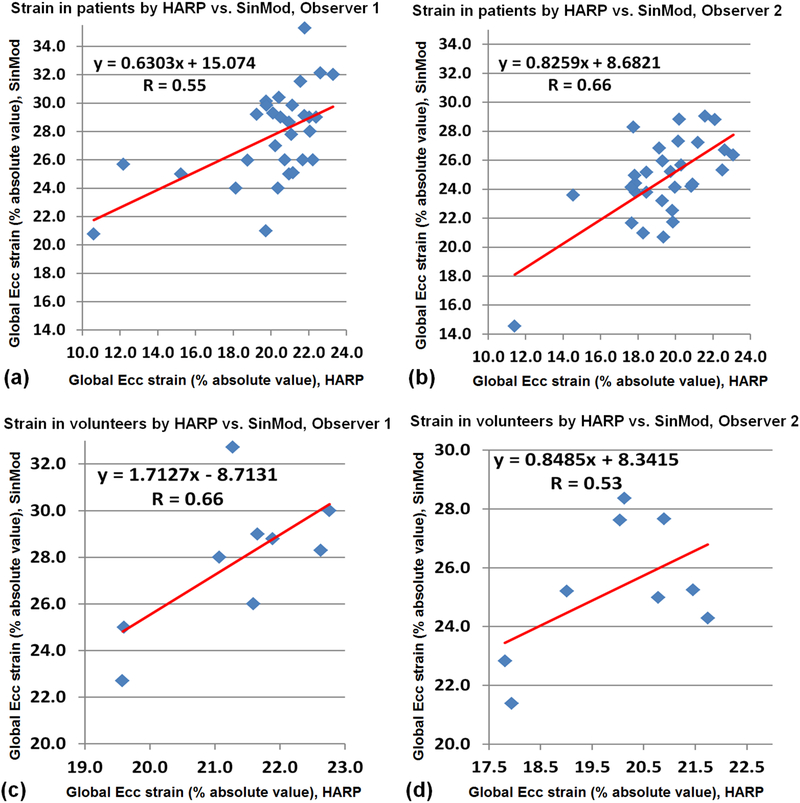
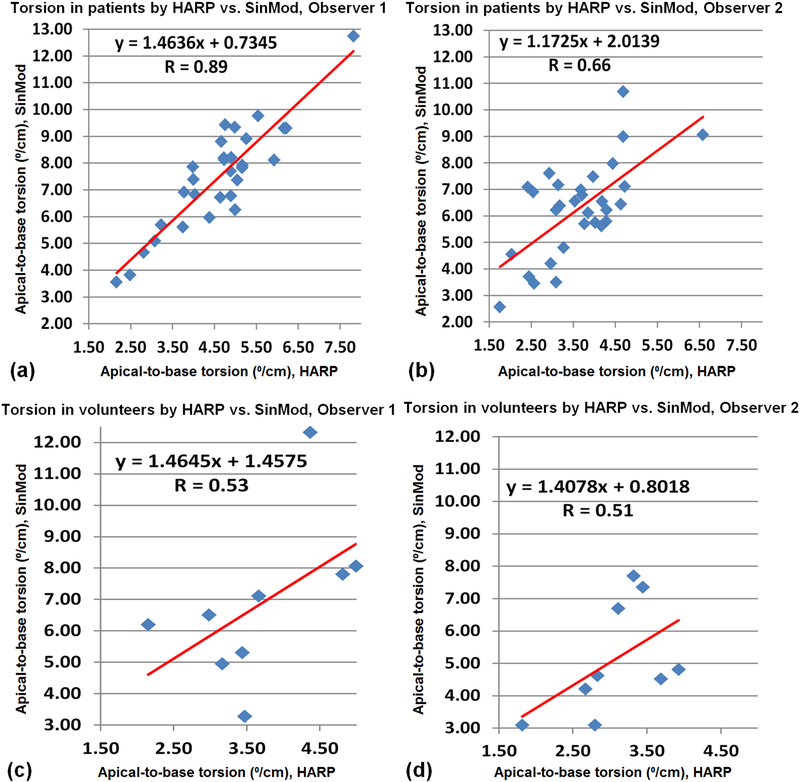
Tables 2 and 3 show strain and torsion measurements in the patients and volunteers, respectively. The correlation coefficients (R) between HARP and SinMod, as well as between the two observers are also shown in the tables. Figures 9 and 10 show plots of the LV global strain (Ecc) and torsion, respectively, measured by HARP versus SinMod in patients and volunteers, as analyzed by both observers. As shown in the Tables 2 and 3, all SinMod measurements were significantly larger than those by HARP (all measurement differences showed P < 0.005). On average, SinMod overestimated the strain measurements by 5.7% and 5.9% in the patients and volunteers, respectively, compared to HARP, and overestimated the torsion measurements by 2.9°/cm and 2.5 °/cm in the patients and volunteers, respectively, compared to HARP. Location-wise, the ranges for basal, mid-ventricular, and apical strain in patients (volunteers) were −8.4–−31.5% (−11.6–−33.3%), −6.3–−37.2% (−17.8–−33.3%), and −5.2–−38.4% (−20.0–−33.2%), respectively. SinMod overestimated strain in the basal, mid, and apical locations by 4.7%(5.7%), 5.9%(5.5%), and 8.9%(6.8%), respectively, compared to HARP in the patients(volunteers). Nevertheless, there existed consistency in the measurements by each technique, as seen by the good correlation between HARP and SinMod measurements in both patients and volunteers, except for apical strain (in patients and volunteers) and basal strain in the volunteers by one of the observers. It should be noted that few points showed as outliers in the plots in Figures 9 and 10, which resulted affected the resulting correlation coefficients. This could be attributed in part by lower image quality in these few cases. Finally, there were no significant strain or torsion measurements differences between the patients and the volunteers.
Table 2.
Strain and torsion measurements in diabetic patients.
| Parameter (unit) | Observer 1 | Observer 2 | Inter-observer | ||
|---|---|---|---|---|---|
| (mean ± SD) | R/P | (mean ± SD) | R/P | R/P | |
| Strain (base), HARP (%) | −19.6±2.8 | 0.65/.000 | −18.4±2.9 | 0.61/.000 | 0.84/.000 |
| Strain (base), SinMod (%) | −24.8±3.1 | −22.7±3.4 | 0.63/.000 | ||
| Strain (mid), HARP (%) | −20.5±3.7 | 0.55/.000 | −20.5±2.4 | 0.77/.000 | 0.68/.898 |
| Strain (mid), SinMod (%) | −28.2±4.4 | −24.7±3.4 | 0.59/.000 | ||
| Strain (apex), HARP (%) | −20.2±3.2 | 0.40/.000 | −19.1±3.9 | 0.26/.000 | 0.63/.066 |
| Strain (apex), SinMod (%) | −30.6±3.9 | −26.6±3.5 | 0.59/.000 | ||
| Strain (global), HARP (%) | −20.1±2.8 | 0.55/.000 | −19.3±2.4 | 0.66/.000 | 0.75/.038 |
| Strain (global), SinMod (%) | −27.7±3.2 | −23.1±6.8 | 0.56/.000 | ||
| Torsion, HARP (⁰/cm) | 4.3±1.5 | 0.89/.000 | 3.6±1.0 | 0.66/.000 | 0.88/.000 |
| Torsion, SinMod (⁰/cm) | 7.5±1.9 | 6.3±1.8 | 0.71/.000 | ||
R = correlation coefficient, P = t-test significance value
Table 3.
Strain and torsion measurements in normal volunteers.
| Parameter | Observer 1 | Observer 2 | Inter-observer | ||
|---|---|---|---|---|---|
| (mean ± SD) | R/P | (mean ± SD) | R/P | R/P | |
| Strain (base), HARP (%) | −20.3±1.5 | 0.18/.001 | −18.0±2.8 | 0.61/.000 | 0.62/.014 |
| Strain (base), SinMod (%) | −26.0±3.6 | −23.7±2.4 | 0.23/.113 | ||
| Strain (mid), HARP (%) | −22.0±1.6 | 0.88/.000 | −21.2±1.6 | 0.61/.000 | 0.87/.011 |
| Strain (mid), SinMod (%) | −27.7±3.7 | −25.6±2.9 | 0.71/.037 | ||
| Strain (apex), HARP (%) | −21.9±1.4 | 0.07/.000 | −21.2±1.0 | −0.38/.004 | 0.63/.090 |
| Strain (apex), SinMod (%) | −30.2±2.3 | −26.6±3.6 | 0.15/.024 | ||
| Strain (global), HARP (%) | −21.3±1.1 | 0.66/.000 | −20.0±1.4 | 0.53/.000 | 0.74/.003 |
| Strain (global), SinMod (%) | −27.8±2.9 | −25.3±2.3 | 0.30/.041 | ||
| Torsion, HARP (°/cm) | 3.7±0.9 | 0.53/.003 | 3.1±0.6 | 0.51/.003 | 0.76/.016 |
| Torsion, SinMod (°/cm) | 6.8±2.5 | 5.1±1.7 | 0.38/.071 | ||
R = correlation coefficient, P = t-test significance value
Figure 9.
Correlation and regression analysis of left-ventricular global circumferential strain (Ecc) measured by HARP versus SinMod. Results in patients (a,b) and volunteers (c,d), as analyzed by the first (a,c) and second (b,d) observers.
Figure 10.
Correlation and regression analysis of left-ventricular apical-to-basal torsion measured by HARP versus SinMod. Results in patients (a,b) and volunteers (c,d), as analyzed by the first (a,c) and second (b,d) observers.
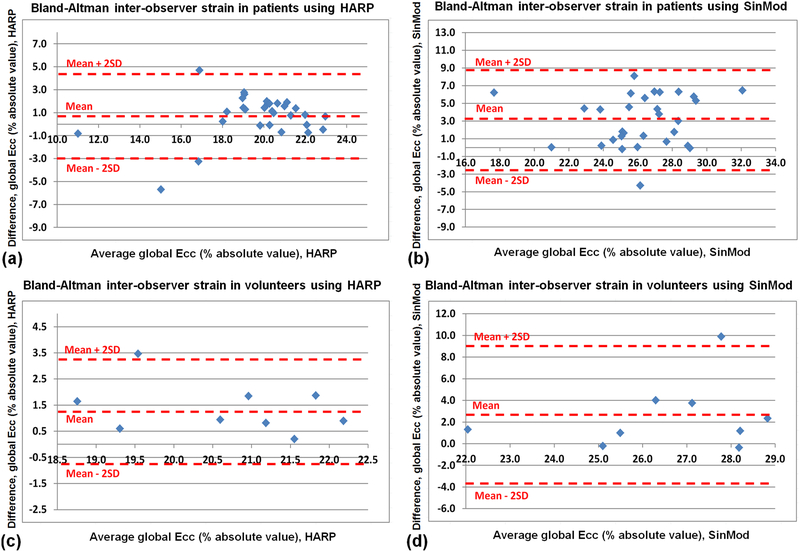
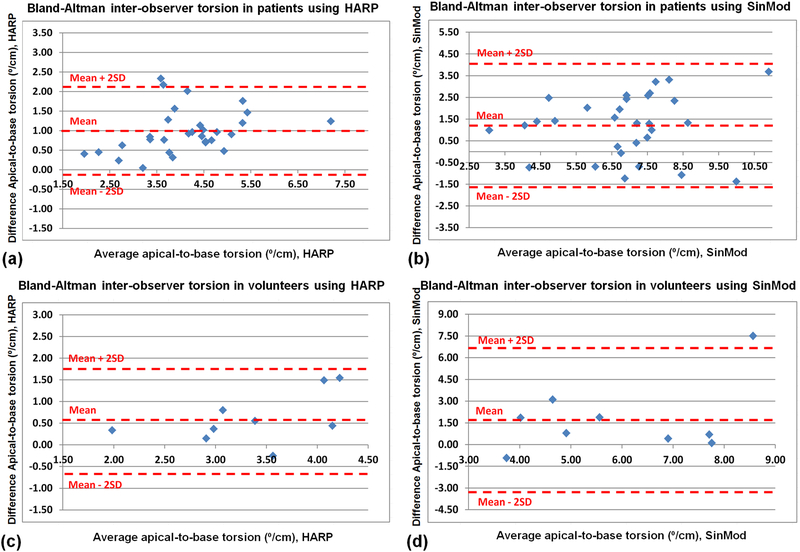
Figures 11 and 12 show results of the Bland-Altman inter-observer variability analysis of the LV strain (Ecc) and torsion, respectively, as measured by HARP and SinMod in the patients and volunteers. The overall inter-observer agreement was acceptable, with most of the measurement differences lying between the mean ± 2SD limits, which showed the following ranges (HARP/SinMod) in strain: −3.0 – 4.5% / −2.7 – 8.9% and −0.6 – 3.3% / −3.8 – 8.8% in the patients and volunteers, respectively, and the corresponding torsion ranges (HARP/SinMod): −0.1 – 2.1⁰cm−1 / −1.6 – 4.1°cm−1 and −0.6 – 1.8°cm−1 / −3.2 – 6.6°cm−1 in the patients and volunteers, respectively. As shown in the rightmost columns in Tables 2 and 3, there were good correlation coefficients between the measurements by the two observers, especially in the patients, most probably because of the large number of subjects in this group. The significance of the interobserver measurement differences differed based on the implemented tagging analysis technique and studied group, with better overall measurements agreement in the patients analyzed by HARP and volunteer analyzed by SinMod.
Figure 11.
Bland-Altman analysis of left-ventricular global circumferential strain (Ecc) inter-observer variability. HARP (a,c) and SinMod (b,d) measurements are shown in patients (a,b) and volunteers (c,d).
Figure 12.
Bland-Altman analysis of left-ventricular apical-to-basal torsion interobserver variability. HARP (a,c) and SinMod (b,d) measurements are shown in patients (a,b) and volunteers (c,d).
4. Discussion
The analysis algorithms in HARP and SinMod are different. While HARP is based on analyzing the signal phase of the extracted harmonic peaks in the tagged images, SinMod is based on modeling the intensity distribution in the surrounding of each pixel as a summation of sinusoidal wavefronts. Therefore, the measurements bias encountered in this study could be attributed to the nature of k-space analysis by each technique.
Based on the ground-truth numerical phantom results, HARP and SinMod resulted in 1% and 5% strain overestimation, and 0.4 ⁰/cm and 2.0 ⁰/cm torsion overestimation, respectively. Although HARP and SinMod showed similar strain and rotation patterns for the in vivo scans and there existed consistency in the measurements by each technique, as described in the Results section, SinMod significantly overestimated the measurements compared to HARP. The percentage overestimation in torsion was always greater than that in strain, which could be attributed to the nature of torsion calculation based on the difference between basal and apical rotations, thus resulting in a smaller value, while adding errors from both rotations. Especially, errors from apical measurements may exceed those from basal slices due to the limited number of tag points in apical slices, affecting the results’ accuracy. Despite measurement differences, the results showed good correlation between HARP and SinMod measurements. It should be noted the existence of a few outlier measurements, without which the correlation coefficients between HARP and SinMod would have been much higher than reported; nevertheless, we preferred to report the results based on all analyzed data without removing any outliers in order not to provide biased conclusions.
The insignificant differences between the patients and volunteers are not unexpected in type-1 diabetes due to the patients’ young age and nature of disease progression, e.g. compared to type-2 diabetes. However, it should be noted that the pathological differences in cardiac mechanics between males and females could affect the results, which we have not investigated in this study.
The study showed good inter-observer agreement for both HARP and SinMod, with almost all measurement differences lying within the 2SD Bland-Altman difference limits, as shown in Figures 11 and 12. Further, there existed good correlation between the measurements by the two observers, especially in the patients group, most probably because of the larger number of subjects in this group compared to the volunteers group.
In a previous study [30], the SinMod technique has been compared to HARP for assessment of mid-ventricular strain, where the results showed good level of agreement for global strain measurements, although the agreement on the segmental level was substantially lower. Compared to the analysis conducted in [30], our study is different in a number of key points in terms of study design, experiments, and findings, as follows:
-
1)
One of the limitations of the study in [30] is the lack of gold standard against which both HARP and SinMod measurements could be compared. We carefully addressed this point in our study, where we conducted numerical simulations, so that the HARP and SinMod results could be compared to known ground-truth values for accurate and objective evaluation of both techniques. We conducted comprehensive numerical simulations that mimic magnetization relaxation (taglines fading), cardiac motion (myocardial deformation in different directions as well as rotation during the cardiac cycle), and other conditions (noise effect) found in actual cardiac MRI experiments.
-
2)In our study, we analyzed strain at various ventricular levels (basal, midventricular, and apical), compared to only mid-ventricular level in [30]; further, we analyzed torsion (a more complex measure of myocardial deformation) in both the patient and healthy volunteer groups. This is of particular importance due to the challenges in analyzing myocardial deformation at the basal and apical sites due to large myocardial through-plane motion in the former and limited number of tag points in the latter. In this respect, our study showed new findings not reported in [30], as follows:
- There exists systematic overestimation of both strain and torsion measurements by SinMod compared to HARP, in both numerical simulation (compared to ground truth values) and in vivo experiments.
- The disagreement in strain measurements between the two techniques increases from base to apex, with more measurements overestimation by SinMod (compared to HARP) as we move from base to apex.
- The percentage of torsion overestimation by SinMod is larger than that for strain.
- Inter-observer variability in the measurements was larger at both the basal and apical sites compared to the mid-ventricular sites.
-
3)
In our study, besides healthy volunteers, we studied 30 diabetes type-1 patients, who may develop subclinical cardiac function changes, compared to the ischemic and cardiomyopathy patients studied in [30], with the goal to detect small differences between the performances of the two techniques that could be overlooked in cardiovascular disease patients
-
4)
We conducted our study at a 3T magnetic field, compared to 1.5T in [30], as 3T is becoming more adopted for cardiac imaging, and imaging at 3T imposes more technical challenges, for example B0 inhomogeneity, that may affect image quality and the performance of the analysis techniques.
Nevertheless, it should be mentioned that study in [30] addressed other important points, which we did not repeat in our study; for example, the effect of contrast agent (gadolinium) administration on strain measurements by both techniques, as well as strain differences between different coronary supplied regions within the short-axis slice. Therefore, although the two studies share the common goal of comparing HARP and SinMod for tagging analysis, each study addresses the comparison from a different angle, where the study designs and findings are complementary in the two studies.
It should be noted that although this study focused on HARP and SinMod, the approach could be generalized to 3D tagging analysis to compensate for through-plane motion effect, which may have affected the results, especially at basal slices. Similarly, although we studied normal volunteers and diabetic patients in this study, the study design and conclusions could be extended to other patient groups.
A couple of points should be mentioned here. First, the strain value at the first timeframe is sometimes different between HARP and SinMod, which depends on the implemented algorithm and assumed frame of reference by each technique. In order to alleviate this effect in our analysis, we measured the strain difference between end-systole and end-diastole in all studied cases. Secondly, the endo- and epicardial boundaries may not be exactly the same in HARP and SinMod. While HARP depends on the operator to select points on the endo- and epicardial borders to set up the mesh that will be analyzed, SinMod typically does the segmentation automatically, which is usually correct except in a few cases where the operator can manually adjust the contours. Therefore, myocardial segmentation could be a contributing factor to the measurement differences between the two techniques.
5. Conclusions
Despite the consistency of the results by either HARP or SinMod and the acceptable agreement of the generated strain and torsion patterns by both techniques, SinMod systematically overestimated the measurements compared to HARP, which may in part be attributed to the factors discussed earlier. Nevertheless, SinMod is more automated, which would result in more reproducibility. Although each technique can be used clinically by itself and produce consistent results, under current operating conditions the measurements from HARP and SinMod cannot be used interchangeably. This is actually similar to the case when comparing other different algorithms, e.g. tissue feature tracking and conventional tagging [34]. In general, this study emphasizes the importance of not mixing measurements from different tagging analysis techniques, especially in longitudinal or multi-center studies, as the measurement differences could be related to the implemented technique, not to real differences between the studied subjects.
Acknowledgments
Funding support from NIH R01-HL-102334.
Footnotes
Conflicts of Interest
None.
Publisher's Disclaimer: This is a PDF file of an unedited manuscript that has been accepted for publication. As a service to our customers we are providing this early version of the manuscript. The manuscript will undergo copyediting, typesetting, and review of the resulting proof before it is published in its final citable form. Please note that during the production process errors may be discovered which could affect the content, and all legal disclaimers that apply to the journal pertain.
References
- [1].Ibrahim EH. Heart Mechanics: Magnetic Resonance Imaging―The Complete Guide. Boca Raton, Florida, USA: CRC Press; 2017. [Google Scholar]
- [2].Ibrahim el SH. Myocardial tagging by cardiovascular magnetic resonance: evolution of techniques--pulse sequences, analysis algorithms, and applications. Journal of cardiovascular magnetic resonance : official journal of the Society for Cardiovascular Magnetic Resonance 2011;13:36. [DOI] [PMC free article] [PubMed] [Google Scholar]
- [3].Jeung MY, Germain P, Croisille P, El ghannudi S, Roy C, Gangi A. Myocardial tagging with MR imaging: overview of normal and pathologic findings. Radiographics : a review publication of the Radiological Society of North America, Inc 2012;32(5):1381–98. [DOI] [PubMed] [Google Scholar]
- [4].Axel L, Montillo A, Kim D. Tagged magnetic resonance imaging of the heart: a survey. Medical image analysis 2005;9(4):376–93. [DOI] [PubMed] [Google Scholar]
- [5].Epstein FH. MRI of left ventricular function. J Nucl Cardiol 2007;14(5):729–44. [DOI] [PubMed] [Google Scholar]
- [6].Wang H, Amini AA. Cardiac motion and deformation recovery from MRI: a review. IEEE transactions on medical imaging 2012;31(2):487–503. [DOI] [PubMed] [Google Scholar]
- [7].Fallah-Rad N, Walker JR, Wassef A, Lytwyn M, Bohonis S, Fang T, et al. The utility of cardiac biomarkers, tissue velocity and strain imaging, and cardiac magnetic resonance imaging in predicting early left ventricular dysfunction in patients with human epidermal growth factor receptor II-positive breast cancer treated with adjuvant trastuzumab therapy. Journal of the American College of Cardiology 2011;57(22):2263–70. [DOI] [PubMed] [Google Scholar]
- [8].Mewton N, Croisille P, Revel D, Weber O, Higgins CB, Saeed M. Left ventricular postmyocardial infarction remodeling studied by combining MR-tagging with delayed MR contrast enhancement. Investigative radiology 2008;43(4):219–28. [DOI] [PubMed] [Google Scholar]
- [9].Clarysse P, Han M, Croisille P, Magnin IE. Exploratory analysis of the spatiotemporal deformation of the myocardium during systole from tagged MRI. IEEE transactions on bio-medical engineering 2002;49(11):1328–39. [DOI] [PubMed] [Google Scholar]
- [10].Axel L, Dougherty L. MR imaging of motion with spatial modulation of magnetization. Radiology 1989;171(3):841–5. [DOI] [PubMed] [Google Scholar]
- [11].Axel L, Dougherty L. Heart wall motion: improved method of spatial modulation of magnetization for MR imaging. Radiology 1989;172(2):349–50. [DOI] [PubMed] [Google Scholar]
- [12].Horn BK, Schunck BG. Determining optical flow. Artificial Intelligence 1981;17:185–203. [Google Scholar]
- [13].Lucas B, Kanade T. An iterative image registration technique with an application to stereo vision. Proceedings of the International Joint Conference on Artificial Intelligence Vancouver, British Columbia, Canada; 1981:674–9. [Google Scholar]
- [14].Fung YC. A first Course in Continuum Mechanics: For Physical and Biological Scientists and Engineers. Englewood Cliffs, NJ: Prentice Hall; 1994. [Google Scholar]
- [15].Florack LM, Niessen WJ, Nielsen M. The intrinsic structure of optic flow incorporating measurement duality. Intl J Computer Vision 1998;27:263–86. [Google Scholar]
- [16].McInerney T, Terzopoulos D. Deformable models in medical image analysis: a survey. Medical image analysis 1996;1(2):91–108. [DOI] [PubMed] [Google Scholar]
- [17].Milles J, van Susteren A, Arts T, Clarysse P, Croisille P, Magnin IE. Automatic 2D segmentation of the left ventricle in tagged cardiac MRI using motion information. Proceedings of the IEEE International Symposium on Biomedical Imaging Arlington, VA; 2004:153–6. [Google Scholar]
- [18].Wang YP, Chen Y, Amini AA. Fast LV motion estimation using subspace approximation techniques. IEEE transactions on medical imaging 2001;20(6):499–513. [DOI] [PubMed] [Google Scholar]
- [19].Amini AA, Chen Y, Curwen RW, Mani V, Sun J. Coupled B-snake grids and constrained thin-plate splines for analysis of 2-D tissue deformations from tagged MRI. IEEE transactions on medical imaging 1998;17(3):344–56. [DOI] [PubMed] [Google Scholar]
- [20].Histace A, Hermand L, Cavaro-Menard C. Tagged MR cardiac images analysis. Proceedings of the Bio Signal Brno, Czech Republic; 2002:313–5. [Google Scholar]
- [21].Kraitchman DL, Young AA, Chang CN, Axel L. Semi-automatic tracking of myocardial motion in MR tagged images. IEEE transactions on medical imaging 1995;14(3):422–33. [DOI] [PubMed] [Google Scholar]
- [22].Osman NF, Kerwin WS, McVeigh ER, Prince JL. Cardiac motion tracking using CINE harmonic phase (HARP) magnetic resonance imaging. Magnetic resonance in medicine : official journal of the Society of Magnetic Resonance in Medicine / Society of Magnetic Resonance in Medicine 1999;42(6):1048–60. [DOI] [PMC free article] [PubMed] [Google Scholar]
- [23].Osman NF, McVeigh ER, Prince JL. Imaging heart motion using harmonic phase MRI. IEEE transactions on medical imaging 2000;19(3):186–202. [DOI] [PubMed] [Google Scholar]
- [24].Osman NF, Prince JL. Visualizing myocardial function using HARP MRI. Phys Med Biol 2000;45(6):1665–82. [DOI] [PubMed] [Google Scholar]
- [25].Osman NF, Prince JL. Regenerating MR tagged images using harmonic phase (HARP) methods. IEEE transactions on bio-medical engineering 2004;51(8):1428–33. [DOI] [PubMed] [Google Scholar]
- [26].Abd-Elmoniem KZ, Sampath S, Osman NF, Prince JL. Real-time monitoring of cardiac regional function using fastHARP MRI and region-of-interest reconstruction. IEEE transactions on bio-medical engineering 2007;54(9):1650–6. [DOI] [PubMed] [Google Scholar]
- [27].Arts T, Prinzen FW, Delhaas T, Milles JR, Rossi AC, Clarysse P. Mapping displacement and deformation of the heart with local sine-wave modeling. IEEE transactions on medical imaging 2010;29(5):1114–23. [DOI] [PubMed] [Google Scholar]
- [28].Wang H, Stoeck CT, Kozerke S, Amini AA. Analysis of 3D cardiac deformations with 3D SinMod. Conference proceedings : Annual International Conference of the IEEE Engineering in Medicine and Biology Society IEEE Engineering in Medicine and Biology Society Annual Conference 2013;2013:4386–9. [DOI] [PubMed] [Google Scholar]
- [29].Clarysse P, Basset C, Khouas L, Croisille P, Friboulet D, Odet C, et al. Twodimensional spatial and temporal displacement and deformation field fitting from cardiac magnetic resonance tagging. Medical image analysis 2000;4(3):253–68. [DOI] [PubMed] [Google Scholar]
- [30].Miller CA, Borg A, Clark D, Steadman CD, McCann GP, Clarysse P, et al. Comparison of local sine wave modeling with harmonic phase analysis for the assessment of myocardial strain. Journal of magnetic resonance imaging : JMRI 2013;38(2):320–8. [DOI] [PubMed] [Google Scholar]
- [31].Zhang S, Douglas MA, Yaroslavsky L, Summers RM, Dilsizian V, Fananapazir L, et al. A Fourier based algorithm for tracking SPAMM tags in gated magnetic resonance cardiac images. Med Phys 1996;23(8):1359–69. [DOI] [PubMed] [Google Scholar]
- [32].Abd-Elmoniem KZ, Osman NF, Prince JL, Stuber M. Three-dimensional magnetic resonance myocardial motion tracking from a single image plane. Magnetic resonance in medicine : official journal of the Society of Magnetic Resonance in Medicine / Society of Magnetic Resonance in Medicine 2007;58(1):92–102. [DOI] [PubMed] [Google Scholar]
- [33].Garot J, Bluemke DA, Osman NF, Rochitte CE, McVeigh ER, Zerhouni EA, et al. Fast determination of regional myocardial strain fields from tagged cardiac images using harmonic phase MRI. Circulation 2000;101(9):981–8. [DOI] [PubMed] [Google Scholar]
- [34].Augustine D, Lewandowski AJ, Lazdam M, Rai A, Francis J, Myerson S, et al. Global and regional left ventricular myocardial deformation measures by magnetic resonance feature tracking in healthy volunteers: comparison with tagging and relevance of gender. Journal of cardiovascular magnetic resonance : official journal of the Society for Cardiovascular Magnetic Resonance 2013;15:8. [DOI] [PMC free article] [PubMed] [Google Scholar]


