

Abstract
Background–
Despite widespread use of comorbidities for population health descriptions and risk adjustment, the ideal method for ascertaining comorbidities is not known. We sought to compare the relative value of several methodologies by which comorbidities may be ascertained.
Methods–
This is an observational study of 1,596 patients admitted to the University of Chicago for community-acquired pneumonia from 1998–2012. We collected data via chart abstraction, administrative data, and patient report, then performed logistic regression analyses, specifying comorbidities as independent variables and in-hospital mortality as the dependent variable. Finally, we compared area under the curve (AUC) statistics to determine the relative ability of each method of comorbidity ascertainment to predict in-hospital mortality.
Results–
Chart review (area under curve [AUC] 0.72) and administrative data (Charlson AUC 0.83, Elixhauser AUC 0.84) predicted in-hospital mortality with greater fidelity than patient report (AUC 0.61). However, multivariate logistic regression analyses demonstrated that individual comorbidity derivation via chart review had the strongest relationship with in-hospital mortality. This is consistent with prior literature suggesting that administrative data has inherent, paradoxical biases with important implications for risk adjustment based solely on administrative data.
Conclusions–
Although comorbidities derived through administrative data did produce an AUC greater than chart review, our analyses suggest a coding bias in several comorbidities with a paradoxically protective effect. Therefore, chart review, while labor and resource intensive, may be the ideal method for ascertainment of clinically-relevant comorbidities.
Keywords: comorbidity, health services research, methodology, mortality, outcomes, outcomes research, pneumonia, research data, research design, research methodology
Introduction
Although comorbidities have been associated with deleterious outcomes, few studies have compared comorbidity identification methodologies’ ability to predict health outcomes and optimize risk adjustment.1–3 Comorbidities play a critical role in reducing confounding,4–7 along with demographic and disease severity information.8 While demographic assessment is straightforward, identifying comorbidities and judging disease severity are both complex. However, whereas disease severity metrics have generally been studied using methodologies specific to a narrow set of diagnoses,9 methodologies to ascertain the presence of comorbidities have broader application.
Comorbidities are conditions that exist prior to hospital admission, regardless of their relationship to the principal diagnosis (PD), and are often predictors of mortality, resource utilization, or risk of readmission.6 Their presence may be ascertained in several ways.10 First, ascertainment may be performed through patient report, where validated questionnaires are used to elicit prior diagnoses, a reproducible and valid method with practical advantages.11 Second, chart review may be conducted by trained personnel.4 Third, comorbidities may be identified through administrative data.6,12,13
While patient-reported information is the cornerstone of clinically-focused medical interviews, it may be less accurate for comorbidity assessment relative to chart review or administrative data.14 Some literature has suggested that chart review be considered the gold standard, despite being more resource intensive than administrative methods.11,15 Administrative data have been used extensively for conducting research and public reporting, but have limitations. For example, clinicians question the validity of administratively-designated risk adjustment methodologies because discharge diagnosis coding can be inconsistent with clinical care and accompanied by biases.16,17 Moreover, such methods have produced skepticism due to literature showing an imperfect ability to risk adjust clinically-relevant outcomes and quality of care.18 Because optimal risk adjustment is critical for outcome interpretation, hospital quality metrics, and public reporting, the method by which comorbidities are ascertained is important from both clinical and policy perspectives.19
The medical record is focused on detailing preexisting conditions with clinical relevance, while derivation of administrative data is often biased toward coding conditions causing inpatient complications or resource utilization, and toward under-reporting of chronic, uncomplicated comorbidities.15,17,20 These coding biases play a substantial role in certain paradoxical findings associated with chronic conditions.17 Administrative data also have limited ability to assess duration and severity of chronic diseases.6
Nonetheless, literature suggests that administrative data can accurately predict mortality risk.7 Administrative data models closely approximate chart review at predicting 30-day mortality rates among pneumonia patients,21 and predict outcomes with similar fidelity and generate comorbidity index scores that generally agree.22
Thus, we sought to compare comorbidity assessment methods’ ability to identify comorbidities and predict in-hospital mortality, an outcome of importance to patients, insurers, hospitals, and institutions that report quality metrics, such as the Centers for Medicare & Medicaid Services (CMS).1,23–25 CMS reports in-patient mortality through Hospital Compare, a tool created to help patients make healthcare decisions and encourage quality improvement among hospitals. Thus, these analyses will be relevant to many stakeholders.
Methods
Study Design and Population
We collected observational data on 1,596 adult patients admitted to the University of Chicago Medical Center from 1998–2012 for community-acquired pneumonia (CAP). We used a published algorithm to identify patients admitted for CAP,2,12,26–29 who had either a PD of pneumonia (International Classification of Diseases, Ninth Revision, Clinical Modification [ICD-9-CM] codes 481–486) or a PD of sepsis (codes 038, 995.92, 995.91, 785.52), aspiration (code 507.0) or respiratory failure (codes 518.81, 518.82, 518.84, 799.1) with a secondary diagnosis of pneumonia, the latter shown to be important in complete capture of CAP patients.26,27,29–31
Data Collection
We performed chart abstraction to gather demographics, vital signs, laboratory and imaging results, and to calculate the Pneumonia Severity Index (PSI) at presentation for risk stratification.32 Administrative data were also collected, including in-hospital mortality, age, sex, length of stay (LOS), and discharge diagnoses.33 Comorbidities were derived through chart abstraction, a patient questionnaire, and administrative records from the Clinical Research Data Warehouse (CRDW) maintained by the Center for Research Informatics (CRI) at the University of Chicago.
Comorbidity Assessment
Chart Review
Based on physician notes within the medical record from the hospitalization, we abstracted comorbidities, as defined by Charlson et al.4
Administrative Data
The Charlson method has been adapted to ICD-9-CM diagnosis codes, which we studied in addition to the Elixhauser method, which adds certain comorbidities associated with inpatient mortality and costs.4,6,7,34,35 These methods were operationalized as categorical variables indicating the presence/absence of each comorbidity.
Patient Report
Modeled on Charlson comorbidity designations, we used a questionnaire for ascertaining comorbidities through patient self-report with lay language modifications, based on literature demonstrating its validity and reproducibility.11
Risk Adjustment and Statistical Analysis
We performed the following analysis both without and with PSI-based risk adjustment.2,3,5,36,37 The PSI is composed of age, sex, selected comorbidities, nursing-home residence, mental status, vital signs, and laboratory and radiological findings, allowing for stratification into five risk classes associated with mortality, readmission risk, ICU use, and LOS.3
We compared patient characteristics, stratified by mortality status at discharge, using Student’s t-test and chi-square analysis for continuous and categorical variables, respectively. We compared the ability of each comorbidity assessment method to predict mortality by deriving receiver operating characteristic (ROC) curves and AUC statistics on the total sample population and the subset with self-reported comorbidities. Finally, we performed four logistic regressions specifying mortality as the dependent variable, using comorbidity designations according to each ascertainment method.
We then repeated the analysis, adjusting for disease severity by including binary categorical variables representing PSI risk class (I, II, and III constituting an aggregated reference group, creating three groups of similar sample size30,38). Although inclusion of the PSI creates the potential for collinearity given the concurrent inclusion of certain comorbid conditions that are also PSI components, we thought this pre-specified sensitivity analysis would make our findings more robust. Additionally, inclusion of the PSI allowed us to assess differential ability to capture severity and concomitantly predict risk across comorbidity ascertainment methods.
The data were analyzed using SAS software, Version 9.4 for Linux. Copyright© 2002–2012 SAS Institute Inc., Cary, NC, USA.
Results
Patient and Hospitalization Characteristics
Table 1 shows that, for 1596 pneumonia patients hospitalized between 1998 and 2012, the in-hospital mortality rate was 10.8%, the 30-day readmission rate was 10.7%, and the average LOS was 7.44 days (SD 8.4). Within the study sample, 61.5%, 14.8%, 14.5%, and 7.0% had PDs of pneumonia, respiratory failure, sepsis, and aspiration, respectively. The percentage of patients in PSI risk classes I, II, III, IV, and V were 0.1%, 16.9%, 15.3%, 36.2%, and 31.4%, respectively.
Table 1.
Patient Characteristics (N, % unless otherwise noted)
| Total (n = 1596) |
Discharged Alive (n=1385, 86.8%) |
Discharged Dead (n=173, 10.8%) |
P (Chi-Square) |
|
|---|---|---|---|---|
| Demographics | ||||
| Age in years (mean, SD) | 62.1 (19.6) | 61.5 (19.7) | 70.0 (17.9) | 0.25 |
| Sex | ||||
| Female | 889 (56.1) | 797 (57.6) | 83 (48.0) | 0.02 |
| Male | 695 (43.9) | 588 (42.5) | 90 (52.0) | |
| Race | ||||
| White | 304 (19.2) | 238 (17.2) | 56 (32.4) | <0.0001 |
| African-American | 1225 (77.3) | 1111 (80.4) | 102 (59.0) | |
| American Indian/Alaskan Native | 1 (0.1) | 0 (0.0) | 1 (0.6) | |
| Asian/Pacific Islander | 11 (0.7) | 11 (0.8) | 0 (0.0) | |
| Other | 2 (0.1) | 1 (0.1) | 0 (0.0) | |
| Unknown | 30 (1.9) | 20 (1.5) | 10 (5.8) | |
| Refused | 5 (0.3) | 1 (0.1) | 4 (2.3) | |
| Ethnicity | ||||
| Non-Hispanic | 1346 (85.0) | 1230 (88.8) | 97 (56.1) | <0.0001 |
| Hispanic | 52 (3.3) | 42 (3.0) | 10 (5.8) | |
| Unknown | 183 (11.6) | 113 (8.2) | 66 (38.2) | |
| Nursing Home Resident | 120 (7.6) | 96 (6.9) | 23 (13.3) | 0.003 |
| Clinical | ||||
| PSI Risk Class | ||||
| Class I | 1 (0.1) | 1 (0.1) | 0 (0.0) | <0.0001 |
| Class II | 268 (16.9) | 260 (18.8) | 6 (3.5) | |
| Class III | 243 (15.3) | 226 (16.3) | 12 (6.9) | |
| Class IV | 574 (36.2) | 521 (37.6) | 41 (23.7) | |
| Class V | 498 (31.4) | 377 (27.2) | 114 (65.9) | |
| Length of Stay (mean, SD) | 7.44 (8.5) | 7.18 (8.2) | 9.53 (10.3) | 0.0003 |
| 0–2 days | 374 (23.4) | 321 (23.2) | 38 (22.0) | |
| 3–4 days | 429 (26.9) | 395 (28.5) | 26 (15.0) | |
| 5–8 days | 377 (23.6) | 322 (23.3) | 46 (26.6) | |
| 9+ days | 416 (26.1) | 347 (25.1) | 63 (36.4) | |
| 30-day Readmission Status | ||||
| Not Readmitted | 1271 (79.6) | 1271 (89.3) | N/A | N/A |
| Readmitted | 152 (9.5) | 152 (10.7) | N/A | |
| Principal Diagnosis | ||||
| Pneumonia | 981 (61.5) | 942 (68.0) | 38 (22.0) | <0.0001 |
| Respiratory Failure | 236 (14.8) | 179 (12.9) | 68 (39.3) | |
| Sepsis | 231 (14.5) | 163 (11.8) | 57 (33.0) | |
| Aspiration | 111 (7.0) | 101 (7.3) | 10 (5.8) |
Study subjects were 56.1% female with a mean age of 62.1 years (SD 19.6). Mortality rates among patients with a PD of pneumonia, respiratory failure, and sepsis were 3.9%, 28.8%, and 24.7%, respectively. Patients who died in the hospital also had more severe disease (PSI class V 65.9% vs. 27.2%) and stayed in the hospital longer (LOS 9.53 vs. 7.18). They were also more likely to be males (52.0% vs. 42.3%) and nursing home residents (13.3% vs. 6.9%).
Comorbidity Ascertainment Methodologies
Comparing our total sample of 903 patients with chart review to the 1596 with only patient reported and administrative data, the prevalence of comorbidities (Table 2) was, with two exceptions, similar across ascertainment methodologies, with consistency to within 15 absolute percentage points (e.g. pulmonary disease was identified in 34.2 – 40.7% of patients across methods). However, while 48.3% of patients reported a rheumatologic disease, only 14.4%, 4.5%, and 4.6% of patients had a rheumatologic disease according to chart review, Charlson administrative, and Elixhauser administrative methods, respectively. Also, while 25.2% of patients reported depression, the Elixhauser administrative method identified this comorbidity in only 6.8% of patients.
Table 2.
Prevalence of Patient Comorbidities, by Collection Method.
| Comorbidity* | Patient Reported (n=903) | Chart Review (n=1596) | Charlson Administrative (n=1596) | Elixhauser Administrative (n=1596) |
|---|---|---|---|---|
| Alcohol Abuse | - | - | - | 87 (5.5) |
| Anemia | 185 (20.4) | - | - | 394 (24.7) |
| Back Problems | 319 (35.3) | - | - | - |
| Cancer | 115 (12.7) | 258 (16.2) | 137 (8.6) | 108 (6.8) |
| Cerebrovascular Disease/Stroke | 146 (16.2) | 218 (13.7) | 102 (6.4) | - |
| Coagulopathy | - | - | - | 117 (7.3) |
| Dementia | - | 136 (8.5) | 96 (6.0) | - |
| Depression | 228 (25.2) | - | - | 109 (6.8) |
| Diabetes | 256 (28.3) | 479 (30.0) | 351 (22.0) | 353 (22.1) |
| Digestive problems | 168 (18.6) | - | - | - |
| IBD | - | 10 (0.6) | - | - |
| Peptic Ulcer Disease | - | 46 (2.9) | 28 (1.8) | 1 (0.1) |
| Non-PUD GI Bleed | - | 76 (4.8) | - | - |
| Drug Abuse | - | - | - | 114 (7.1) |
| Fluid and Electrolyte Disorders | - | - | - | 588 (36.8) |
| Heart Disease | 323 (35.8) | - | - | - |
| Angina/MI | - | 219 (13.7) | 115 (7.2) | - |
| Arrhythmia | - | 308 (19.3) | - | - |
| CHF | - | 325 (20.4) | 388 (24.3) | 378 (23.7) |
| Valvular Disease | - | 79 (4.9) | - | 91 (5.7) |
| HIV/AIDS | 73 (8.1) | 44 (2.8) | - | 17 (1.1) |
| Hypertension | 500 (55.4) | 880 (55.1) | - | 704 (44.1) |
| Hypothyroidism | - | - | - | 101 (6.3) |
| Liver Disease | 77 (8.5) | 74 (4.6) | 59 (3.7) | 37 (2.3) |
| Obesity | - | - | - | 103 (6.5) |
| Other Neurologic Condition | - | 127 (8.0) | - | 83 (5.2) |
| Paralysis/Paraplegia/Hemiplegia | - | 1 (0.1) | 18 (1.1) | 47 (2.9) |
| Peripheral Vascular Disease | - | 171 (10.7) | 92 (5.8) | 94 (5.9) |
| Psychoses | - | - | - | 33 (2.1) |
| Pulmonary Disease | 346 (38.3) | 645 (40.4) | 583 (36.5) | 545 (34.1) |
| Pulmonary Circulation Disease | - | - | - | 126 (7.9) |
| Renal Disease/Failure | 142 (15.7) | 488 (30.6) | 254 (15.9) | 244 (15.3) |
| Rheumatologic Disease | 436 (48.3) | 230 (14.4) | 72 (4.5) | 74 (4.6) |
| Weight Loss | - | - | - | 83 (5.2) |
Data are given as no. (%).
for ease of comparison, categories have been merged when possible (i.e. diabetes merged with diabetes with complications); see Appendix A for full category details
Table 3 shows that, for the 903 patients for whom we had self-report data, the Charlson and Elixhauser methods based on administrative data resulted in similar fidelities, with AUCs of 0.83 and 0.84, respectively. Chart review and patient report performed inferiorly, with AUCs of 0.72 and 0.61, respectively. Table 3 also shows that, for the total sample of 1596 patients, the Elixhauser administrative method revealed an AUC of 0.80, compared to chart review (0.71) and Charlson administrative (0.70) methods. After PSI risk adjustment, the AUC of patient report and chart review increased ~10% to 0.68 and 0.79, respectively, while the AUC of the Charlson and Elixhauser increased ~13.5% to 0.79 and ~5% to 0.85, respectively. As such, Elixhauser’s superiority decreased, but was not eliminated.
Table 3.
Comorbidity-Explained Variation in In-Hospital Mortality, by Comorbidity Collection Method. N = 903 group due to limited number of cases in “self”/patient report group. N = 1596 group excluding patient report.
| Methodology | AUC in 903 patient sample for whom self report was collected | AUC for the total sample of 1596 patients |
|---|---|---|
| Self report | 0.61 | N/A |
| Chart review | 0.72 | 0.71 |
| Charlson administrative | 0.83 | 0.70 |
| Elixhauser administrative | 0.84 | 0.80 |
Individual Comorbidities
Figure 1 shows that, based on logistic regression models, no comorbidities collected via patient report exhibited a significant association with in-hospital mortality (PSI Unadjusted section of Appendix A). For chart review, myocardial infarction, arrhythmia, renal disease, lymphoma, and solid tumor were associated with increased mortality risk, while hypertension, diabetes, and rheumatologic disease were associated with a decreased risk. With the Charlson administrative method, peripheral vascular disease, pulmonary disease, rheumatologic disease, and diabetes without complications were associated with decreased mortality risk. Finally, based on the Elixhauser administrative method, coagulation disorders correlated with an increased risk of in-hospital mortality, while pulmonary disease, arthritis, anemia, drug abuse, depression, and hypertension correlated with a decreased risk.
Figure 1.
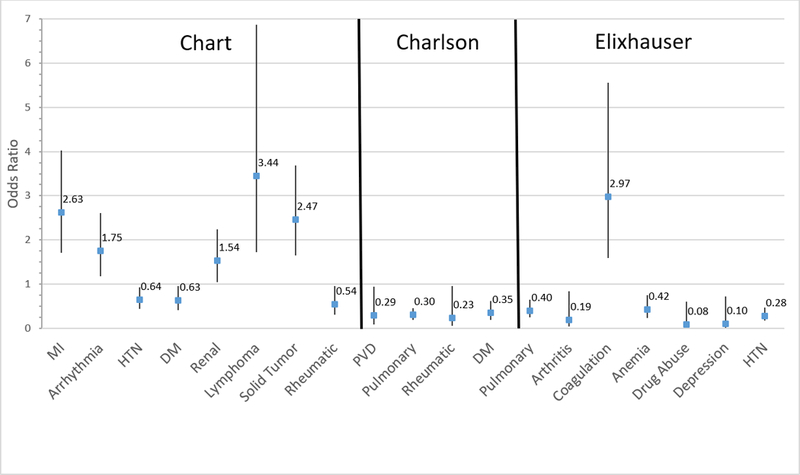
Individual Comorbidities (by Ascertainment Method) Significantly Associated with In-Hospital Mortality. MI: myocardial infarction; HTN: hypertension; DM: diabetes mellitus; Renal: renal disease; Lymphoma: lymphoma/leukemia; Rheumatic: rheumatologic disease; PVD: peripheral vascular disease; Pulmonary: chronic pulmonary disease; Coagulation: coagulation disorder.
Including the PSI risk class as a covariate, the results were nearly identical (PSI Adjusted section of Appendix A). However, with the chart review method, the direct relationship between a history of arrhythmia or renal disease and mortality was eliminated, while a direct relationship between PSI risk classes IV/V and mortality emerged. Likewise, rheumatologic disease was no longer associated with a significantly decreased risk of mortality, while an inverse relationship with mortality emerged for CHF and PVD.
Discussion
Our results show that comorbidities ascertained through administrative data are similarly able to predict in-hospital mortality compared to chart review, the gold standard according to current literature.11 However, despite rigorously-derived associations between comorbidities and mortality in literature based on administrative data,6 we found that comorbidities derived from chart review had the strongest associations with mortality. While five comorbidities associated with increased mortality came from chart review, just one came from Elixhauser administrative data and zero came from Charlson and patient report. Thus, our findings supports literature suggesting comorbidities unrelated to the PD are under-reported based on administrative data relative to chart review.15,17,20,26 Additionally, our results are consistent with literature showing that under-reporting in administrative data produces greater effects on individual comorbidities than overall predictive ability.22
Reporting bias is likely the reason that several comorbidities derived from administrative data exhibit a paradoxically protective effect, consistent with previous literature suggesting these comorbidities are only coded among patients who do not have more serious illnesses.15,17,20,26 In addition, three comorbidities obtained via chart review exhibited a similar association with reduced risk of mortality, suggesting that literature on reporting biases in administratively-sourced data extends to the medical chart.17
While changes in observed associations between comorbidities and mortality risk were minimal with inclusion of PSI risk class as a covariate, some of these changes are the result of collinearity. For example, the clinical importance of malignancy, CHF, and renal disease resulted in their inclusion in the PSI, and the strength of their association with mortality decreased with the inclusion of the PSI (Appendix A). For renal failure, collinearity even caused its direct relationship with mortality to become non-significant in the chart review method. Still, some changes after adjustment are notable, such as no longer observing an inverse relationship between rheumatologic disease and mortality, suggesting that risk adjustment can minimize the impact of reporting biases. Regardless, the overall trends remain extremely similar (see AUC discussion above and Appendix A).
One of this study’s most notable findings is the differing results from the ROC/AUC analysis and the logistic regression results (comparing Table 3 to Figure 1/Appendix A), which has several possible explanations. First, patients who did not respond to the inpatient questionnaire were likely sicker than the total sample. Second, the greater AUC based on Elixhauser relative to chart review is explained, at least in part, by the inclusion of additional comorbidities. In contrast, the regression results, showing a relationship between high-risk comorbidity conditions and greater mortality risk, are consistent with clinical intuition.
The number of comorbid conditions ascertained by a particular method correlated with the AUC statistic derived from that method. The number of comorbidity categories for patient report, Charlson, chart review, and Elixhauser was 14, 17, 21, and 29, respectively, directly corresponding with their AUC values (Appendix A and Table 3). The predictive value added by additional comorbidity categories overcomes decreases in the statistical significance of individual components. For example, despite chart review evidencing the greatest number of individual comorbidities with significant associations related to in-hospital mortality, its aggregated formulation does not produce an incremental value of mortality risk. At the same time, it remains unclear whether these differences are due to the number of comorbidity categories or differential inclusion of individual comorbidities. For instance, only the Elixhauser method contains psychiatric comorbid conditions such as depression and drug abuse, both known to have coding associations and clinical relationships with mortality39 and found be significantly associated with mortality in this study (Figure 1). Our findings should be replicated and investigated in other patient populations or using alternative outcomes.
This study has several limitations. First, the comparisons between information derived from self-report and the other methods of comorbidity ascertainment are limited by a degree of selection bias because more severely ill patients are more likely to be cognitively impaired. The 903 patients who completed the intake questionnaire serving as the source of self-report data were different from the 1596 patients in the total study population in that they were healthy enough and had sufficient health literacy to pass the mental status test necessary to validate the results of this intake survey. In contrast, data obtained through chart review or administrative sources was not dependent on enrollment in the questionnaire study, nor patient condition, mental status, or health literacy.
In addition, a degree of caution must be exerted in comparative interpretation of AUC values, which exhibit a correlation with the number of comorbidities ascertained, the greatest value being achieved through the Elixhauser administrative method.40 Furthermore, because this analysis is based on patients hospitalized for a specific diagnosis, the extent to which the results may be extrapolated to other patient populations cannot be known with certainty. We studied a diverse patient population and were able to create a comprehensive dataset allowing for rigorous risk adjustment using the full PSI and direct validation of administrative data against the medical record. However, our study is limited in that it was conducted at a single institution, and therefore may not be representative of other patient populations in geographic areas with different racial compositions and social circumstances. Additionally, the CRDW data do not include information from outside providers or hospitals and is not inclusive of multiple episodes of care, as it is limited in scope to a single hospitalization.
Despite these caveats, we believe this study makes important contributions to existing literature on comorbidity ascertainment methodologies. Accurately establishing patients’ comorbidity profiles is critical for patients, entities engaged in public reporting, and health care providers. In conclusion, we hope our data-driven comparisons serve as a valuable contribution in expanding evidence-based methods for optimization of risk adjustment.
Supplementary Material
Acknowledgements
Administrative records from the Clinical Research Data Warehouse (CRDW), maintained by the Center for Research Informatics (CRI) at the University of Chicago. CRI is funded by the Biological Sciences Division’s Institute for Translational Medicine/CTSA (NIH UL1 TR000430). Supported by the National Cancer Institute (research and training grant KM1 CA156717), the University of Chicago Pritzker School of Medicine’s Summer Research and Scholarship & Discovery Programs, the Agency for Healthcare Research and Quality (grant RO1 HS10597 AHRQ). The content of this publication is solely the responsibility of the authors and does not necessarily represent the views of the National Cancer Institute or the Agency for Healthcare Research and Quality.
Footnotes
Disclosure of potential conflicts of interest for all authors for the past three years, including an explicit statement that no potential conflicts exist when that is the case: No conflicts of interest.
References
- 1.Kansagara D, Englander H, Salanitro A, Al E. Risk prediction models for hospital readmission: A systematic review. JAMA. 2011;306(15):1688–1698. [DOI] [PMC free article] [PubMed] [Google Scholar]
- 2.Aujesky D, Auble TE, Yealy DM, et al. Prospective comparison of three validated prediction rules for prognosis in community-acquired pneumonia. Am J Med. 2005;118(4):384–392. [DOI] [PubMed] [Google Scholar]
- 3.Fine MJ, Auble TE, Yealy DM, et al. A prediction rule to identify low-risk patients with community-acquired pneumonia. N Engl J Med. 1997;336(4):243–250. [DOI] [PubMed] [Google Scholar]
- 4.Charlson ME, Pompei P, Ales KL, MacKenzie CR. A new method of classifying prognostic comorbidity in longitudinal studies: Development and validation. J Chronic Dis. 1987;40(5):373–383. [DOI] [PubMed] [Google Scholar]
- 5.Iezzoni LI. Assessing quality using administrative data. Ann Intern Med. 1997;127(8 Pt 2):666–674. [DOI] [PubMed] [Google Scholar]
- 6.Elixhauser A, Steiner C, Harris DR, Coffey RM. Comorbidity Measures for Use with Administrative Data. Med Care. 1998;36(1):8–27. [DOI] [PubMed] [Google Scholar]
- 7.Li P, Kim MM, Doshi JA. Comparison of the performance of the CMS Hierarchical Condition Category (CMS-HCC) risk adjuster with the Charlson and Elixhauser comorbidity measures in predicting mortality. BMC Health Serv Res. 2010;10:245. [DOI] [PMC free article] [PubMed] [Google Scholar]
- 8.NQF. Risk Adjustment for Socioeconomic Status or Other Sociodemographic Factors.; 2014.
- 9.Lim WS, van der Eerden MM, Laing R, et al. Defining community acquired pneumonia severity on presentation to hospital: an international derivation and validation study. Thorax. 2003;58(5):377–382. [DOI] [PMC free article] [PubMed] [Google Scholar]
- 10.Valderas JM, Starfield B, Sibbald B, Salisbury C, Roland M. Defining Comorbidity: Implications for Understanding Health and Health Services. Ann Fam Med. 2009;7(4):357–363. [DOI] [PMC free article] [PubMed] [Google Scholar]
- 11.Katz JN, Chang LC, Sangha O, Fossel AH, Bates DW. Can comorbidity be measured by questionnaire rather than medical record review? Med Care. 1996;34(1):73–84. [DOI] [PubMed] [Google Scholar]
- 12.Whittle J, Fine MJ, Joyce DZ, et al. Community-acquired pneumonia: can it be defined with claims data? Am J Med Qual. 1997;12(4):187–193. [DOI] [PubMed] [Google Scholar]
- 13.Krumholz HM, Wang Y, Mattera JA, et al. An administrative claims model suitable for profiling hospital performance based on 30-day mortality rates among patients with an acute myocardial infarction. Circulation. 2006;113(13):1683–1692. [DOI] [PubMed] [Google Scholar]
- 14.Preen DB, Holman CDAJ, Lawrence DM, Baynham NJ, Semmens JB. Hospital chart review provided more accurate comorbidity information than data from a general practitioner survey or an administrative database. J Clin Epidemiol. 2004;57(12):1295–1304. [DOI] [PubMed] [Google Scholar]
- 15.Fleming ST, Sabatino S a, Kimmick G, et al. Developing a claim-based version of the ACE-27 comorbidity index: a comparison with medical record review. Med Care. 2011;49(8):752–760. [DOI] [PubMed] [Google Scholar]
- 16.Laine C Coming to Grips with Large Databases. Ann Intern Med. 1997;127(8):645–647. [DOI] [PubMed] [Google Scholar]
- 17.Iezzoni LI, Foley SM, Daley J, Hughes J, Fisher ES, Heeren T. Comorbidities, complications, and coding bias. Does the number of diagnosis codes matter in predicting in-hospital mortality? Jama. 1992;267(16):2197–2203. [DOI] [PubMed] [Google Scholar]
- 18.Localio AR, Hamory BH, Sharp TJ, Weaver SL, TenHave TR, Landis JR. Comparing hospital mortality in adult patients with pneumonia. A case study of statistical methods in a managed care program. Ann Intern Med. 1995;122(2):125–132. [DOI] [PubMed] [Google Scholar]
- 19.Iezzoni LI. The Risks of Risk Adjustment. J Am Med Assoc. 1997;278(19):1600–1607. [DOI] [PubMed] [Google Scholar]
- 20.Chong WF, Ding YY, Heng BH. A comparison of comorbidities obtained from hospital administrative data and medical charts in older patients with pneumonia. BMC Health Serv Res. 2011;11(1):105. [DOI] [PMC free article] [PubMed] [Google Scholar]
- 21.Bratzler DW, Normand S-LT, Wang Y, et al. An Administrative Claims Model for Profiling Hospital 30-Day Mortality Rates for Pneumonia Patients. Morty RE, ed. PLoS One. 2011;6(4):e17401. [DOI] [PMC free article] [PubMed] [Google Scholar]
- 22.Quan H, Parsons GA, Ghali WA. Validity of information on comorbidity derived rom ICD-9-CCM administrative data. Med Care. 2002;40(8):675–685. [DOI] [PubMed] [Google Scholar]
- 23.Ruhnke GW, Coca-Perraillon M, Kitch BT, Cutler DM. Marked reduction in 30-day mortality among elderly patients with community-acquired pneumonia. Am J Med. 2011;124(2):171–178.e1. [DOI] [PMC free article] [PubMed] [Google Scholar]
- 24.Fry AM, Shay DK, Holman RC, Curns AT, Anderson LJ. Trends in Hospitalizations for Pneumonia Among Persons Aged 65 Years or Older in the United States, 1988–2002. 2005;294(21):2712–2719. [DOI] [PubMed] [Google Scholar]
- 25.Fine JM, Fine MJ, Galusha D, Petrillo M, Meehan TP. Patient and hospital characteristics associated with recommended processes of care for elderly patients hospitalized with pneumonia: results from the medicare quality indicator system pneumonia module. Arch Intern Med. 2002;162(7):827–833. [DOI] [PubMed] [Google Scholar]
- 26.Ruhnke GW, Coca Perraillon M, Cutler DM. Mortality reduction among pneumonia patients still substantial despite the impact of coding changes. Am J Med. 2013;126(3):266–269. [DOI] [PubMed] [Google Scholar]
- 27.Lindenauer PK, Lagu T, Shieh M-S, Pekow PS, Rothberg MB. Association of diagnostic coding with trends in hospitalizations and mortality of patients with pneumonia, 2003–2009. JAMA. 2012;307(13):1405–1413. [DOI] [PubMed] [Google Scholar]
- 28.Auerbach AD, Kripalani S, Vasilevskis EE, et al. Preventability and Causes of Readmissions in a National Cohort of General Medicine Patients . JAMA Intern Med. 2016;176(4):484–493. [DOI] [PMC free article] [PubMed] [Google Scholar]
- 29.Ruhnke GW, Coca-Perraillon M, Kitch BT, Cutler DM. Trends in Mortality and Medical Spending in Patients Hospitalized for Community-Acquired Pneumonia: 1993 – 2005. Med Care. 2010;48(12):1111–1116. [DOI] [PMC free article] [PubMed] [Google Scholar]
- 30.Vohra AS, Tak HJ, Shah MB, Meltzer DO, Ruhnke GW. Intensive Care Unit Admission With Community-Acquired Pneumonia. Am J Med Sci. 2015;350(5):380–386. [DOI] [PubMed] [Google Scholar]
- 31.Yu O, Nelson JC, Bounds L, Jackson LA. Classification algorithms to improve the accuracy of identifying patients hospitalized with community-acquired pneumonia using administrative data. Epidemiol Infect. 2011;139(9):1296–1306. [DOI] [PubMed] [Google Scholar]
- 32.Iezzoni LI, Foley SM, Daley J, Hughes J, Fisher ES, Heeren T. Comorbidities, complications, and coding bias. Does the number of diagnosis codes matter in predicting in-hospital mortality? JAMA. 1992;267(16):2197–2203. [DOI] [PubMed] [Google Scholar]
- 33.Virnig BA, McBean M. Administrative data for public health surveillance and planning. Annu Rev Public Health. 2001;22:213–230. doi: 10.1146/annurev.publhealth.22.1.213. [DOI] [PubMed] [Google Scholar]
- 34.Deyo RA, Cherkin DC, Ciol MA. Adapting a clinical comorbidity index for use with ICD-9-CM administrative databases. J Clin Epidemiol. 1992;45(6):613–619. [DOI] [PubMed] [Google Scholar]
- 35.Romano PS, Roos LL, Jollis JG. Adapting a clinical comorbidity index for use with ICD-9-CM administrative data: differing perspectives. J Clin Epidemiol. 1993;46(10):1075–1090. [DOI] [PubMed] [Google Scholar]
- 36.Mitchell JB, Bubolz T, Paul JE, et al. Using Medicare claims for outcomes research. Med Care. 1994;32(7 Suppl): JS38–51. [PubMed] [Google Scholar]
- 37.Preen DB, Holman CDJ, Lawrence DM, Baynham NJ, Semmens JB. Hospital chart review provided more accurate comorbidity information than data from a general practitioner survey or an administrative database. J Clin Epidemiol. 2004;57(12):1295–1304. [DOI] [PubMed] [Google Scholar]
- 38.Restrepo MI, Mortensen EM, Velez JA, Frei C, Anzueto A. A comparative study of community-acquired pneumonia patients admitted to the ward and the ICU. Chest. 2008;133(3):610–617. [DOI] [PubMed] [Google Scholar]
- 39.Vaughan-Sarrazin MS, Lu X, Cram P. The impact of paradoxical comorbidities on risk-adjusted mortality of Medicare beneficiaries with cardiovascular disease. Medicare Medicaid Res Rev. 2011;1(3):001.03.a02. [DOI] [PMC free article] [PubMed] [Google Scholar]
- 40.Baker SG, Schuit E, Steyerberg EW, et al. How to interpret a small increase in AUC with an additional risk prediction marker: Decision analysis comes through. Statistics in Medicine. 2014;33(22):3946–3959. [DOI] [PMC free article] [PubMed] [Google Scholar]
Associated Data
This section collects any data citations, data availability statements, or supplementary materials included in this article.