

Abstract
Purpose
Infants admitted to a level IV neonatal intensive care unit (NICU) who do not survive early childhood represent a population likely enriched for rare genetic disease; we therefore characterized their genetic diagnostic evaluation.
Methods
This is a retrospective analysis of infants admitted to our NICU between January 1, 2011 and December 31, 2015 who were deceased at the time of records review with an age at death of less than five years.
Results
2,670 infants were admitted; 170 later died. 106/170 (62%) had an evaluation for a genetic or metabolic disorder. 47/170 (28%) had laboratory-confirmed genetic diagnoses made, though 14/47 (30%) diagnoses were made postmortem. Infants who were evaluated for a genetic disorder spent more time in the NICU (median 13.5 vs. 5.0 days, p = 0.003), were older at death (median 92.0 vs. 17.5 days p < 0.001), and had similarly-high rates of redirection of care (86% vs. 79%, p = 0.28).
Conclusion
Genetic disorders were suspected in many infants but found in a minority. Approximately one-third of diagnosed infants died prior to a laboratory-confirmed genetic diagnosis being made. This highlights the need to improve the genetic diagnostic evaluation in the NICU, particularly to aid in end-of-life decision-making.
Keywords: genetic diagnosis, mortality, infancy, diagnostic odyssey, neonatal intensive care unit
INTRODUCTION
Infants admitted to a level IV neonatal intensive care unit (NICU) often have rare genetic disorders; these infants contribute considerably to mortality both in the NICU1–5 and in early childhood6,7. The term “genetic disorders” is broad and in this context refers to chromosomal abnormalities, such as aneuploidy syndromes or chromosomal deletion or duplication disorders, in addition to Mendelian disorders, such as inborn errors of metabolism, which also contribute to NICU admissions and mortality8. Additionally, congenital malformations, affecting approximately 2% of live births9, are responsible for a large proportion of NICU admissions3,4 and are the leading cause of infant mortality in the United States10, though the underlying etiology of these malformations may not be genetic, as seen in diabetic embryopathy or in utero exposure to known teratogens such as phenytoin. Regardless, infants with genetic disorders and congenital malformations indicating a possible genetic syndrome not only comprise a substantial proportion of NICU admissions, but disproportionately contribute to neonatal mortality, responsible for about 30–50% of neonatal and infant deaths1,3,4,11,12.
Infants admitted to the NICU who do not survive early childhood therefore represent a population that is likely enriched for genetic disease. The process of arriving at a genetic diagnosis has been termed the “diagnostic odyssey”, and the traditional diagnostic genetic evaluation has been previously shown to have a yield of approximately 46% and took an average of seven to eight months for children and adults evaluated in an outpatient genetics clinic. However, for laboratory-confirmed (molecular) genetic diagnoses, this yield dropped to 27%13. Rapid whole genome sequencing in critically-ill newborns and infants has been demonstrated to have a diagnostic yield as high as 50–70%14–17 in a research setting, and a recent retrospective analysis found a diagnostic yield of 36.7% using clinical whole exome sequencing18. There is a paucity of information regarding the traditional genetic diagnostic evaluation in the NICU, with one prior study showing a diagnostic yield of 26% for infants who had their initial genetic consultation while in the NICU, though most were diagnosed after NICU discharge19. However, NICU infants, particularly non-survivors, could benefit immensely from an expeditious genetic diagnosis. It has been shown that finding a genetic diagnosis can aid in the clinical management of critically-ill infants or can lead to the decision to redirect care in the setting of a poor prognosis16,19, which is of particular importance in the NICU as prior studies have shown that the majority of deaths occur under these circumstances1,3,20. We therefore investigated how many of these NICU infants who died before five years of age had a genetic diagnosis made and analyzed the genetic diagnostic evaluation in this population.
MATERIALS AND METHODS
Study Population
This is a retrospective analysis of the electronic medical records of patients first admitted to the level IV NICU at our institution between January 1, 2011 and December 31, 2015 who were deceased at the time of records review with an age at death of less than five years. The Boston Children’s Hospital Institutional Review Board approved this study with a waiver of informed consent due to the nature of the study.
Deceased patients were identified by reviewing the list of admissions from this time period and including patients whose status in our electronic medical record was recorded as “deceased” as of November 28, 2017 and whose age at the time of death was less than five years. All deaths occurring within our institution would be captured by this method, as would deaths occurring outside of our institution provided the information is returned so that the medical record can be updated accordingly.
Data Collection and Analysis
Study data were collected and managed using REDCap (Research Electronic Data Capture) hosted at Boston Children’s Hospital21. For further details, please see the Supplementary Methods.
For each patient, we recorded whether or not a genetics or metabolism consultation was obtained at our institution. If yes, information on the date, location and indication for consultation was obtained. We reviewed all genetic testing results and recorded the type of genetic test in addition to the result, the date the specimen was received by the lab, and the date of the report containing the results. We did include tests sent at outside hospitals using the information available in our electronic medical record. Gene tests that were ordered as a panel but that resulted separately were entered as individual gene tests as the turnaround time may vary by gene. We determined whether or not a laboratory-confirmed molecular or cytogenetic diagnosis was made based on these test results. Patients were considered to have a laboratory-confirmed genetic diagnosis if they had a pathogenic or likely pathogenic variant found on a genetic test that explained the patient’s presentation. For cases in which two variants were found in a single gene associated with an autosomal recessive disorder, but parental testing was not available to determine whether the variants were in cis or trans, or if one of the two variants was a variant of uncertain significance (VUS) present in combination with a pathogenic or likely pathogenic variant, these variants were also considered to be disease-causing if the phenotype matched appropriately. If the diagnostic status was unclear from the test report alone, the medical notes were reviewed to find the opinion of the treating physician. For patients with laboratory-confirmed genetic diagnoses, we reviewed the clinical notes preceding the date of this diagnosis to determine if a clinical diagnosis had been made prior to the molecular or cytogenetic result; patients were determined to have a clinical diagnosis if the provider had documented that the patient had a specific condition. A clinical diagnosis was not considered made if the provider documented being highly suspicious for a particular disorder but other conditions were also on the differential or if testing for other conditions was being sent concurrently.
Statistical analysis was performed using SPSS (version 23.0, IBM Corp, Armonk, NY), using descriptive and Chi-square analyses and the Mann-Whitney U Test and a 2-sided Fisher’s exact test to compare variables when appropriate.
RESULTS
Characteristics of the Study Population
Over the five-year period, 2670 infants were admitted to the NICU and 170 of them later died; 102/170 (60%) were male and 68/170 (40%) were female. 149/170 (88%) died before one year of age. Additional characteristics of these infants are provided in Table 1 and causes of death are displayed in Figure 1. Death occurred after redirection of the goals of care for 137/164 infants (84%) and life support was withdrawn for 116/153 infants (76%) for whom data were available. Autopsy was performed with results available in our records for 61/170 infants (36%). After the initial admission, 93 infants (55%) died in the NICU, while 12 (7%) were discharged home, 48 (28%) were transferred to another unit of the hospital, and 17 (10%) were transferred to another hospital for further care.
Table 1.
Characteristics of infants admitted to the NICU who later died.
| Age at NICU Admission, days |
Median (Q1–Q3) | Minimum, Maximum | ||||
|---|---|---|---|---|---|---|
| 7.0 (1.0–30.0) | 0.0, 232.0 | |||||
|
| ||||||
| Gestational Age, weeks | Gestational Age Category, weeks | N (%) | ||||
|
| ||||||
| 37 – 41 | 76/170 (45) | |||||
| <37 | 94/170 (55) | |||||
| 32–37 | 39/170 (23) | |||||
| 28–32 | 22/170 (13) | |||||
| <28 | 33/170 (19) | |||||
|
| ||||||
| Primary Admission Diagnosis | N (%) | |||||
|
| ||||||
| Multiple congenital anomalies | 27/170 (17) | |||||
| Acquired gastrointestinal disease | 20/170 (12) | |||||
| Perinatal depression/birth asphyxia | 17/170 (10) | |||||
| Congenital heart defect | 21/170 (12) | |||||
| Prematurity | 12/170 (7) | |||||
| Neurologic disorder | 10/170 (6) | |||||
| Metabolic disorder | 8/170 (5) | |||||
| Renal disorder | 9/170 (5) | |||||
| Pulmonary hypertension | 8/170 (5) | |||||
| Acquired respiratory disorder | 6/170 (4) | |||||
| Gastrointestinal malformation | 7/170 (4) | |||||
| Genetic syndrome | 5/170 (3) | |||||
| Infection | 5/170 (3) | |||||
| Congenital hematologic/oncologic disorder | 5/170 (3) | |||||
| Other congenital disordersa | 5/170 (3) | |||||
| Apparent life-threatening event or arrest at home | 3/170 (2) | |||||
|
| ||||||
| Total NICU days | Median (Q1–Q3) | Minimum, Maximum | ||||
|
| ||||||
| 9.0 (2.0–28.0) | 0.0, 261.0 | |||||
|
| ||||||
| Age at Death, days | Median (Q1–Q3) | Minimum, Maximum | ||||
|
| ||||||
| 48.0 (12.8–168.0) | 0.0, 1660.0 | |||||
|
| ||||||
| Location of Death | N (%) | |||||
|
| ||||||
| Home | 13/170 (8) | |||||
| NICU | 101/170 (59) | |||||
| Other unit/floor in the hospital | 41/170 (24) | |||||
| Otherb/Unknown | 15/170 (9) | |||||
congenital airway/pulmonary disorder (2), congenital dermatologic disorder (2), vein of Galen malformation (1)
en route to the hospital or at an outside hospital
Figure 1. The genetic or metabolic evaluation and causes of death.
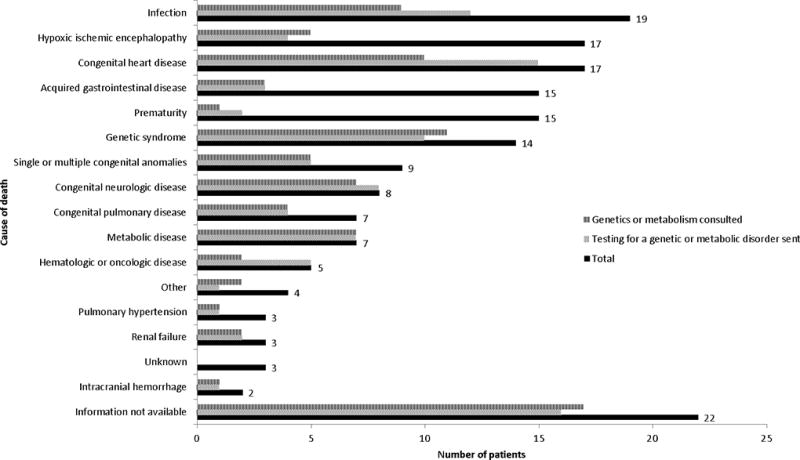
“Other” includes four infants who died during or from complications of a medical procedure.
Evaluation for a Genetic or Metabolic Disorder
The genetics or metabolism service was consulted for 87/170 (51%) of patients who died, with multiple congenital anomalies being the most common indication for consultation (46/87, 53%), followed by a suspected metabolic disorder (18/87, 21%), known genetic syndrome (10/87, 12%), neurologic disorder (5/87, 6%), single congenital malformation (4/87, 5%), hematologic/oncologic disorder (2/87, 2%), and pulmonary hypertension (2/87, 2%). The median age at first genetics or metabolism consultation (by our institution) was 10.0 days (Q1–Q3 3.0–40.0, range 0.0–783.0 days) and 72/87 (83%) had this consultation performed before or on the day of the first NICU discharge. All but four patients had the initial consultation at our hospital while inpatient, and two of the four who had the initial consultation performed as an outpatient clinic visit subsequently had inpatient consultations at our institution. In contrast, 634/2670 infants admitted to the NICU (24%) overall had a genetics or metabolism consultation or clinic visit in their first five years of life.
At least one postnatal test for a genetic or metabolic condition was performed for 96/170 (57%) of these patients, including cytogenetic and molecular genetic tests (Table 2) in addition to biochemical testing for a metabolic condition, enzyme analysis, and tissue biopsies. Three had testing for somatic variants causing malignancy. Six patients had only biochemical testing for a metabolic condition (e.g. plasma amino acids, urine organic acids) performed and one had only a biopsy performed for a genetic condition (junctional epidermolysis bullosa). The 87 patients who had cytogenetic or molecular genetic testing (Table 2) had a total of 257 tests sent with a median of 2 tests per patient (Q1–Q3 1–4, range 1–12 tests). Fluorescence in situ hybridization (FISH) testing had the shortest turnaround time, and whole exome or genome sequencing (WES/WGS) had the longest. The highest rates of variants of unknown significance were seen in gene panels, mitochondrial gene sequencing, and whole exome or genome sequencing tests. The age at test result generally increased with advancing test complexity or specialization (Table 2). At least one biochemical test (e.g. plasma amino acids, urine organic acids) was sent for 41 patients. The most common single gene tested was CHD7 (four patients). Clinical WES/WGS was performed for seven patients and resulted in a molecular genetic diagnosis in three (43%). 10/87 (11%) patients who had a genetics or metabolism consultation at our institution did not have testing for a genetic or metabolic disorder sent, and 19/96 (20%) of patients who had a test sent for a genetic or metabolic disorder did not have a genetics or metabolism consultation at our hospital.
Table 2.
Usage, turnaround time, age at test result, and yield of diagnostic genetic testing.
| Genetic Test | Patientsa | Tests | Turnaround Timeb, days |
Age at Test Result, days |
Resultc N (%) |
|---|---|---|---|---|---|
| Median (Q1–Q3), N |
|||||
| Karyotyped | 30 | 30 | 5.0 (4.0–10.5), 9 | 10.0 (6.3–21.3), 20 | Positive: 6/30 (20) |
| Negative:18/30 (60) | |||||
| VUS: 2/30 (7) | |||||
| None: 6/30 (20) | |||||
| Fluorescence in situ hybridization | 8 | 9 | 3.0 (min-max 1.0–8.0), 3 | 10.0 (5.3–227.8), 4 | Positive: 2/9 (22) |
| Negative: 4/9 (44) | |||||
| VUS: 0/9 (0) | |||||
| None: 3/9 (33) | |||||
| Chromosomal microarrayd | 48 | 51 | 16.5 (10.0–23.0), 40 | 35.0 (16.5–66.5), 41 | Positive: 8/51 (16) |
| Negative: 30/51 (59) | |||||
| VUS: 11/51 (22) | |||||
| None: 3/51 (6) | |||||
| Single gene testing (sequencing or targeted mutation analysis)d | 47 | 94 | 22.0 (13.0–34.0), 87 | 82.0 (41.0–182.5), 89 | Positive: 12/94 (13) |
| Negative: 79/94 (84) | |||||
| VUS: 7/94 (7) | |||||
| None: 0/91 (0) | |||||
| Deletion/duplication analysis | 22 | 27 | 21.0 (14.0–41.0), 27 | 73.0 (40.0–139.0), 27 | Positive: 5/27 (19) |
| Negative: 21/27 (78) | |||||
| VUS: 0/27 (0) | |||||
| None: 1/27 (4) | |||||
| Methylation analysis | 5 | 5 | 8.0 (6.0–24.0), 5 | 69.0 (11.0–179.0), 5 | Positive: 0/5 (0) |
| Negative: 4/5 (80) | |||||
| VUS: 0/5 (0) | |||||
| None: 1/5 (20) | |||||
| Triplet repeat study | 2 | 2 | 42.0 (N/A), 1 | 82.0 (min-max 77.0–87.0), 2 | Positive: 0/2 (0) |
| Negative: 2/2 (100) | |||||
| VUS: 0/2 (0) | |||||
| None: 0/2 (0) | |||||
| Gene paneld | 20 | 25 | 48.0 (32.0–56.0), 23 | 106.0 (54.0–231.0), 23 | Positive: 4/25 (16) |
| Negative:12/25 (48) | |||||
| VUS: 9/25 (36) | |||||
| None: 1/25 (4) | |||||
| Mitochondrial gene testingd | 5 | 7 | 81.0 (61.0–157.0), 7 | 147.0 (74.0–446.0), 7 | Positive: 1/7 (14)e |
| Negative: 5/7 (71) | |||||
| VUS: 3/7 (43) | |||||
| None: 0/7 (0) | |||||
| Whole exome or whole genome sequencingf | 7 | 7 | 161.0 (114.0–268.0), 7 | 456.0 (170.0–602.0), 7 | Positive: 3/7 (43) |
| Negative: 2/7 (29) | |||||
| VUS: 2/7 (29) | |||||
| None: 0/7 (0) | |||||
Number of patients who had the test sent (patients may have had more than one test sent).
Turnaround time refers to the difference in days between the date the specimen was received by the lab and the date of the result report. This information was not available for all tests reviewed.
VUS, variant of unknown significance; “Positive” includes pathogenic or likely pathogenic variants; “Negative” includes benign/likely benign variants; “None” indicates that there was no result from the test or the test result was unknown. A single pathogenic variant in a gene associated with an autosomal recessive condition (i.e. CFTR) was not considered a positive result.
Test could have more than one category of result (e.g. one pathogenic variant and one variant of unknown significance).
This patient had a “positive” result on genetic testing but was not determined to have a molecular genetic diagnosis made (it was unclear whether the variant identified was responsible for the patient’s presentation).
One patient had whole genome sequencing with a turnaround time of 294 days and a positive result.
Genetic Diagnosis
47/170 (28%) of the deceased patients had a laboratory-confirmed genetic diagnosis made with 40/170 (24%) diagnosed after birth. 22/40 (55%) of postnatal diagnoses were made within the first six months of life and 14/40 (35%) of postnatal diagnoses (14/47 [30%] of overall diagnoses) were diagnosed postmortem (Figure 2). The diagnoses and testing modalities leading to diagnosis are detailed in the Supplemental Table. 16/40 (40%) patients with laboratory-confirmed postnatal diagnoses had a clinical diagnosis made prior to the laboratory confirmation, though this information was not available for two patients with Trisomy 21 diagnosed prior to transfer to our institution. Two diagnoses involved a VUS found in combination with a likely pathogenic or pathogenic variant in a gene associated with an autosomal recessive disorder and three additional diagnoses also involved two variants thought to cause an autosomal recessive disorder without confirmation of phase documented in the medical record. If these five patients are not considered to have molecular genetic diagnoses, the overall diagnostic yield drops to 42/170 (25%) with 35/170 (21%) diagnosed after birth, 20/35 (57%) of diagnoses made within the first six months of life, and 12/35 (34%) diagnosed postmortem.
Figure 2. Timing of the molecular genetic diagnosis.
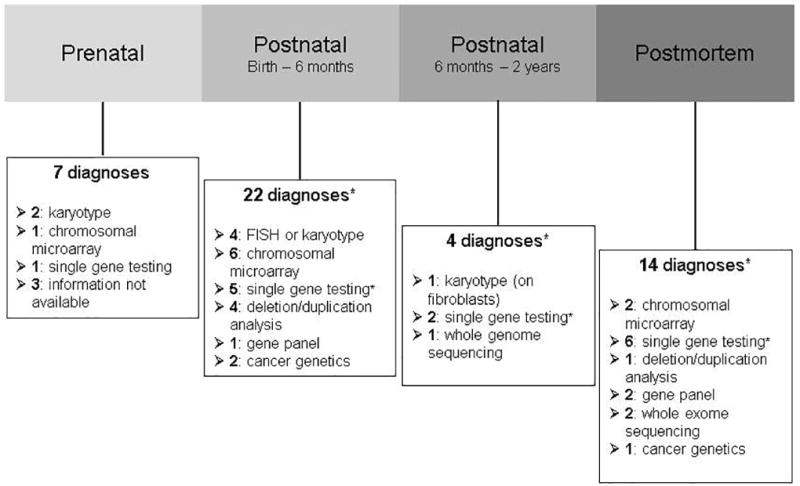
*Two postnatal (birth – 6 months), one postnatal (6 months – 2 years) and two postmortem diagnoses involve two variants thought to cause an autosomal recessive disorder without confirmation of phase documented in the medical record. Two of these diagnoses (one postnatal and one postmortem) also involve a VUS found in combination with a likely pathogenic or pathogenic variant.
10/47 diagnosed patients (21%) had a chromosomal aneuploidy syndrome with Trisomy 21 accounting for 5/10 (50%). Single gene testing (sequencing or targeted mutation analysis) was the most common genetic testing modality leading to postnatal diagnosis (13/40, 33%), followed by chromosomal microarray (8/40, 20%), deletion/duplication analysis (5/40, 13%), and FISH or karyotype (5/40, 13%). The median age at laboratory-confirmed genetic diagnosis (excluding prenatal and postmortem diagnoses) was 46.5 days (Q1–Q3 14.0–108.0 days, range 4.0–602.0 days). Three diagnoses were cancer-related: two had leukemia with MLL gene rearrangements and one had Trisomy 21-associated transient myeloproliferative disorder with a pathogenic variant in GATA1.
Of the patients who had a laboratory-confirmed genetic diagnosis made prior to death, 31/33 (94%) had care redirected and 23/27 (85%) had life support withdrawn (this information was not available for all patients). This was not significantly different when compared to those who did not have a laboratory-confirmed genetic diagnosis made prior to death (106/131 [81%], p = 0.11, 93/126 [74%], p = 0.32).
Characteristics of Patients who Underwent an Evaluation for a Genetic or Metabolic Disorder
The proportion of patients who had an evaluation for a genetic or metabolic disorder varied by cause of death (Figure 1). A subgroup of 49 patients who died from acquired gastrointestinal disease, prematurity, hypoxic ischemic encephalopathy, or intracranial hemorrhage had lower rates of genetics or metabolism consultation (10/49, 20%) or testing for a genetic or metabolic condition (10/49, 20%). For the remainder of the patients (excluding those for whom information was not available on the cause of death), 60/99 (61%) had a genetics or metabolism consultation and 70/99 (71%) had testing for a genetic or metabolic condition. These differences were statistically significant (p < 0.001).
A smaller proportion of infants who had a genetics or metabolism consultation were preterm than those who did not have a consultation (35/87 [40%]vs. 59/83 [71] p < 0.001). The median age on NICU admission was similar (8.0 [Q1–Q3 2.0–30.0] vs. 7.0 [Q1–Q3 1.0–32.0] days, p = 0.69), though the median age at death was significantly higher (92.0 [Q1–Q3 32.0–285.0] vs. 20.0 [Q1–Q3 7.0–100.0] days, p < 0.001) and total number of days in the NICU was significantly longer (16.0 [Q1–Q3 3.0–49.0] vs. 5.0 [Q1–Q3 1.0–14.0] days, p < 0.001) for those infants who had a genetics or metabolism consultation. The proportion who had care redirected (73/82 [89%] vs. 64/82 [78%] p = 0.09) or life support removed (57/73 [78%] vs. 59/80 [74%] p = 0.58) was similar between groups. These findings were again seen when comparing the 106/170 patients who had either a genetics or metabolism consultation or a test for a genetic or metabolic condition to those who had neither (Table 3).
Table 3.
Comparison of infants who did and did not undergo a genetic diagnostic evaluation.
| Genetics/Metabolism Consult or Test (n = 106) |
No Genetics/Metabolism Consult or Test (n = 64) |
p | |
|---|---|---|---|
| Median (Q1–Q3) | |||
| Age at NICU admission, days | 8.0 (2.0–34.3) | 7.0 (0.0–25.5) | 0.16 |
| Total time in the NICU, days | 13.5 (3.0–35.3) | 5.0 (1.0–15.3) | 0.003 |
| Age at death, days | 92.0 (27.8–251.3) | 17.5 (7.0–64.5) | <0.001 |
| N/total (%) | |||
| Preterm | 46/106 (43) | 48/64 (75) | <0.001 |
| Care redirecteda | 87/101 (86) | 50/63 (79) | 0.28 |
| Life support removedb | 68/91 (75) | 48/62 (77) | 0.85 |
Information not available for 6 patients
Information not available for 17 patients
DISCUSSION
We present the first comprehensive analysis of the diagnostic odyssey for infants in a level IV NICU that focuses on a population at high risk for genetic disease: those who do not survive early childhood. Our data show that while an evaluation for a genetic or metabolic disorder was pursued in over half of these infants, a molecular diagnosis was confirmed in only 28%, and 30% of these diagnoses were made post-mortem. This suggests that a number of infants may stand to benefit from a laboratory-confirmed genetic diagnosis but that this opportunity for diagnosis prior to death is missed, owing to the nature of the traditional diagnostic genetic evaluation. Prior estimates of the contribution of genetic disorders to mortality in the NICU have ranged from 5% to 50% depending on the definition of “genetic disorder” and whether or not congenital anomalies, which are estimated to comprise 30% of the infant mortality rate11, are included1–5,12. Indeed, the true burden of genetic disease in the neonatal population is difficult to ascertain as these data were generally obtained prior to the widespread use of next-generation sequencing. This may result in an underestimate of the contribution of Mendelian disorders to neonatal mortality. Conversely, the inclusion in these studies of all infants with congenital malformations, some of which may be related to environmental or teratogenic factors, may overestimate the presumed genetic contributions. Our data also reflect that genetic disorders and congenital anomalies contribute greatly to mortality in the infant and early childhood period, though our study is unique in identifying how many undergo a diagnostic genetic evaluation.
We have shown that while these high-risk neonates embark on their genetic diagnostic odyssey within the first week of life, the turnaround time for most genetic tests, consistent with prior data13,19, is typically on the order of several weeks to months. The diagnostic odyssey can therefore last for months (or years) owing to the usual stepwise structure of the traditional genetic diagnostic evaluation, where subsequent rounds of testing are sent only after prior testing has been unrevealing. This is reflected in the later median age found at results of tests such as gene panels and mitochondrial gene sequencing compared to cytogenetic studies such as karyotype and FISH, which are often sent in the first round of genetic testing. As a chromosomal microarray is recommended as the first-tier diagnostic test for patients with multiple congenital anomalies22, as affected many patients in our study, it is not surprising that this and single gene testing were the most commonly-utilized genetic tests in our study. A prior study also found high rates of chromosomal microarray use in a NICU population but that single gene testing was sent in a minority19. WES or WGS has historically only been performed after all previous testing has returned negative, which is reflected in the extremely low rate of usage that we found. WES has been previously shown to have a diagnostic yield of approximately 25–30%23,24, though this yield may be higher in the neonatal period, particularly in a sequencing-naïve population14–18,24,25. The diagnostic yield for the testing modalities examined in our study ranged from 13–43% (excluding studies for which there were no positive results) and was highest for WES/WGS, though the median turnaround time was between five and six months. Interestingly, we found that most postnatal diagnoses in our study were made by single gene testing, while a prior study of genetic evaluations in the NICU found that most genetic diagnoses were of chromosomal aneuploidy syndromes, particularly Trisomy 21, which may be due to their population of primarily living patients19. This may also reflect the complexity of patients admitted to our NICU for diagnostic evaluation and suggests that the early addition of large, next-generation sequencing panels or WES to the NICU genetic evaluation may increase the diagnostic yield, as is reflected in a recent study demonstrating a diagnostic yield of 36.7% for WES in a NICU setting, with 54.9% of diagnosed infants having WES as a first-tier approach18, and in a 40% diagnostic yield found in a NICU population using a large panel of disease genes26. As sequencing technologies continue to improve and the cost decreases, the use of WES and other massively-parallel sequencing technologies will likely expand, though given the high rate of chromosomal diagnoses found in the NICU population, it may not serve well as an independent testing modality19,27. Furthermore, the use of broader sequencing panels and WES also increases the potential to find VUS, as is reflected in our data.
Our data further demonstrate that there are two patient populations who are admitted to our NICU and later die: those who die from causes that are less likely to be related to genetic disorders, such as perinatal asphyxia or complications of prematurity, and those with unusual presentations who undergo a diagnostic genetic evaluation. Our results suggest that infants with suspected genetic disorders spend more time in the NICU prior to death, providing an opportunity for genetic diagnosis, particularly as we have shown that deaths in our study most often occur after redirection of care or withdrawal of life support and are therefore anticipated deaths, consistent with prior literature on deaths in the NICU1,3,20 (though not all deaths in our study occurred in the hospital setting). Prior research has demonstrated that NICU resources are preferentially directed towards infants who will survive to discharge, as these infants traditionally comprise the majority of NICU bed days28, which argues that NICU expenditures are less likely to be for “futile” care. Infants with suspected genetic disorders, particularly at a level IV referral center such as ours, may potentially increase expenses for such “futile” care. Due to the high cost of NICU admissions, billed to insurance for thousands of dollars per day28, the ability to find a diagnosis earlier may result in substantial cost savings if it allows for curative treatments or aids in the decision to redirect care earlier for diagnoses for which the prognosis is poor. It has been previously suggested that early genetic diagnosis may increase mortality in the neonatal period but decrease infant mortality due to this phenomenon29. It is difficult to quantify the impact of a genetic diagnosis, particularly retrospectively, but providing closure to parents at the end of an infant’s life is an invaluable benefit.
In addition to providing guidance and closure at the end of life, finding a genetic diagnosis has also been shown to alter clinical management18,25,26,30–33 or aid in the decision to consult palliative care in the NICU16,19. While genetic testing is expensive, particularly WES and WGS, these tests may in the end be cost-saving, particularly given the duration and cost of the traditional genetic diagnostic evaluation13,30,33. Identifying the genetic cause of a patient’s condition puts an end to the diagnostic odyssey, obviating the need for further costly testing. In addition, having a diagnosis can help the families and caregivers of critically-ill infants to access resources particular to their child and to prepare for the future, even if the diagnosis is life-limiting; it can also allow families to bond together in rare disease communities34,35. Finally, a laboratory-confirmed diagnosis allows for testing of other at-risk family members25 and for reproductive counseling to be provided26, which holds great value for parents36 and is of particular importance in the NICU where parents faced with the loss of their first child are often looking for guidance with their next pregnancy. It is difficult to speculate as to how parents and the care team in our cohort would have used information gained from a molecular diagnosis in terms of earlier redirection of care; as for management changes, while there were treatable conditions in our diagnosed cohort, such as ornithine transcarbamylase deficiency, this condition was recognized and appropriately treated as a urea cycle disorder with confirmation provided by the genetic testing. We do suspect, however, that there were missed opportunities for management changes owing to the lack of a molecular genetic diagnosis and further research is warranted in this area, as well as to better-identify which patients in the NICU stand to benefit the most from a genetics or metabolism consultation and are potentially being overlooked at present.
Limitations of this study include the small sample size and retrospective design. We recognize that the proportion of infants with suspected genetic disease is enriched in our study population owing to the nature of our level IV NICU. This enrichment allowed us to evaluate a larger number of patients in order to be able to more accurately reflect characteristics such as the turnaround time of genetic testing, at the expense of generalizability of these mortality statistics to the newborn population as a whole. Our study was limited to review of medical records, which may not always be updated to reflect a patient’s death outside of our hospital, therefore, deaths may have occurred of which we were not aware, though we suspect this represents a minority of patients. Furthermore, as our NICU is a referral center with a high volume of transfers and retro-transfers, it is difficult to capture an infant’s entire diagnostic odyssey, particularly if it began at another institution. Tests such as FISH and karyotype are particularly likely to have been performed elsewhere, judging by the smaller amount of data we had regarding these modalities. However, our study is valuable in reflecting current practices at a high-volume newborn referral center that cares for many infants with rare and likely genetic disease. Confirmed genetic diagnoses may also be difficult to extract from the medical record, particularly as documentation and follow-up may be incomplete after a child’s death. Indeed, one patient had a likely pathogenic variant found post-mortem, though it took an additional three years before the pathogenicity was fully established based on functional studies37. This further highlights the complexity of the diagnostic odyssey for this unique patient population.
We have shown that over half of infants admitted to the NICU who do not survive early childhood are suspected to have a genetic disorder and that these patients represent a unique population in the NICU who would likely benefit from a laboratory-confirmed genetic diagnosis. The current tiered approach to genetic testing results in a delayed diagnosis and has a relatively low diagnostic yield. While the median time to genetic diagnosis in our study was 46.5 days, for those who remained undiagnosed at death, the diagnostic odyssey may still continue. Families who continue to pursue diagnosis after the death of a child face even greater barriers, as functional data to investigate candidate genes and variants is difficult to obtain and insurance does not cover post-mortem testing. Further research is needed to determine the best approach to genetic diagnosis in the NICU in order to improve the care that we provide to infants and their families.
Supplementary Material
Acknowledgments
We would like to thank the patients and families that we care for at our hospital who continue to teach and enrich us all. We are also greatly appreciative of statistical consultation provided by Dr. Henry Feldman. Dr. Wojcik is supported by NIH 4 T32 HD 7466-20. Dr. Agrawal is supported by NIH/NIAMS 1R01AR068429-01 and NICHD/NHGRI/NIH U19HD077671.
Footnotes
Supplementary information is available at the Genetics in Medicine website.
Potential Conflicts of Interest:Meghan C. Towne is currently employed by Ambry Genetics.
References
- 1.Simpson CD, Ye XY, Hellmann J, Tomlinson C. Trends in cause-specific mortality at a Canadian outborn NICU. Pediatrics. 2010;126:1538. doi: 10.1542/peds.2010-1167. [DOI] [PubMed] [Google Scholar]
- 2.Hudome SM, Kirby RS, Senner JW, Cunniff C. Contribution of genetic disorders to neonatal mortality in a regional intensive care setting. Am J Perinatol. 1994;11:100–103. doi: 10.1055/s-2007-994565. [DOI] [PubMed] [Google Scholar]
- 3.Weiner J, Sharma J, Lantos J, Kilbride H. How infants die in the neonatal intensive care unit: trends from 1999 through 2008. Arch Pediatr Adolesc Med. 2011;165:630–634. doi: 10.1001/archpediatrics.2011.102. [DOI] [PubMed] [Google Scholar]
- 4.Sankaran K, Chien LY, Walker R, Seshia M, Ohlsson A. Canadian Neonatal Network. Variations in mortality rates among Canadian neonatal intensive care units. CMAJ. 2002;166:173–178. [PMC free article] [PubMed] [Google Scholar]
- 5.Jacob J, Kamitsuka M, Clark RH, Kelleher AS, Spitzer AR. Etiologies of NICU deaths. Pediatrics. 2015;135:59. doi: 10.1542/peds.2014-2967. [DOI] [PubMed] [Google Scholar]
- 6.Yoon PW, Olney RS, Khoury MJ, Sappenfield WM, Chavez GF, Taylor D. Contribution of birth defects and genetic diseases to pediatric hospitalizations. A population-based study. Arch Pediatr Adolesc Med. 1997;151:1096–1103. doi: 10.1001/archpedi.1997.02170480026004. [DOI] [PubMed] [Google Scholar]
- 7.Stevenson DA, Carey JC. Contribution of malformations and genetic disorders to mortality in a children's hospital. Am J Med Genet A. 2004;126A:393–397. doi: 10.1002/ajmg.a.20409. [DOI] [PubMed] [Google Scholar]
- 8.Meng M, Zhang YP. Impact of inborn errors of metabolism on admission in a neonatal intensive care unit: a 4-year report. J Pediatr Endocrinol Metab. 2013;26:689–693. doi: 10.1515/jpem-2013-0021. [DOI] [PubMed] [Google Scholar]
- 9.Nelson K, Holmes LB. Malformations due to presumed spontaneous mutations in newborn infants. N Engl J Med. 1989;320:19–23. doi: 10.1056/NEJM198901053200104. [DOI] [PubMed] [Google Scholar]
- 10.Mathews TJ, Driscoll AK. Trends in Infant Mortality in the United States, 2005–2014. Hyattsville, MD: National Center for Health Statistics.; 2017. NCHS data brief, no 279. [Google Scholar]
- 11.Wen SW, Liu S, Joseph KS, Rouleau J, Allen A. Patterns of infant mortality caused by major congenital anomalies. Teratology. 2000;61:342–346. doi: 10.1002/(SICI)1096-9926(200005)61:5<342::AID-TERA5>3.0.CO;2-7. [DOI] [PubMed] [Google Scholar]
- 12.Costa S, Rodrigues M, Centeno MJ, et al. Diagnosis and cause of death in a neonatal intensive care unit--how important is autopsy? J Matern Fetal Neonatal Med. 2011;24:760–763. doi: 10.3109/14767058.2010.520047. [DOI] [PubMed] [Google Scholar]
- 13.Shashi V, McConkie-Rosell A, Rosell B, et al. The utility of the traditional medical genetics diagnostic evaluation in the context of next-generation sequencing for undiagnosed genetic disorders. Genet Med. 2014;16:176–182. doi: 10.1038/gim.2013.99. [DOI] [PubMed] [Google Scholar]
- 14.Smith LD, Willig LK, Kingsmore SF. Whole-Exome Sequencing and Whole-Genome Sequencing in Critically Ill Neonates Suspected to Have Single-Gene Disorders. Cold Spring Harb Perspect Med. 2015;6:a023168. doi: 10.1101/cshperspect.a023168. [DOI] [PMC free article] [PubMed] [Google Scholar]
- 15.Saunders CJ, Miller NA, Soden SE, et al. Rapid whole-genome sequencing for genetic disease diagnosis in neonatal intensive care units. Sci Transl Med. 2012;4:154ra135. doi: 10.1126/scitranslmed.3004041. [DOI] [PMC free article] [PubMed] [Google Scholar]
- 16.Willig LK, Petrikin JE, Smith LD, et al. Whole-genome sequencing for identification of Mendelian disorders in critically ill infants: a retrospective analysis of diagnostic and clinical findings. Lancet Respir Med. 2015;3:377–387. doi: 10.1016/S2213-2600(15)00139-3. [DOI] [PMC free article] [PubMed] [Google Scholar]
- 17.Soden SE, Saunders CJ, Willig LK, et al. Effectiveness of exome and genome sequencing guided by acuity of illness for diagnosis of neurodevelopmental disorders. Sci Transl Med. 2014;6:265ra168. doi: 10.1126/scitranslmed.3010076. [DOI] [PMC free article] [PubMed] [Google Scholar]
- 18.Meng L, Pammi M, Saronwala A, et al. Use of Exome Sequencing for Infants in Intensive Care Units: Ascertainment of Severe Single-Gene Disorders and Effect on Medical Management. JAMA Pediatr. 2017:e173438. doi: 10.1001/jamapediatrics.2017.3438. [DOI] [PMC free article] [PubMed] [Google Scholar]
- 19.Malam F, Hartley T, Gillespie MK, et al. Benchmarking outcomes in the Neonatal Intensive Care Unit: Cytogenetic and molecular diagnostic rates in a retrospective cohort. Am J Med Genet A. 2017 doi: 10.1002/ajmg.a.38250. [Epub ahead of print] [DOI] [PubMed] [Google Scholar]
- 20.Berger TM, Hofer A. Causes and circumstances of neonatal deaths in 108 consecutive cases over a 10-year period at the Children's Hospital of Lucerne, Switzerland. Neonatology. 2009;95:157–163. doi: 10.1159/000153100. [DOI] [PubMed] [Google Scholar]
- 21.Harris PA, Taylor R, Thielke R, Payne J, Gonzalez N, Conde JG. Research electronic data capture (REDCap)--a metadata-driven methodology and workflow process for providing translational research informatics support. J Biomed Inform. 2009;42:377–381. doi: 10.1016/j.jbi.2008.08.010. [DOI] [PMC free article] [PubMed] [Google Scholar]
- 22.Miller DT, Adam MP, Aradhya S, et al. Consensus statement: chromosomal microarray is a first-tier clinical diagnostic test for individuals with developmental disabilities or congenital anomalies. Am J Hum Genet. 2010;86:749–764. doi: 10.1016/j.ajhg.2010.04.006. [DOI] [PMC free article] [PubMed] [Google Scholar]
- 23.Yang Y, Muzny DM, Reid JG, et al. Clinical whole-exome sequencing for the diagnosis of mendelian disorders. N Engl J Med. 2013;369:1502–1511. doi: 10.1056/NEJMoa1306555. [DOI] [PMC free article] [PubMed] [Google Scholar]
- 24.Farwell KD, Shahmirzadi L, El-Khechen D, et al. Enhanced utility of family-centered diagnostic exome sequencing with inheritance model-based analysis: results from 500 unselected families with undiagnosed genetic conditions. Genet Med. 2015;17:578–586. doi: 10.1038/gim.2014.154. [DOI] [PubMed] [Google Scholar]
- 25.Stark Z, Tan TY, Chong B, et al. A prospective evaluation of whole-exome sequencing as a first-tier molecular test in infants with suspected monogenic disorders. Genet Med. 2016;18:1090–1096. doi: 10.1038/gim.2016.1. [DOI] [PubMed] [Google Scholar]
- 26.Daoud H, Luco SM, Li R, et al. Next-generation sequencing for diagnosis of rare diseases in the neonatal intensive care unit. CMAJ. 2016;188:254. doi: 10.1503/cmaj.150823. [DOI] [PMC free article] [PubMed] [Google Scholar]
- 27.Xue Y, Ankala A, Wilcox WR, Hegde MR. Solving the molecular diagnostic testing conundrum for Mendelian disorders in the era of next-generation sequencing: single-gene, gene panel, or exome/genome sequencing. Genet Med. 2015;17:444–451. doi: 10.1038/gim.2014.122. [DOI] [PubMed] [Google Scholar]
- 28.Meadow W, Cohen-Cutler S, Spelke B, et al. The prediction and cost of futility in the NICU. Acta Paediatr. 2012;101:397–402. doi: 10.1111/j.1651-2227.2011.02555.x. [DOI] [PMC free article] [PubMed] [Google Scholar]
- 29.Petrikin JE, Willig LK, Smith LD, Kingsmore SF. Rapid whole genome sequencing and precision neonatology. Semin Perinatol. 2015;39:623–631. doi: 10.1053/j.semperi.2015.09.009. [DOI] [PMC free article] [PubMed] [Google Scholar]
- 30.Tan TY, Dillon OJ, Stark Z, et al. Diagnostic Impact and Cost-effectiveness of Whole-Exome Sequencing for Ambulant Children With Suspected Monogenic Conditions. JAMA Pediatr. 2017;171:855–86. doi: 10.1001/jamapediatrics.2017.1755. [DOI] [PMC free article] [PubMed] [Google Scholar]
- 31.Riggs ER, Wain KE, Riethmaier D, et al. Chromosomal microarray impacts clinical management. Clin Genet. 2014;85:147–153. doi: 10.1111/cge.12107. [DOI] [PubMed] [Google Scholar]
- 32.Coulter ME, Miller DT, Harris DJ, et al. Chromosomal microarray testing influences medical management. Genet Med. 2011;13:770–776. doi: 10.1097/GIM.0b013e31821dd54a. [DOI] [PubMed] [Google Scholar]
- 33.Stark Z, Schofield D, Alam K, et al. Prospective comparison of the cost-effectiveness of clinical whole-exome sequencing with that of usual care overwhelmingly supports early use and reimbursement. Genet Med. 2017;19:867–874. doi: 10.1038/gim.2016.221. [DOI] [PubMed] [Google Scholar]
- 34.Knott M, Leonard H, Downs J. Genetic drift. The diagnostic odyssey to Rett syndrome: the experience of an Australian family. Am J Med Genet A. 2012;158A:10–12. doi: 10.1002/ajmg.a.34372. [DOI] [PubMed] [Google Scholar]
- 35.Carmichael N, Tsipis J, Windmueller G, Mandel L, Estrella E. "Is it going to hurt?": the impact of the diagnostic odyssey on children and their families. J Genet Couns. 2015;24:325–335. doi: 10.1007/s10897-014-9773-9. [DOI] [PubMed] [Google Scholar]
- 36.Might M, Might CC. What happens when N = 1 and you want plus 1? Prenat Diagn. 2017;37:70–72. doi: 10.1002/pd.4975. [DOI] [PubMed] [Google Scholar]
- 37.Pozzi S, Tan WH, Martinez-Barbera J. Characterization of a novel HESX1 mutation in a pediatric case of septo-optic dysplasia. Clin Case Rep. 2017;5:463–470. doi: 10.1002/ccr3.868. [DOI] [PMC free article] [PubMed] [Google Scholar]
Associated Data
This section collects any data citations, data availability statements, or supplementary materials included in this article.