

Abstract
Heat and drought stress are primary abiotic stresses confining growth of cool-season grass species during summer. The objective of this study was to identify common molecular factors and metabolic pathways associated with heat and drought responses in creeping bentgrass (Agrostis stolonifera) by comparative analysis of transcriptomic profiles between plants exposed to heat and drought stress. Plants were exposed to heat stress (35/30 °C day/night temperature) or drought stress by withholding irrigation for 21 d in growth chambers. Transcriptomic profiling by RNA-seq in A. stolonifera (cv. ‘Penncross’) found 670 commonly up-regulated and 812 commonly down-regulated genes by heat and drought stress. Transcriptional up-regulations of differentially expressed genes (DEGs) due to heat and drought stress include genes that were highly enriched in oxylipin biosynthetic process and proline biosynthetic process. Transcriptional down-regulations of genes under heat and drought stress were highly enriched and involved in thiamine metabolic process and calcium sensing receptor. These commonly-regulated genes by heat and drought stress identified in A. stolonifera suggested that drought and heat responses shared such common molecular factors and pathways, which could be potential candidate genes for genetic modification of improving plant tolerance to the combined heat and drought stress.
Introduction
Drought and heat stresses are two major abiotic stresses affecting plant growth. Plant physiological and biochemical responses to either stress alone or the combined stress have been reported, such as growth inhibition, and disturbed carbohydrate, amino acid, and hormone metabolism, as well as the induction of oxidative damages1–8. Drought and heat stress may affect plant growth by some common mechanisms, and indeed drought and heat are often associated with each other in natural environmental conditions during summer months9. However, molecular factors underlying the alteration of physiological performance, which are commonly regulated by drought and heat stresses, are not well documented.
RNA sequencing (RNA-seq) is one of the powerful next generation sequencing technologies that provides large amount of transcriptional information, which is especially useful to detect differential gene regulation patterns under different types of stresses. Transcriptomic analysis by RNA-seq of plant responses to drought stress has been performed in various plant species, and revealed that most of the up-regulated transcripts in response to drought stress were involved in carbohydrate metabolism, oxidative responses and hormone metabolism, while most of down-regulated transcripts are found to be related to photosynthesis10–15. Transcriptomic analysis for heat stress responses in various plant species have found significant enrichment of up-regulated genes in carbohydrate metabolism, protein metabolism, lipid metabolism, oxidative stress responses, and calcium signaling pathway, as well as many down-regulated genes in photosynthesis, cell cycle, cell wall biosynthesis, and transcription factor families11,16–19. However, only a few studies have examined common transcriptomic responses to heat and drought stress11,20. Such information would be valuable in order to find out the potential molecular mechanisms and pathways that commonly regulate plant tolerance to both heat and drought stress.
Creeping bentgrass (Agrostis stolonifera), is one of the major cool-season grass species, which is widely used as turf and forage grass in temperate regions. Previous studies have been conducted in creeping bentgrass under either drought or heat stress condition, in order to understand physiological, molecular, transcriptomic and proteomic responses related to drought or heat tolerance21–25. However, no information regarding to the common regulation patterns for creeping bentgrass under either drought or heat stress condition is available. The objective of this study was to identify common genes regulated by drought and heat stresses, and the associated metabolic pathways for drought and heat adaptation by comparative analysis of the transcriptomic changes in response to drought or heat stress for a cool-season grass species, creeping bentgrass (A. stolonifera), widely used as turf and forage grass in temperate regions.
Results
Physiological responses to drought and heat stress
Creeping bentgrass plants were subject to either heat (35/30 °C day/night temperature) or drought (withheld from irrigation) for 21 d, respectively. Leaf relative water content (RWC) did not differ significantly at 0 and 7 d between control and either drought or heat stress condition. Drought or heat treatment led to significant decrease of RWC at 14 and 21 d compared with the control (Fig. 1a). For electrolyte leakage (EL), there was no significant difference found at 0 d between the control, drought and heat stress conditions. Heat or drought stress resulted in significant increases of EL compared with the control at 7 and 14 d of heat stress and at 21 d of drought (Fig. 1b).
Figure 1.
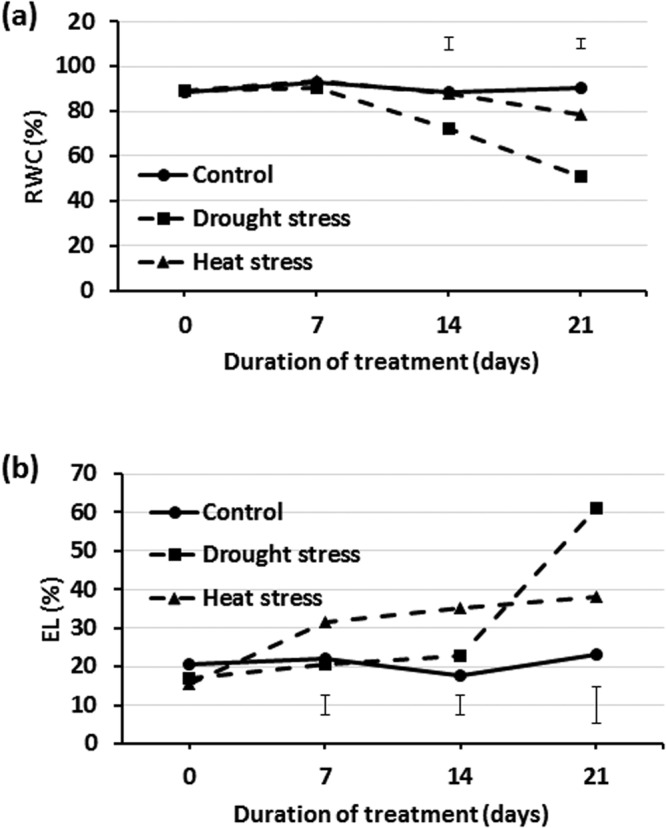
Leaf (a) relative water content (RWC) and (b) electrolyte leakage (EL) of A. stolonifera under non-stress control, drought and heat stress conditions. Data shown are the means of four biological replicates (n = 4). Bar represents Fisher’s least significant difference (LSD) for each sampling day.
Transcriptomic sequencing of A. stolonifera
The RNA sequencing yielded about 25 million reads per library of A. stolonifera leaves exposed to either control, heat or drought stress conditions, providing over 18x coverage of the estimated transcriptome size (~417Mbp) of A. stolonifera26,27. Using the threshold of FDR <0.001 and |log2 of fold change (FC)| >1, a total of 2132 and 3680 differentially-expressed genes (DEGs) in response to drought or heat stress, respectively were found in A. stolonifera. Among them, 1082 and 1940 DEGs were significantly up-regulated under drought and heat stress, respectively, and 1050 and 1740 DEGs were significantly down-regulated under drought and heat stress, respectively (Fig. 2). Among them, 1482 genes were commonly regulated by drought and heat stress in A. stolonifera, with 670 up-regulated and 812 down-regulated genes included in both drought and heat stresses (Fig. 2, Table S1 in Supplementary Materials).
Figure 2.

Number of (a) up- and (b) down-regulated genes in A. stolonifera under drought and heat stress, respectively, compared with control condition. The cutoff threshold was set as FDR > 0.001.
GO term enrichment analysis
In order to find out the biological processes commonly regulated by drought and heat stress, GO term enrichment analysis was performed for up- and down-regulated common genes (Figs 3–7, Tables 2–3 in Supplementary Materials). In the up-regulated common genes under drought and heat stress, several GO terms in Biological Process (BP) category were mostly enriched, including oxylipin biosynthetic process (GO:0031408), nucleic acid-templated transcription (GO:0097659), transcription, DNA-templated (GO:0006351), RNA biosynthetic process (GO:0032774), nucleobase-containing compound biosynthetic process (GO:0034654), carboxylic acid biosynthetic process (GO:0046394), ethylene-activated signaling pathway (GO:0009873), organic acid biosynthetic process (GO:0016053), hormone-mediated signaling pathway (GO:0009755), tyrosine catabolic process (GO:0006572), proline metabolic process (GO:0006560), RNA metabolic process (GO:0016070), cellular amino acid catabolic process (GO:0009063) and L-proline biosynthesis (GO:0055129) (Fig. 3, Table 1). Among the down-regulated common genes, several GO terms in BP category were enriched under drought and heat stresses, including plastid translation (GO:0032544), thiamine biosynthetic process (GO:0009228), thiamine-containing compound biosynthetic process (GO:0042724), thiamine metabolic process (GO:0006772), thiamine-containing compound metabolic process (GO:0042723), positive regulation of cellular amide metabolic process (GO:0034250), positive regulation of translation (GO:0045727) and serine family amino acid biosynthetic process (GO:0009070), from top to bottom (Figs 5 and 6, Table 2). All the enriched GO terms in cellular component (CC) category under drought and heat stresses were related to chloroplast, including plastid thylakoid (GO:0031976), chloroplast thylakoid (GO:0009534), plastid thylakoid membrane (GO:0055035), chloroplast thylakoid membrane (GO:0009535), chloroplast stroma (GO:0009570), photosystem (GO:0009521), plastid envelope (GO:0009941), stromule (GO:0010319), photosystem II (GO:0009523), photosystem I (GO:0009522), plastid thylakoid lumen (GO:0031978), chloroplast thylakoid lumen (GO:0009543), photosystem II oxygen evolving complex (GO:0009654), photosystem I reaction center (GO:0009538), plastoglobule (GO:0010287) (Fig. 7, Table 3). In regard of molecular function (MF) and CC for up-regulated common genes, and MF for down-regulated common genes, no enriched GO terms were found with the threshold of GO term level ≥6.
Figure 4.

Molecular Function (MF) of GO term enrichment for up-regulated common DEGs in A. stolonifera. Yellow color indicates significantly enriched GO terms. The density of color in each node was proportional to statistical significance of enrichment of the corresponding GO term. Red edges stand for relationship between enriched GO terms.
Figure 3.

Biological Process (BP) of GO term enrichment for up-regulated common DEGs in A. stolonifera. Yellow color indicates significantly enriched GO terms. The density of color in each node was proportional to statistical significance of enrichment of the corresponding GO term. Red edges stand for relationship between enriched GO terms.
Figure 7.

Cellular Component (CC) of GO term enrichment for down-regulated common DEGs in A. stolonifera. Yellow color indicates significantly enriched GO terms. The density of color in each node was proportional to statistical significance of enrichment of the corresponding GO term. Red edges stand for relationship between enriched GO terms.
Table 1.
Enriched GO terms in the up-regulated common genes between drought and heat stress condition, using the threshold of GO term level ≥6.
| Ontology | GO ID | GO term | Level | P value |
|---|---|---|---|---|
| Biological_process | GO:0031408 | Oxylipin biosynthetic process | 8 | 5.37E-05 |
| Biological_process | GO:0097659 | Nucleic acid-templated transcription | 9 | 5.37E-05 |
| Biological_process | GO:0006351 | Transcription, DNA-templated | 11 | 5.37E-05 |
| Biological_process | GO:0032774 | RNA biosynthetic process | 9 | 5.56E-05 |
| Biological_process | GO:0034654 | Nucleobase-containing compound biosynthetic process | 9 | 0.00041 |
| Biological_process | GO:0046394 | Carboxylic acid biosynthetic process | 7 | 0.00613 |
| Biological_process | GO:0009873 | Ethylene-activated signaling pathway | 7 | 0.00699 |
| Biological_process | GO:0016053 | Organic acid biosynthetic process | 6 | 0.00739 |
| Biological_process | GO:0009755 | Hormone-mediated signaling pathway | 6 | 0.01119 |
| Biological_process | GO:0006572 | Tyrosine catabolic process | 11 | 0.01753 |
| Biological_process | GO:0006560 | Proline metabolic process | 6 | 0.03706 |
| Biological_process | GO:0016070 | RNA metabolic process | 8 | 0.04209 |
| Biological_process | GO:0009063 | Cellular amino acid catabolic process | 9 | 0.04287 |
| Biological_process | GO:0055129 | L-proline biosynthetic process | 10 | 0.06368 |
Figure 5.

Biological Process (BP) of GO term enrichment for down-regulated common DEGs in A. stolonifera. Yellow color indicates significantly enriched GO terms. The density of color in each node was proportional to statistical significance of enrichment of the corresponding GO term. Red edges stand for relationship between enriched GO terms.
Figure 6.

Molecular Function (MF) of GO term enrichment for down-regulated common DEGs in A. stolonifera. Yellow color indicates significantly enriched GO terms. The density of color in each node was proportional to statistical significance of enrichment of the corresponding GO term. Red edges stand for relationship between enriched GO terms.
Table 2.
Enriched GO terms in the down-regulated common genes between drought and heat stress condition, using the threshold of GO term level ≥6.
| Ontology | GO ID | GO term | Level | P value |
|---|---|---|---|---|
| Biological_process | GO:0032544 | Plastid translation | 9 | 2.76e-05 |
| Biological_process | GO:0009228 | Thiamine biosynthetic process | 9 | 0.000839 |
| Biological_process | GO:0042724 | Thiamine-containing compound biosynthetic process | 9 | 0.000839 |
| Biological_process | GO:0006772 | Thiamine metabolic process | 7 | 0.001344 |
| Biological_process | GO:0042723 | Thiamine-containing compound metabolic process | 7 | 0.001344 |
| Biological_process | GO:0034250 | Positive regulation of cellular amide metabolic process | 7 | 0.003796 |
| Biological_process | GO:0045727 | Positive regulation of translation | 12 | 0.003796 |
| Biological_process | GO:0009070 | Serine family amino acid biosynthetic process | 9 | 0.095477 |
| Cellular_component | GO:0031976 | Plastid thylakoid | 7 | 7.08e-46 |
| Cellular_component | GO:0009534 | Chloroplast thylakoid | 8 | 7.08e-46 |
| Cellular_component | GO:0055035 | Plastid thylakoid membrane | 8 | 2.28e-41 |
| Cellular_component | GO:0009535 | Chloroplast thylakoid membrane | 10 | 2.28e-41 |
| Cellular_component | GO:0009570 | Chloroplast stroma | 7 | 4.69e-23 |
| Cellular_component | GO:0009521 | Photosystem | 8 | 1.76e-15 |
| Cellular_component | GO:0009526 | Plastid envelope | 7 | 6.23e-15 |
| Cellular_component | GO:0009941 | Chloroplast envelope | 8 | 7.32e-14 |
| Cellular_component | GO:0010319 | Stromule | 8 | 2.42e-12 |
| Cellular_component | GO:0009523 | Photosystem II | 8 | 6.59e-08 |
| Cellular_component | GO:0009522 | Photosystem I | 8 | 1.80e-07 |
| Cellular_component | GO:0031978 | Plastid thylakoid lumen | 9 | 8.15e-05 |
| Cellular_component | GO:0009543 | Chloroplast thylakoid lumen | 10 | 8.15e-05 |
| Cellular_component | GO:0009654 | Photosystem II oxygen evolving complex | 10 | 0.000555 |
| Cellular_component | GO:0009538 | Photosystem I reaction center | 10 | 0.000562 |
| Cellular_component | GO:0010287 | Plastoglobule | 8 | 0.003936 |
Table 3.
The qRT-PCR validation of selected genes in the enriched GO terms.
| Gene symbol | Log2FC in qPCR | Log2FC in RNA-seq | ||
|---|---|---|---|---|
| Drought | Heat | Drought | Heat | |
| LOX1 | 1.86 | 3.53 | 3.19 | 4.75 |
| PLP2 | 2.33 | 0.74 | 3.16 | 3.35 |
| P5CS | 3.73 | 1.95 | 3.72 | 2.31 |
| NECD | 3.83 | 1.25 | 5.74 | 4.84 |
| KCS11 | 1.52 | 1.85 | 3.82 | 3.62 |
| TTS2 | −1.16 | −1.79 | −2.37 | −1.79 |
| PMPS | −0.48 | −2.79 | −2.08 | −2.34 |
| CSLB41B | −5.92 | −8.35 | −4.39 | −4.29 |
| CSR | −5.92 | −8.35 | −1.61 | −2.13 |
| NQO5 | −2.63 | −3.61 | −2.72 | −2.89 |
| OEE1 | −0.78 | −0.56 | −1.83 | −1.11 |
| CYP37 | −1.03 | −0.75 | −3.02 | −2.39 |
| PNL1 | −2.84 | −4.45 | −1.74 | −2.81 |
| PI4 | −1.01 | −2.63 | −1.16 | −1.90 |
| PSBY | −1.21 | −0.95 | −1.70 | −3.17 |
| CUR1A | −1.66 | −3.68 | −4.56 | −6.25 |
| LOW1 | −2.52 | −1.13 | −1.84 | −1.05 |
| PSBP3 | −2.48 | −2.22 | −2.84 | −2.59 |
| RHO4 | −3.52 | −2.13 | −2.19 | −2.15 |
| Pearson’s Correlation for Drought | 0.83 | |||
| Pearson’s Correlation for Heat | 0.76 | |||
Validation of RNA-seq with qRT-PCR
The differential expressions of several common genes in selected GO terms in the RNA-seq data were validated using qRT-PCR, based on mostly enriched categories in GO term enrichment analysis. For oxylipin biosynthetic process, linoleate 9S-lipoxygenase 1 (LOX1) and patatin-like protein 2 (PAT2) showed up-regulations under drought and heat stress. For proline biosynthetic process, delta-1-pyrroline-5-carboxylate synthase (P5CS) gene expression level was also up-regulated under drought and heat stress conditions. Similarly, 9-cis-epoxycarotenoid dioxygenase 1 (NCED1) in organic acid biosynthetic process, and 3-ketoacyl-CoA synthase 11 (KCS11) were also up-regulated under drought and heat stress conditions (Table 3).
qPCR also confirmed that thiamine thiazole synthase 2 (TTS2) in thiamine biosynthetic process, phosphomethylpyrimidine synthase (PMPS) in thiamine metabolic process, chloroplast stem-loop binding protein of 41 kDa b (CSLB41B) in positive regulation of translation, and calcium sensing receptor, chloroplastic (CSR) were down-regulated under drought and heat stresses. Several genes related to photosystem I and II and the location of chloroplast thylakoid were confirmed to be down-regulated under drought and heat stresses, including NAD(P)H-quinone oxidoreductase subunit 5 (NQO5), oxygen-evolving enhancer protein 1 (OEE1), peptidyl-prolyl cis-trans isomerase (CYP37), photosynthetic NDH subunit of luminal location 1 (PNL1), photosystem I reaction center subunit IV (PI4), photosystem II core complex protein (PSBY), protein CURVATURE THYLAKOID 1 A (CUR1A), protein LOW PSII ACCUMULATION 1 (LOW1), PsbP domain-containing protein 3 (PSBP3), and Rhodanese-like domain-containing protein 4 (RHO4) (Table 3).
Overall, when comparing gene expression patterns detected by RNA-seq and qRT-PCR, the Pearson’s correlation for transcriptional regulation (log2 fold change) under drought stress between RNA-seq and qRT-PCR is 0.83, and the Pearson’s correlation under heat stress between RNA-seq and qRT-PCR is 0.76 (Table 3).
Discussion
As previously reported, large number of genes are responsive to either drought or heat stress (see Introduction). This study focused on the comparative analysis of transcriptome profiles of A. stolonifera exposed to drought and heat stress with the intention to identify genes commonly regulated by heat and drought stress or responsive to both stresses in the same patterns. Among the total of 2132 and 3680 drought- and heat-responsive genes, 1482 genes were commonly regulated by heat and drought, including 670 up-regulated and 812 down-regulated genes. Those commonly-regulated genes by heat and drought stress may play roles in plant adaptation to both stresses in terms of the biological functions and common metabolic pathways, as discussed in details below.
The most enriched GO term in commonly up-regulated transcripts in BP was oxylipin biosynthetic process (GO:0031408, Fig. 3, Table 1). Further analysis showed that these commonly up-regulated transcripts in A. stolonifera under drought and heat stresses are lipoxygenase 1 (LOX1) and patatin-like protein 2 (PAT2), which are both involved in oxylipin biosynthetic process. Oxylipins, such as jasmonic acid (JA), methyl jasmonate (MeJA), and traumatin, catalyzed from linoleic or linolenic acid, have been implicated in a variety of physiological processes, plant pathogen resistance and abiotic stress responses28,29. Lipoxygenases (LOXs, EC1.13.11.12) are a group of non-heme iron-containing dioxygenases, which serve in the initial step of degradations of free fatty acids and esterified lipids via LOX pathway; the LOX proteins add an oxygen to either end of a (Z,Z)-1,4-pentadiene system of polyunsaturated fatty acids to produce an unsaturated fatty acid hydroperoxide30. Under drought stress, LOX enzyme activity increased in olive tree (Olea europaea)31, but decreased in chive (Allium schoenoprasum)32. Enhanced LOX activities were found in Phalaenopsis33 and wheat (Triticum aestivum)34 under heat stress, which were considered to be correlated with ROS accumulation, lipid peroxidation, and increase of cytoplasmic lipid droplets. Patatin was originally defined as the major storage protein, which accounted for 40% of total soluble protein in potato (Solanum tuberosum) tubers35. Patatin was also found to exhibit lipid acyl hydrolase (LAH) activity36, and has been proven to be transcriptionally regulated by drought stress37. A few studies found that patatin-like transcript levels were stimulated upon drought stress38–40. Under heat stress, accumulation of patatin protein was reduced in potato41. However, a recent RNA-seq study of green algae Chlamydomonas reinhardtii found that transcription level of patatin lipid acylhydrolase was significantly up-regulated by heat stress42. In this study, the commonly-upregulated LOX and PAT2 by heat and drought suggested the important of those two genes for plant tolerance to both stresses, although the underlying mechanisms deserve further investigation.
The transcript level of delta-1-pyrroline-5-carboxylate synthase (P5CS) in proline biosynthetic process was also significantly up-regulated by drought and heat stress (Fig. 3, Table 1). Proline is well-known for its role as an osmolyte for osmotic adjustment, a nitrogen and carbon provider, a source of energy, a metal chelator and a signal molecule, and is also involved in stabilizing cell membranes and proteins, scavenging free radicals, balancing redox potential, as well as functioning as a protein-compatible hydrotrope, alleviating acidosis, and maintaining NADP+/NADPH ratios43–46. P5CS catalyzes the first two committing step of proline biosynthesis, reducing glutamate to glutamate-semialdehyde47. P5CS protein is encoded by two genes, P5CS1 and P5CS2, in which P5CS1 could be induced by drought and salt stresses, and P5CS2 is apparently a housekeeping gene for basic proline metabolism48–51. The available literature reporting the effects of heat stress on P5CS transcript levels or enzymatic activities varied with the severity or duration of heat stress. P5CS enzyme activity in sorghum (Sorghum bicolor) seedlings was found to be induced upon short-term heat stress (6 h at 40 °C)52, but inhibited under long-term heat stress, such as in wheat (5 d at 33 °C)53, and tomato (Solanum lycopersicum) (48 h at 35 °C)54. Similarly, transcript levels of P5CS were up-regulated by short-term heat stress in Nitraria tangutorum (6 h at 50 °C)55, but down-regulated by long- term heat stress in peach (Prunus persica) (5 d at 36.7 °C)56. The common up-regulation of proline synthesis by both long-term (21 d) heat and drought stress in this study suggested the importance of P5CS regulation of proline synthesis in A. stolonifera adaptation to prolonged heat and drought stress.
Among commonly down-regulated transcripts by heat and drought stress, thiamine thiazole synthase 2 (TTS2) and phosphomethylpyrimidine synthase (PMPS) are both involved in thiamine biosynthetic pathway (GO:0009228), thiamine-containing compound biosynthetic pathway (GO:0042724), and thiamin metabolic pathway (GO:0006772), which are highly enriched in GO term enrichment analysis (Fig. 5, Table 2). Thiamine (Vitamin B1) in plants plays a fundamental role as an enzymatic cofactor in glycolysis, pentose phosphate pathway, and tricarboxylic acid cycle and is involved in amino acid and nonmevalonate isoprenoid biosynthesis57. It was recently reported to regulate cellular tolerance to DNA damages and serves as activators for pathogen attacks in plants58,59, whereas its roles in abiotic stress tolerance are not well documented. The expression of thiamine thiazole synthase (THI1/THI4), and phosphomethylpyrimidine synthase (THIC) gene, was transiently induced by osmotic stress, but the transient induction could be alleviated, or even reversed, by increasing stress duration or severity60–62. The THI1 protein abundance and mRNA level were also reported to be increased under heat stress in several plant species63–65. The transient elevation of such protein abundances and transcript levels in response to stresses could be possibly due to its involvement in DNA protection or repair64. The down-regulation of TTS2 and PMPS involved in thiamin synthesis in A. stolonifera under drought and heat stress indicated the significance of thiamin in regulating plant responses to both heat and drought stress in perennial grass species.
Drought and heat stresses caused significant down-regulation of calcium sensing receptor (CSR), which is involved in cellular component of chloroplast and photosystem in GO term enrichment analysis (Fig. 6, Table 2). Calcium sensing receptor is a chloroplast protein localized in the thylakoid membrane, bearing a calcium-binding acidic N-terminal and a rhodanese domain C-terminal66,67. Previous studies have shown that calcium sensing receptor positively regulates stomatal closure and photosynthetic electron transport, which is important for drought avoidance68–70. However, previous literatures of plant calcium sensing upon heat stress mainly focused on calcium channels and calmodulins, with little information about CSR71–74. The common down-regulation of CSR in A. stolonifera by drought and heat stress suggested the suppression of calcium sensing involving CSR for perennial grass responses to heat and drought stress, although further studies needed to explore the underlying mechanisms for CSR as a negative regulator for drought and heat responses.
Materials and Methods
Plant materials and growth conditions
Tillers of A. stolonifera (‘Penncross’) were collected from stock plants and transferred to plastic containers (57 × 44 × 30 cm, 12 drainage holes) filled with fritted clay medium (Profile Products, Deerfield, IL). Each container was planted with 30 tillers. Plants were established from tillers for 35 d in a greenhouse with average temperature of 23/20 °C (day/night), 60% relative humidity (RH), and 750 µmol m-2 s-1 photosynthetically active radiation (PAR) from natural sunlight and supplemental lighting. Plants were irrigated daily, fertilized twice per week with half-strength Hoagland’s nutrient solution75, and trimmed to the canopy height of 2 cm once per week during establishment. Plants were not trimmed during the final week of establishment to allow for sufficient regrowth prior to stress imposition, after which time all plants were transferred to controlled-environment growth chambers (Environmental Growth Chamber, Chagrin Falls, Ohio). Plants were maintained in controlled-environment growth chambers controlled at 22/18 °C (day/night), 600 µmol m-2 s-1 PAR, 60% RH, and 14-h photoperiod for one week prior to stress imposition.
Stress treatments and experimental design
For heat stress, air temperature was controlled at 35/30 °C (day/night) for 21 d. For drought stress, plants were withheld from irrigation for 21 d at 22/18 °C (day/night). For the non-stress control, plants were watered every other day and maintained at 22/18 °C (day/night). Each treatment was repeated in four containers containing multiple plants or had four biological replicates. The treatments were conducted in four growth chambers.
Physiological measurements
Leaf relative water content (RWC) and electrolyte leakage (EL) were measured at 0, 7, 14 and 21 d of heat or drought stress to assess physiological responses. Approximately 0.8 g fresh leaf tissues were collected from four individual plants per container, and then pooled for RWC and EL measurements. For RWC, approximately 0.2 g of leaf blades were first weighed for fresh weight (FW), soaked in water for 12 h and again weighed for turgid weight (TW), dried in an oven at 80 °C for 3 d, and finally weighed for dry weight (DW). RWC was calculated using the formula (%) = ([FW − DW]/[TW − DW]) × 10076. For EL, approximately 0.2 g of fresh leaf tissue was rinsed with deionized water, placed in a test tube containing 30 mL deionized water, agitated on a conical shaker for 12 h, and initial conductance (Ci) measured using a conductivity meter (YSI Model 32, Yellow Springs, OH). Tubes containing leaf tissue were then autoclaved at 121 °C for 20 min and then agitated for 12 h. The maximal conductance (Cmax) of incubation solution was then measured and EL (%) was calculated as ((Ci/Cmax) × 100)77. Four biological replicates (n = 4) were performed for each parameter under either control or stress condition, respectively. Statistical differences between treatment means were separated by Student’s t-test at the P level of 0.05.
RNA extraction, library preparation, and RNA sequencing
Total RNA was extracted from 200 mg of leaf samples collected at 21 d of stress when most significant physiological effects of heat or drought stress were present. The extraction was performed using TRIzol reagent (Life Technologies, Grand Island, NY), and treated with TURBO DNA-free kit (Life Technologies, Grand Island, NY). The quality and quantity of RNA was assessed in a NanoDrop 1000 spectrophotometer (Thermo Fisher Scientific, Waltham, MA). A total of 9 libraries (3 treatments × 3 biological replicates) were prepared for RNA-seq. Total RNA (2 μg) was used for construction of each library using the Illumina TruSeq RNA Library Prep Kit v2 (Illumina, San Diego, CA) according to the Low Sample (LS) protocol. LS protocol was amended to lower the Elute 2-Fragment-Prime 94 °C incubation time from 8 min to 1 min to generate larger RNA fragments. Indexes were chosen to allow for library multiplexing per run and libraries were pooled in an equimolar fashion. Pooled libraries were prepared for MiSeq run according to Illumina recommendations and loaded into a 600-cycle MiSeq Reagent Kit v3 cartridge (Illumina, San Diego, CA) at a concentration of 20 pM. Each run was set as pair-end (PE) 2 × 300 bp, fastq format only, and no adapter trimming.
De novo assembly, read quantification, gene expression differentiation and functional analysis
Raw reads from MiSeq sequencing were downloaded and analyzed using samtools command flagstat78. Reads were then assembled using Trinity79, with quality trimming using Trimmomatic option. The parameters were set as follows: “Trinity–max_memory 64G, –CPU 8, –bflyCPU 2, –bflyHeapSpaceMax 64G, –trimmomatic ILLUMINACLIP::2:30:15:8:TRUE SLIDINGWINDOW:4:20 LEADING:20 TRAILING:20 MINLEN:60 HEADCROP:6 CROP: 275”. Transcripts obtained were clustered using CDHITEST80, with the following parameters: “cd-hit-est -c 0.9, -n 8”. The transcripts were then quantified using RSEM81, which was incorporated as the “align_and_estimate_abundance.pl” script in Trinity program, using default parameters. Differential expression analysis of transcripts were performed using edgeR82, which was also nested in the “run_DE_analysis.pl” script in Trinity, using default parameters. The ratios of transcript abundances under stress conditions to control condition for each species were filtered with threshold of false discovery rate (FDR) < 0.001, in order to get differentially expressed genes (DEGs). In addition, the coding regions of transcript assemblies were identified using TransDecoder, and then annotated using Trinotate79.
Gene ontology (GO) term classification was performed by CateGOrizer83, using “GO_slim2” method. The GO enrichment analysis for DEGs was performed using GOEAST84, by implementing Customized Result Analysis for up- and down-regulated DEGs, respectively.
The transcriptome shotgun assembly of A. stolonifera were deposited at GenBank Transcriptome Shotgun Assembly (TSA) database, under the accession of GFJH00000000. The version described in this paper is the first version, GFJH01000000.
Validation of gene expression levels
Gene expression levels were also measured by quantitative reverse transcriptase-polymerase chain reaction (qRT-PCR). Total RNA was isolated from ground leaf powder using TRIzol reagent (Life Technologies, Grand Island, NY) and treated with DNase (TURBO DNA-free kit; Life Technologies, Grand Island, NY) in order to remove contaminating genomic DNA. Total RNA (2 μg) was reverse-transcribed using a high-capacity cDNA reverse transcription kit (Life Technologies, Grand Island, NY). The synthesized cDNA was amplified in a StepOnePlus Real-Time PCR system (Life Technologies, Grand Island, NY) using the following parameters: pre-heat cycle of 95 °C for 3 min, 40 cycles of 95 °C denaturation for 30 sec per cycle, and 60 °C annealing/extension for 30 sec per cycle. Power SYBR Green PCR Master Mix (Life Technologies, Grand Island, NY) was the intercalating dye used to detect gene expression level. Gene name, accession number, forward and reverse primer sequences are provided in Table 4. A melting curve analysis was performed for each primer set to confirm its specificity. Actin was used as the reference gene, since its expression was consistent throughout treatments. A ΔΔCt method was used to calculate the relative expression level between genes of interest and reference gene, respectively85. Four biological replicates (n = 4) were performed for each gene under either control or stress conditions, respectively. Statistical differences between treatment means were separated by Student’s t-test at the P level of 0.05.
Table 4.
Primer sequences of genes used in qRT-PCR. Gene names and transcript IDs are also listed.
| Gene | ID | Primer sequence | |
|---|---|---|---|
| Up-regulation | |||
| Linoleate 9S-lipoxygenase 1 (LOX1) | TRINITY_DN120383_c6_g1 | Forward | GAGCATCATTGGAGTGTCTG |
| Reverse | CCTTCTTTGCCTTGTCATCT | ||
| Patatin-like protein 2 (PLP2) | TRINITY_DN103758_c0_g1 | Forward | GCTTGTTTCGGTCCTACTAC |
| Reverse | GCCAGGTTCCAGAAGAAAG | ||
| Delta-1-pyrroline-5-carboxylate synthase (P5CS) | TRINITY_DN114921_c0_g21 | Forward | GGAGGACCCTATTTCCCATA |
| Reverse | GCATCAGGACGAGATTCAAA | ||
| 9-cis-epoxycarotenoid dioxygenase 1 (NCED1) | TRINITY_DN119819_c3_g2 | Forward | CCTCTCTCCCTATCCCTAATC |
| Reverse | CACTAGTTGGTTTCTGTCCATA | ||
| 3-ketoacyl-CoA synthase 11 (KCS11) | TRINITY_DN100275_c1_g2 | Forward | GGCCTAAATGGAATCGTCTAA |
| Reverse | TTGCGGTCGACTGAATAAC | ||
| Down-regulation | |||
| Thiamine thiazole synthase 2 (TTS2) | TRINITY_DN113085_c9_g20 | Forward | GCCTATGAACAAGACGCTAAAC |
| Reverse | AACGAGGTCCTTCTCCTTTG | ||
| Phosphomethylpyrimidine synthase (PMPS) | TRINITY_DN116433_c3_g10 | Forward | GATTGGACTCCCGAAGATAAG |
| Reverse | GTACAGCATCTCCTCTGTTATG | ||
| Chloroplast stem-loop binding protein of 41 kDa b (CSLB41B) | TRINITY_DN109357_c3_g19 | Forward | TCTCCAGCTTTCCCTTGT |
| Reverse | CGAACCTGGAACAGTTCATC | ||
| Calcium sensing receptor (CSR) | TRINITY_DN99853_c0_g1 | Forward | CCGACATTTGCGGTGTT |
| Reverse | CTGAAGTTCCAACTCTTGTTCT | ||
| NAD(P)H-quinone oxidoreductase subunit 5 (NQO5) | TRINITY_DN94571_c0_g1 | Forward | CAGCCCAAGCGTCTTAAT |
| Reverse | ACTGAAACGATTGCCATTATTC | ||
| Oxygen-evolving enhancer protein 1 (OEE1) | TRINITY_DN98821_c7_g1 | Forward | GCCGCGCATAGATAACA |
| Reverse | CCATGTCTGTGCCACTT | ||
| Peptidyl-prolyl cis-trans isomerase CYP37 | TRINITY_DN103314_c0_g1 | Forward | GGACGGAGGGAGTACTATTTA |
| Reverse | GCACTTGTGCCCTGTATAA | ||
| Photosynthetic NDH subunit of luminal location 1 (PNL1) | TRINITY_DN92658_c0_g1 | Forward | CAGTCCAGCAGCAAGATAG |
| Reverse | CCATTCAACCTGCCAGTAA | ||
| Photosystem I reaction center subunit IV (PI4) | TRINITY_DN96282_c3_g3 | Forward | CGATCGAGAAACTATCGAACTC |
| Reverse | CTTACGGACAGACACCTTTG | ||
| Photosystem II core complex protein psbY (PSBY) | TRINITY_DN108240_c2_g3 | Forward | AGGAACAAGATTAGAGAGTATGC |
| Reverse | TCCTCGTCGTTGTAGTGT | ||
| Protein CURVATURE THYLAKOID 1 A (CUR1A) | TRINITY_DN86325_c0_g2 | Forward | ACGCTGAACAACAAGTAGG |
| Reverse | CTGGTACAGAGGACGAGTAA | ||
| Protein LOW PSII ACCUMULATION 1 (LOW1) | TRINITY_DN106211_c1_g1 | Forward | AGAGAGAGAGAGAGAGAGAGA |
| Reverse | GGCAAGAAGTGATGATGATAGA | ||
| PsbP domain-containing protein 3 (PSBP3) | TRINITY_DN95645_c0_g2 | Forward | GCGTCCTCCTCTCTTCT |
| Reverse | AACTTGTTGGCCTCATCC | ||
| Rhodanese-like domain-containing protein 4 (RHO4) | TRINITY_DN108472_c0_g2 | Forward | AGAATGTCCTCTCCTCTAGATAC |
| Reverse | TTTCTCCATATGCGAACTATCC | ||
| ACTIN | Internal reference | Forward | CCTTTTCCAGCCATCTTTCA |
| Reverse | GAGGTCCTTCCTGATATCCA | ||
Conclusions
In summary, comparative transcriptomic analysis of A. stolonifera between drought and heat stress found 670 up-regulated and 812 down-regulated DEGs. Transcriptional regulations of DEGs that are responsive to both heat and drought stresses include up-regulation of genes in oxylipin biosynthetic process, proline biosynthetic process; and down-regulations of genes in thiamine metabolic process and calcium sensing receptor, which is summarized in Fig. 8. These commonly regulated genes identified in A. stolonifera could be potential candidate genes for genetic modification of cultivated grass species for improving both heat and drought tolerance, although the direct relationship of those genes and the associated pathways contributing to plant tolerance to both heat and drought tolerance requires further investigation.
Figure 8.

A comprehensive overview of transcriptional regulations under drought and heat stress in A. stolonifera.
Electronic supplementary material
Acknowledgements
Thanks go to the New Jersey Agricultural Experiment Station and Center for Turfgrass Science at Rutgers University for funding support.
Author Contributions
Y.X. and B.H. conceived and designed the experiments; Y.X. performed the experiments; Y.X. analyzed the data; B.H. contributed reagents/materials/analysis tools; Y.X. and B.H. wrote the paper.
Competing Interests
The authors declare no competing interests.
Footnotes
Publisher's note: Springer Nature remains neutral with regard to jurisdictional claims in published maps and institutional affiliations.
Electronic supplementary material
Supplementary information accompanies this paper at 10.1038/s41598-018-33597-3.
References
- 1.Craufurd P, Flower D, Peacock J. Effect of heat and drought stress on sorghum (Sorghum bicolor). I. Panicle development and leaf appearance. Exp. Agric. 1993;29:61–76. doi: 10.1017/S001447970002041X. [DOI] [Google Scholar]
- 2.Savin R, Nicolas ME. Effects of short periods of drought and high temperature on grain growth and starch accumulation of two malting barley cultivars. Funct. Plant Biol. 1996;23:201–210. [Google Scholar]
- 3.Perdomo P, Murphy JA, Berkowitz GA. Physiological changes associated with performance of Kentucky bluegrass cultivars during summer stress. HortScience. 1996;31:1182–1186. [Google Scholar]
- 4.Jagtap V, Bhargava S, Streb P, Feierabend J. Comparative effect of water, heat and light stresses on photosynthetic reactions in Sorghum bicolor (L.) Moench. J. Exp. Bot. 1998;49:1715–1721. [Google Scholar]
- 5.Jiang Y, Huang B. Drought and heat stress injury to two cool-season turfgrasses in relation to antioxidant metabolism and lipid peroxidation. Crop Sci. 2001;41:436–442. doi: 10.2135/cropsci2001.412436x. [DOI] [Google Scholar]
- 6.Silva EN, et al. Photosynthetic changes and protective mechanisms against oxidative damage subjected to isolated and combined drought and heat stresses in Jatropha curcas plants. J. Plant Physiol. 2010;167:1157–1164. doi: 10.1016/j.jplph.2010.03.005. [DOI] [PubMed] [Google Scholar]
- 7.Carmo-Silva AE, et al. Decreased CO2 availability and inactivation of Rubisco limit photosynthesis in cotton plants under heat and drought stress in the field. Environ. Exp. Bot. 2012;83:1–11. doi: 10.1016/j.envexpbot.2012.04.001. [DOI] [Google Scholar]
- 8.Mittler R. Abiotic stress, the field environment and stress combination. Trends Plant Sci. 2006;11:15–19. doi: 10.1016/j.tplants.2005.11.002. [DOI] [PubMed] [Google Scholar]
- 9.Zandalinas SI, Mittler R, Balfagón D, Arbona V, Gómez‐Cadenas A. Plant adaptations to the combination of drought and high temperatures. Physiol. Plant. 2018;162:2–12. doi: 10.1111/ppl.12540. [DOI] [PubMed] [Google Scholar]
- 10.Kakumanu A, et al. Effects of drought on gene expression in maize reproductive and leaf meristem tissue revealed by RNA-Seq. Plant Physiol. 2012;160:846–867. doi: 10.1104/pp.112.200444. [DOI] [PMC free article] [PubMed] [Google Scholar]
- 11.Liu Z, et al. Temporal transcriptome profiling reveals expression partitioning of homologous genes contributing to heat and drought acclimation in wheat (Triticum aestivum L.) BMC Plant Biol. 2015;15:152. doi: 10.1186/s12870-015-0511-8. [DOI] [PMC free article] [PubMed] [Google Scholar]
- 12.Bowman MJ, et al. RNA-Seq transcriptome profiling of upland cotton (Gossypium hirsutum L.) root tissue under water-deficit stress. PLoS One. 2013;8:e82634. doi: 10.1371/journal.pone.0082634. [DOI] [PMC free article] [PubMed] [Google Scholar]
- 13.Hübner S, Korol AB, Schmid KJ. RNA-Seq analysis identifies genes associated with differential reproductive success under drought-stress in accessions of wild barley Hordeum spontaneum. BMC Plant Biol. 2015;15:134. doi: 10.1186/s12870-015-0528-z. [DOI] [PMC free article] [PubMed] [Google Scholar]
- 14.Fracasso A, Trindade LM, Amaducci S. Drought stress tolerance strategies revealed by RNA-Seq in two sorghum genotypes with contrasting WUE. BMC Plant Biol. 2016;16:115. doi: 10.1186/s12870-016-0800-x. [DOI] [PMC free article] [PubMed] [Google Scholar]
- 15.Chen W, et al. Identification and comparative analysis of differential gene expression in soybean leaf tissue under drought and flooding stress revealed by RNA-Seq. Front. Plant Sci. 2016;7:1044. doi: 10.3389/fpls.2016.01044. [DOI] [PMC free article] [PubMed] [Google Scholar]
- 16.Min L, et al. Sugar and auxin signaling pathways respond to high-temperature stress during anther development as revealed by transcript profiling analysis in cotton. Plant Physiol. 2014;164:1293–1308. doi: 10.1104/pp.113.232314. [DOI] [PMC free article] [PubMed] [Google Scholar]
- 17.Frey FP, Urbany C, Hüttel B, Reinhardt R, Stich B. Genome-wide expression profiling and phenotypic evaluation of European maize inbreds at seedling stage in response to heat stress. BMC Genomics. 2015;16:123. doi: 10.1186/s12864-015-1282-1. [DOI] [PMC free article] [PubMed] [Google Scholar]
- 18.Wu L, et al. Five pectinase gene expressions highly responding to heat stress in rice floral organs revealed by RNA-seq analysis. Biochem. Biophys. Res. Commun. 2015;463:407–413. doi: 10.1016/j.bbrc.2015.05.085. [DOI] [PubMed] [Google Scholar]
- 19.Lukoszek R, Feist P, Ignatova Z. Insights into the adaptive response of Arabidopsis thaliana to prolonged thermal stress by ribosomal profiling and RNA-Seq. BMC Plant Biol. 2016;16:221. doi: 10.1186/s12870-016-0915-0. [DOI] [PMC free article] [PubMed] [Google Scholar]
- 20.Bhardwaj AR, et al. Global insights into high temperature and drought stress regulated genes by RNA-Seq in economically important oilseed crop Brassica juncea. BMC Plant Biol. 2015;15:9. doi: 10.1186/s12870-014-0405-1. [DOI] [PMC free article] [PubMed] [Google Scholar]
- 21.Xu C, Huang B. Root proteomic responses to heat stress in two Agrostis grass species contrasting in heat tolerance. J. Exp. Bot. 2008;59:4183–4194. doi: 10.1093/jxb/ern258. [DOI] [PMC free article] [PubMed] [Google Scholar]
- 22.Choi Y-S, et al. Overexpression of Arabidopsis ABF3 gene confers enhanced tolerance to drought and heat stress in creeping bentgrass. Plant biotechnology reports. 2013;7:165–173. doi: 10.1007/s11816-012-0245-0. [DOI] [Google Scholar]
- 23.Jespersen D, Belanger FC, Huang B. Candidate genes and molecular markers associated with heat tolerance in colonial Bentgrass. PLoS One. 2017;12:e0171183. doi: 10.1371/journal.pone.0171183. [DOI] [PMC free article] [PubMed] [Google Scholar]
- 24.Ma Y, Shukla V, Merewitz EB. Transcriptome analysis of creeping bentgrass exposed to drought stress and polyamine treatment. PLoS One. 2017;12:e0175848. doi: 10.1371/journal.pone.0175848. [DOI] [PMC free article] [PubMed] [Google Scholar]
- 25.Jiang H-Y, Zhang J-L, Yang J-W, Ma H-L. Transcript Profiling and Gene Identification Involved in the Ethylene Signal Transduction Pathways of Creeping Bentgrass (Agrostis stolonifera) during ISR Response Induced by Butanediol. Molecules. 2018;23:706. doi: 10.3390/molecules23030706. [DOI] [PMC free article] [PubMed] [Google Scholar]
- 26.Xu, Y., Burgess, P. & Huang, B. Transcriptional regulation of hormone‐synthesis and signaling pathways by overexpressing cytokinin‐synthesis contributes to improved drought tolerance in creeping bentgrass. Physiol. Plant (2017). [DOI] [PubMed]
- 27.Xu Y, Huang B. Transcriptomic analysis reveals unique molecular factors for lipid hydrolysis, secondary cell-walls and oxidative protection associated with thermotolerance in perennial grass. BMC Genomics. 2018;19:70. doi: 10.1186/s12864-018-4437-z. [DOI] [PMC free article] [PubMed] [Google Scholar]
- 28.Siedow JN. Plant lipoxygenase: structure and function. Annu. Rev. Plant Biol. 1991;42:145–188. doi: 10.1146/annurev.pp.42.060191.001045. [DOI] [Google Scholar]
- 29.Feussner I, Wasternack C. The lipoxygenase pathway. Annu. Rev. Plant Biol. 2002;53:275–297. doi: 10.1146/annurev.arplant.53.100301.135248. [DOI] [PubMed] [Google Scholar]
- 30.Brash AR. Lipoxygenases: occurrence, functions, catalysis, and acquisition of substrate. J. Biol. Chem. 1999;274:23679–23682. doi: 10.1074/jbc.274.34.23679. [DOI] [PubMed] [Google Scholar]
- 31.Sofo A, Dichio B, Xiloyannis C, Masia A. Lipoxygenase activity and proline accumulation in leaves and roots of olive trees in response to drought stress. Physiol. Plant. 2004;121:58–65. doi: 10.1111/j.0031-9317.2004.00294.x. [DOI] [PubMed] [Google Scholar]
- 32.Egert M, Tevini M. Influence of drought on some physiological parameters symptomatic for oxidative stress in leaves of chives (Allium schoenoprasum) Environ. Exp. Bot. 2002;48:43–49. doi: 10.1016/S0098-8472(02)00008-4. [DOI] [Google Scholar]
- 33.Ali MB, Hahn E-J, Paek K-Y. Effects of temperature on oxidative stress defense systems, lipid peroxidation and lipoxygenase activity in. Phalaenopsis. Plant Physiol. Biochem. 2005;43:213–223. doi: 10.1016/j.plaphy.2005.01.007. [DOI] [PubMed] [Google Scholar]
- 34.Babenko L, Kosakivska I, Akimov YuA KD, Skaternya T. Еffect of temperature stresses on pigment content, lipoxygenase activity and cell ultrastructure of winter wheat seedlings. Genet. Plant Physiol. 2014;4:117–125. [Google Scholar]
- 35.Mignery GA, Pikaard CS, Park WD. Molecular characterization of the patatin multigene family of potato. Gene. 1988;62:27–44. doi: 10.1016/0378-1119(88)90577-X. [DOI] [PubMed] [Google Scholar]
- 36.Andrews D, Beames B, Summers M, Park W. Characterization of the lipid acyl hydrolase activity of the major potato (Solanum tuberosum) tuber protein, patatin, by cloning and abundant expression in a baculovirus vector. Biochem. J. 1988;252:199. doi: 10.1042/bj2520199. [DOI] [PMC free article] [PubMed] [Google Scholar]
- 37.Scherer GF, Ryu SB, Wang X, Matos AR, Heitz T. Patatin-related phospholipase A: nomenclature, subfamilies and functions in plants. Trends Plant Sci. 2010;15:693–700. doi: 10.1016/j.tplants.2010.09.005. [DOI] [PubMed] [Google Scholar]
- 38.Matos AR, et al. A novel patatin‐like gene stimulated by drought stress encodes a galactolipid acyl hydrolase. FEBS Lett. 2001;491:188–192. doi: 10.1016/S0014-5793(01)02194-9. [DOI] [PubMed] [Google Scholar]
- 39.Matos AR, et al. Effects of progressive drought stress on the expression of patatin‐like lipid acyl hydrolase genes in Arabidopsis leaves. Physiol. Plant. 2008;134:110–120. doi: 10.1111/j.1399-3054.2008.01123.x. [DOI] [PubMed] [Google Scholar]
- 40.Gigon A, Matos A-R, Laffray D, Zuily-Fodil Y, Pham-Thi A-T. Effect of drought stress on lipid metabolism in the leaves of Arabidopsis thaliana (ecotype Columbia) Ann. Bot. 2004;94:345–351. doi: 10.1093/aob/mch150. [DOI] [PMC free article] [PubMed] [Google Scholar]
- 41.Nowak J, Colborne D. In vitro tuberization and tuber proteins as indicators of heat stress tolerance in potato. American Potato Journal. 1989;66:35–45. doi: 10.1007/BF02853487. [DOI] [Google Scholar]
- 42.Légeret B, et al. Lipidomic and transcriptomic analyses of Chlamydomonas reinhardtii under heat stress unveil a direct route for the conversion of membrane lipids into storage lipids. Plant, Cell Environ. 2016;39:834–847. doi: 10.1111/pce.12656. [DOI] [PubMed] [Google Scholar]
- 43.Ashraf M, Foolad M. Roles of glycine betaine and proline in improving plant abiotic stress resistance. Environ. Exp. Bot. 2007;59:206–216. doi: 10.1016/j.envexpbot.2005.12.006. [DOI] [Google Scholar]
- 44.Verbruggen N, Hermans C. Proline accumulation in plants: a review. Amino Acids. 2008;35:753–759. doi: 10.1007/s00726-008-0061-6. [DOI] [PubMed] [Google Scholar]
- 45.Szabados L, Savoure A. Proline: a multifunctional amino acid. Trends Plant Sci. 2010;15:89–97. doi: 10.1016/j.tplants.2009.11.009. [DOI] [PubMed] [Google Scholar]
- 46.Amini S, Ghobadi C, Yamchi A. Proline accumulation and osmotic stress: an overview of P5CS gene in plants. Journal of Plant Molecular Breeding. 2015;3:44–55. [Google Scholar]
- 47.Hu C, Delauney AJ, Verma D. A bifunctional enzyme (delta 1-pyrroline-5-carboxylate synthetase) catalyzes the first two steps in proline biosynthesis in plants. Proc. Natl. Acad. Sci. 1992;89:9354–9358. doi: 10.1073/pnas.89.19.9354. [DOI] [PMC free article] [PubMed] [Google Scholar]
- 48.Székely G, et al. Duplicated P5CS genes of Arabidopsis play distinct roles in stress regulation and developmental control of proline biosynthesis. Plant J. 2008;53:11–28. doi: 10.1111/j.1365-313X.2007.03318.x. [DOI] [PubMed] [Google Scholar]
- 49.Su M, et al. Cloning two P5CS genes from bioenergy sorghum and their expression profiles under abiotic stresses and MeJA treatment. Plant Sci. 2011;181:652–659. doi: 10.1016/j.plantsci.2011.03.002. [DOI] [PubMed] [Google Scholar]
- 50.Wang G, et al. Proline responding1 plays a critical role in regulating general protein synthesis and the cell cycle in maize. Plant Cell. 2014;26:2582–2600. doi: 10.1105/tpc.114.125559. [DOI] [PMC free article] [PubMed] [Google Scholar] [Retracted]
- 51.Kubala S, et al. Enhanced expression of the proline synthesis gene P5CSA in relation to seed osmopriming improvement of Brassica napus germination under salinity stress. J. Plant Physiol. 2015;183:1–12. doi: 10.1016/j.jplph.2015.04.009. [DOI] [PubMed] [Google Scholar]
- 52.Gosavi G, et al. Effect of heat stress on proline, chlorophyll content, heat shock proteins and antioxidant enzyme activity in sorghum (Sorghum bicolor) at seedlings stage. Indian J. Biotech. 2014;13:356–363. [Google Scholar]
- 53.Song S, Lei Y, Tian X. Proline metabolism and cross-tolerance to salinity and heat stress in germinating wheat seeds. Russian J. Plant Physiol. 2005;52:793–800. doi: 10.1007/s11183-005-0117-3. [DOI] [Google Scholar]
- 54.Rivero RM, et al. The combined effect of salinity and heat reveals a specific physiological, biochemical and molecular response in tomato plants. Plant, Cell Environ. 2014;37:1059–1073. doi: 10.1111/pce.12199. [DOI] [PubMed] [Google Scholar]
- 55.Zheng L, et al. Isolation and characterization of a Δ1-pyrroline-5-carboxylate synthetase (NtP5CS) from Nitraria tangutorum Bobr. and functional comparison with its Arabidopsis homologue. Mol. Biol. Rep. 2014;41:563–572. doi: 10.1007/s11033-013-2893-8. [DOI] [PubMed] [Google Scholar]
- 56.Shin H, Oh S, Arora R, Kim D. Proline accumulation in response to high temperature in winter-acclimated shoots of Prunus persica: a response associated with growth resumption or heat stress? Canadian J. Plant Sci. 2016;96:630–638. doi: 10.1139/cjps-2015-0372. [DOI] [Google Scholar]
- 57.Goyer A. Thiamine in plants: aspects of its metabolism and functions. Phytochemistry. 2010;71:1615–1624. doi: 10.1016/j.phytochem.2010.06.022. [DOI] [PubMed] [Google Scholar]
- 58.Ahn I-P, Kim S, Lee Y-H. Vitamin B1 functions as an activator of plant disease resistance. Plant Physiol. 2005;138:1505–1515. doi: 10.1104/pp.104.058693. [DOI] [PMC free article] [PubMed] [Google Scholar]
- 59.Ahn I-P, Kim S, Lee Y-H, Suh S-C. Vitamin B1-induced priming is dependent on hydrogen peroxide and the NPR1 gene in Arabidopsis. Plant Physiol. 2007;143:838–848. doi: 10.1104/pp.106.092627. [DOI] [PMC free article] [PubMed] [Google Scholar]
- 60.Rapala-Kozik M, Wolak N, Kujda M, Banas AK. The upregulation of thiamine (vitamin B 1) biosynthesis in Arabidopsis thaliana seedlings under salt and osmotic stress conditions is mediated by abscisic acid at the early stages of this stress response. BMC Plant Biol. 2012;12:2. doi: 10.1186/1471-2229-12-2. [DOI] [PMC free article] [PubMed] [Google Scholar]
- 61.Abidin AAZ, Wong S, Rahman NSA, Idris ZHC, Balia Yusof Z. Osmotic, oxidative and salinity stresses upregulate the expressions of thiamine (Vitamin B1) biosynthesis genes (THIC and THI1/THI4) in oil palm (Elaies guineensis) J. Oil Palm Res. 2016;28:308–319. doi: 10.21894/jopr.2016.2803.07. [DOI] [Google Scholar]
- 62.Yee WS, Aziz SDA, Yusof ZNB. Osmotic stress upregulates the transcription of thiamine (vitamin B1) biosynthesis genes (THIC and THI4) in oil palm (Elaies guineensis) Afric. J. Biotech. 2016;15:1566–1574. doi: 10.5897/AJB2016.15222. [DOI] [Google Scholar]
- 63.Lee DG, et al. A proteomic approach in analyzing heat‐responsive proteins in rice leaves. Proteomics. 2007;7:3369–3383. doi: 10.1002/pmic.200700266. [DOI] [PubMed] [Google Scholar]
- 64.Scafaro AP, Haynes PA, Atwell BJ. Physiological and molecular changes in Oryza meridionalis Ng., a heat-tolerant species of wild rice. J. Exp. Bot. 2009;61:191–202. doi: 10.1093/jxb/erp294. [DOI] [PMC free article] [PubMed] [Google Scholar]
- 65.Zhang Y, et al. Proteomic analysis of heat stress response in leaves of radish (Raphanus sativus L.) Plant Mol. Biol. Rep. 2013;31:195–203. doi: 10.1007/s11105-012-0486-7. [DOI] [Google Scholar]
- 66.Han S, Tang R, Anderson LK, Woerner TE, Pei Z-M. A cell surface receptor mediates extracellular Ca2+ sensing in guard cells. Nature. 2003;425:196. doi: 10.1038/nature01932. [DOI] [PubMed] [Google Scholar]
- 67.Nomura H, Komori T, Kobori M, Nakahira Y, Shiina T. Evidence for chloroplast control of external Ca2+‐induced cytosolic Ca2+ transients and stomatal closure. Plant J. 2008;53:988–998. doi: 10.1111/j.1365-313X.2007.03390.x. [DOI] [PubMed] [Google Scholar]
- 68.Wang W-H, Zheng H-L. Mechanisms for calcium sensing receptor-regulated stomatal closure in response to the extracellular calcium signal. Plant Signaling & Behavior. 2012;7:289–291. doi: 10.4161/psb.18882. [DOI] [PMC free article] [PubMed] [Google Scholar]
- 69.Wang W-H, et al. Regulation of the calcium-sensing receptor in both stomatal movement and photosynthetic electron transport is crucial for water use efficiency and drought tolerance in Arabidopsis. J. Exp. Bot. 2013;65:223–234. doi: 10.1093/jxb/ert362. [DOI] [PMC free article] [PubMed] [Google Scholar]
- 70.Zhao X, Xu M, Wei R, Liu Y. Expression of OsCAS (calcium-sensing receptor) in an Arabidopsis mutant increases drought tolerance. PLoS One. 2015;10:e0131272. doi: 10.1371/journal.pone.0131272. [DOI] [PMC free article] [PubMed] [Google Scholar]
- 71.Larkindale J, Knight MR. Protection against heat stress-induced oxidative damage in Arabidopsis involves calcium, abscisic acid, ethylene, and salicylic acid. Plant Physiol. 2002;128:682–695. doi: 10.1104/pp.010320. [DOI] [PMC free article] [PubMed] [Google Scholar]
- 72.Reddy AS, Ali GS, Celesnik H, Day IS. Coping with stresses: roles of calcium-and calcium/calmodulin-regulated gene expression. Plant Cell. 2011;23:2010–2032. doi: 10.1105/tpc.111.084988. [DOI] [PMC free article] [PubMed] [Google Scholar]
- 73.Finka A, Cuendet AFH, Maathuis FJ, Saidi Y, Goloubinoff P. Plasma membrane cyclic nucleotide gated calcium channels control land plant thermal sensing and acquired thermotolerance. Plant Cell. 2012;24:3333–3348. doi: 10.1105/tpc.112.095844. [DOI] [PMC free article] [PubMed] [Google Scholar]
- 74.Batistič O, Kudla J. Analysis of calcium signaling pathways in plants. BBA-Gen. Subjects. 2012;1820:1283–1293. doi: 10.1016/j.bbagen.2011.10.012. [DOI] [PubMed] [Google Scholar]
- 75.Hoagland, D. R. & Arnon, D. I. The water-culture method for growing plants without soil. Circ. Calif. Agric. Exp. Sta. 347 (1950).
- 76.Barrs H, Weatherley P. A re-examination of the relative turgidity technique for estimating water deficits in leaves. Australian J. Biol. Sci. 1962;15:413–428. doi: 10.1071/BI9620413. [DOI] [Google Scholar]
- 77.Blum A, Ebercon A. Cell-membrane stability as a measure of drought and heat tolerance in wheat. Crop Sci. 1981;21:43–47. doi: 10.2135/cropsci1981.0011183X002100010013x. [DOI] [Google Scholar]
- 78.Li H, et al. The sequence alignment/map format and SAMtools. Bioinformatics. 2009;25:2078–2079. doi: 10.1093/bioinformatics/btp352. [DOI] [PMC free article] [PubMed] [Google Scholar]
- 79.Haas BJ, et al. De novo transcript sequence reconstruction from RNA-seq using the Trinity platform for reference generation and analysis. Nat. Protoc. 2013;8:1494–1512. doi: 10.1038/nprot.2013.084. [DOI] [PMC free article] [PubMed] [Google Scholar]
- 80.Li W, Godzik A. Cd-hit: a fast program for clustering and comparing large sets of protein or nucleotide sequences. Bioinformatics. 2006;22:1658–1659. doi: 10.1093/bioinformatics/btl158. [DOI] [PubMed] [Google Scholar]
- 81.Li B, Dewey CN. RSEM: accurate transcript quantification from RNA-Seq data with or without a reference genome. BMC Bioinformatics. 2011;12:323. doi: 10.1186/1471-2105-12-323. [DOI] [PMC free article] [PubMed] [Google Scholar]
- 82.Robinson MD, McCarthy DJ, Smyth G. K. edgeR: a Bioconductor package for differential expression analysis of digital gene expression data. Bioinformatics. 2010;26:139–140. doi: 10.1093/bioinformatics/btp616. [DOI] [PMC free article] [PubMed] [Google Scholar]
- 83.Hu Z-L, Bao J, Reecy JM. CateGOrizer: a web-based program to batch analyze gene ontology classification categories. Online J. Bioinform. 2008;9:108–112. [Google Scholar]
- 84.Zheng Q, Wang X-J. GOEAST: a web-based software toolkit for Gene Ontology enrichment analysis. Nucleic Acids Res. 2008;36:W358–W363. doi: 10.1093/nar/gkn276. [DOI] [PMC free article] [PubMed] [Google Scholar]
- 85.Livak KJ, Schmittgen TD. Analysis of relative gene expression data using real-time quantitative PCR and the 2−ΔΔCT method. Methods. 2001;25:402–408. doi: 10.1006/meth.2001.1262. [DOI] [PubMed] [Google Scholar]
Associated Data
This section collects any data citations, data availability statements, or supplementary materials included in this article.