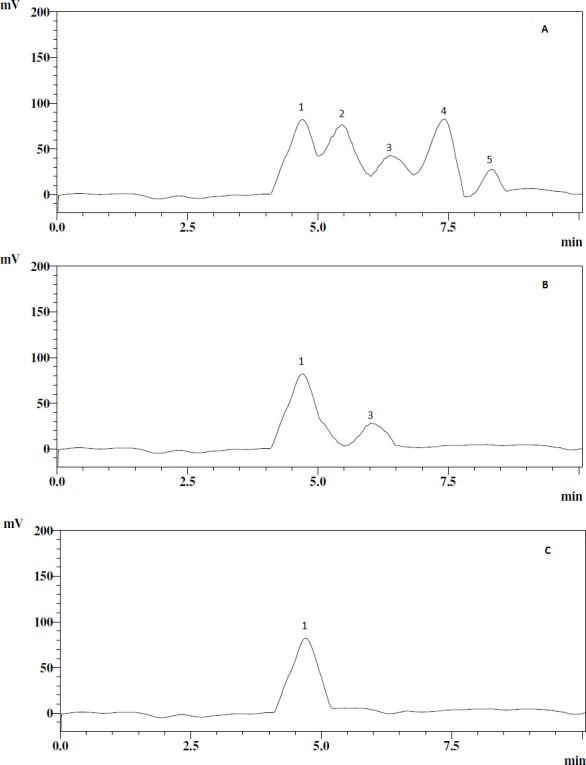
Figure 1. HPLC chromatograms of the EPS samples and standards.

(A) standards, (B) EPS-YO175, (C) EPS-OF101. The peaks correspond to glucose (peak 1), xylose (peak 2), galactose (peak 3), fructose (peak 4), rhamnose (peak 5).

(A) standards, (B) EPS-YO175, (C) EPS-OF101. The peaks correspond to glucose (peak 1), xylose (peak 2), galactose (peak 3), fructose (peak 4), rhamnose (peak 5).