Abstract
X-ray luminescence computed tomography (XLCT) is a hybrid molecular imaging modality that combines the merits of both x-ray imaging (high resolution) and optical imaging (high sensitivity). In this study, we have evaluated the sensitivity of XLCT with phantom experiments by scanning targets of different phosphor concentrations at different depths. We found that XLCT is capable of imaging targets of very low concentrations (27.6 μM or 0.01 mg/mL) at significant depths, such as 21 mm. Our results demonstrate that there is little variation in the reconstructed target size with a maximum target size error of 4.35% for different imaging depths for XLCT. We have for the first time, compared the sensitivity of XLCT with that of traditional computed tomography (CT) for phosphor targets. We found that XLCT’s use of x-ray induced photons provides much higher measurement sensitivity and contrast compared to CT which provides image contrast solely based on x-ray attenuation.
1. INTRODUCTION
One of the greatest contributions to medical imaging would be the discovery of x-rays in the late eighteen hundreds. Since the discovery, many x-ray imaging methods have been realized, including x-ray computed tomography (CT), which has emerged as one of the most commonly performed medical imaging procedures with over 70,000,000 exams performed annually [1]. The premise behind most x-ray imaging methods, including CT, is that as x-rays penetrate the body, there is modest scattering that occurs which allows for precise localizations of objects deep in tissue [2] and the resulting image contrast formed is due to the differential attenuation of the x-rays. The primary use of CT has been to provide high spatial resolution images of the anatomy. However, from the viewpoint of contrast agent based molecular imaging, CT has seen very limited use [3, 4]. Typical x-ray contrast agents are highly concentrated aqueous solutions (typically iodine-based), and thus cannot be employed for molecular imaging due to their high viscosity and limits on osmolality [5]. To further investigate the molecular imaging potentials for x-ray imaging, x-ray luminescence computed tomography (XLCT) has recently been studied and developed by several groups, including ours [2–4, 6–17].
In principle, XLCT uses x-ray photons to excite contrast agents that are usually based on rare-earth nanophosphors (e.g. Europium doped Gadolinium Oxysulfide - GOS: Eu3+ (GOS)) that emit visible and near-infrared (NIR) photons by a process called x-ray luminescence (or scintillation). The emitted photons can then be measured by sensitive photodetectors such as an electron multiplying charge-coupled device (EMCCD) camera and be used for subsequent image reconstruction. The x-ray beam size and position can be incorporated into the XLCT reconstruction algorithm as an anatomical guidance to overcome the strong optical scattering in deep tissues. Thus XLCT has potentials to achieve high spatial resolution [4]. In addition, thousands of low-energy optical photons are emitted per absorbed high-energy x-ray photon and are measured with very sensitive optical detectors, which makes XLCT a high sensitivity imaging modality [3, 6–7]. From experiments performed in [3], it was determined that the minimum detectable concentration was subpicomolar for superficial targets. In addition, XLCT has been demonstrated through numerical simulations in [6] to be able to image a 4.8 mm diameter and 1 mg/mL (27.6 mM) concentration GOS target and experimentally up to a scanning depth of 7.7 mm in [7]. These studies have shown the potentials of XLCT as a useful molecular imaging modality. However, so far there is no study on XLCT’s sensitivity of imaging x-ray excitable phosphor targets in deep turbid media.
For small-animal imaging studies, high-resolution (microscopic) x-ray computed tomography (micro-CT) systems have been developed and widely used to study models of human disease [18–19]. These systems are capable of providing the necessary resolving abilities required for small-animal research at generally a low-cost, and thus remain popular. However, since micro-CT systems operate under the same principles as conventional CT systems, they also suffer from the same limitations, including the lack of sensitivity for contrast agents. It should be noted, that for XLCT, with the addition of an x-ray detector to detect the traversed x-ray beam, it is possible to obtain anatomical images simultaneously with the x-ray luminescence; thus XLCT and CT are inherently co-registered [20].
To the best of our knowledge, there is no comparison study between CT and XLCT in imaging nanophosphor targets in deep turbid media. In this study, we will compare the sensitivity of two imaging modalities, XLCT and micro-CT, by performing phantom experiments to demonstrate the enhancement in sensitivity obtained from XLCT imaging than from micro-CT alone. Although most XLCT systems are designed with the ability to perform micro-CT imaging as well (since XLCT is multimodal), we will perform the CT scan with our dedicated micro-CT system.
The paper is organized as follows. In section 2, we present our experimental XLCT and micro-CT systems, XLCT forward modeling and image reconstruction algorithm, phantom experimental set-up, and image quality evaluation metrics. In section 3, we present the results from our phantom experiments. Lastly, in section 4, we discuss our results and conclude the paper.
2. METHODS
A. XLCT imaging system set-up
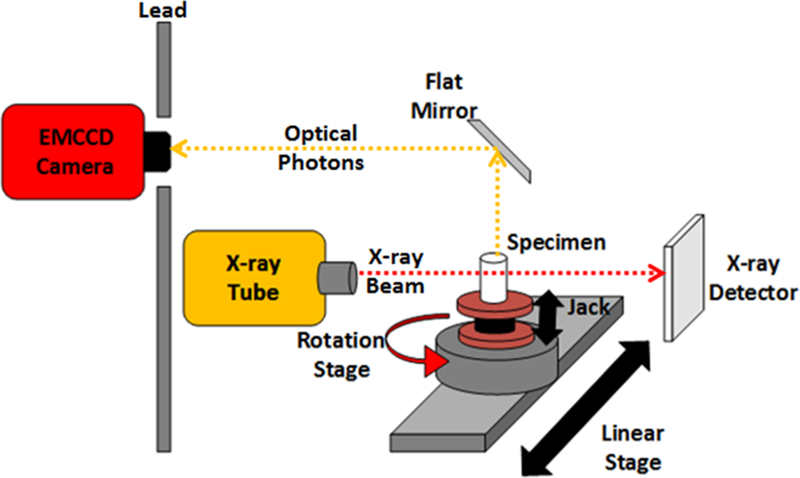
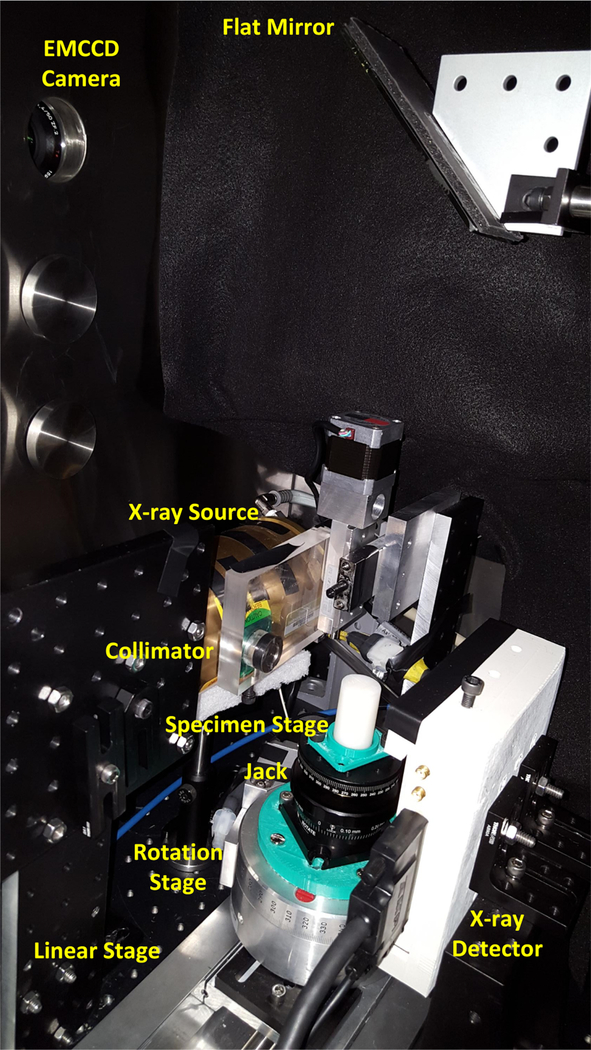
The XLCT system used was similar to the one described in [12–13] with the extra addition of a manual lab jack that allows us to adjust the x-ray scanning depth. A schematic and photograph of the XLCT system are shown in Figs. 1 and 2 respectively. In short, an x-ray tube (Neptune 5200, Oxford Instruments) generated x-ray photons with a maximum power of 100 W (50 kVp and 2.0 mA) which were then collimated with a lab-made collimator to provide a 1 mm diameter pencil beam. The phantom was placed approximately 50 mm away from the x-ray source on top of the manual lab jack (LJ750/M, Thorlabs) that allowed us to vary the x-ray beam scanning depth from 6 to 23 mm. The lab jack was fixed on top of a motorized rotary stage (B4872TS-ZR, Velmex Inc.) that was then fixed on a motorized linear stage (Unislide MA40, Velmex Inc.). The x-ray beam was detected by an x-ray detector (Shad-o-box 1024, Rad-Icon Imaging Corp.) fixed opposite of the x-ray source. A small portion of the emitted luminescent signal (photons) from the target propagated to the phantom top surface and were reflected by a flat mirror to be detected by a water-cooled EMCCD camera (C9100–13, Hamamatsu). The entire XLCT imaging system was fixed on an optical bench inside of a light-tight and x-ray shielding cabinet and was controlled by programs on a lab computer.
Figure 1.
Schematic of the XLCT system set-up.
Figure 2.
Photograph of the XLCT imaging system set-up.
B. micro-CT imaging system set-up
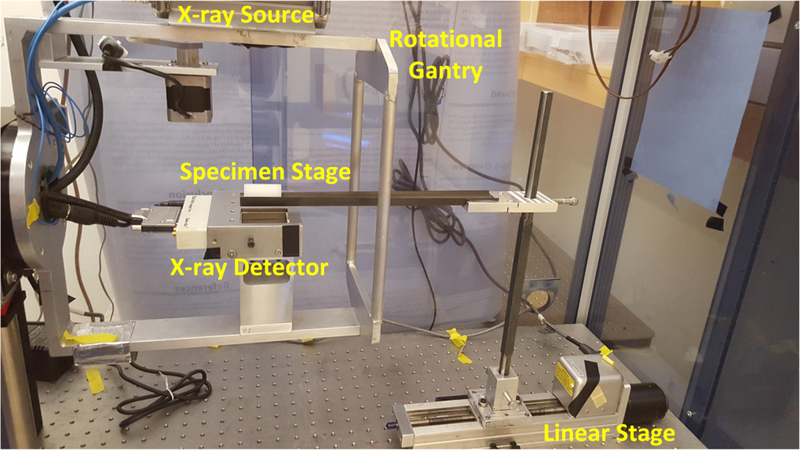
A photograph of our lab-made micro-CT system is shown in Fig. 3. The x-ray tube (Jupiter 5000, Oxford Instruments) generated x-ray photons with maximum power of 50 W (50 kVp and 1.0 mA) and was filtered with 0.4 mm thickness aluminum. The transmitted x-rays were detected by an x-ray detector (Shad-o-box 1024, Rad-Icon Imaging Corp.) Both the x-ray tube and detector were fixed to a rotational gantry that rotates from 0 to 360° during imaging to provide images at different projection angles. Between the x-ray source and detector, the sample to be imaged was placed on the sample stage which was then moved into the field-of-view of the x-ray detector by a motorized linear stage (Unislide MA25, Velmex Inc.). The entire system was fixed on an optical bench inside of an x-ray shielding cabinet and was controlled by programs on a lab computer. We used a cylindrical phantom embedded with small metal balls to calculate the system parameters of the micro-CT system such as the distance between the x-ray source and detector, following the approach described in [21]. To reconstruct the micro-CT images, a filtered back-projection algorithm was used with a Shepp-Logan filter.
Figure 3.
Photograph of the micro-CT imaging system set-up.
C. Forward modeling and image reconstruction algorithm for XLCT
As described in [6], the optical photon propagation inside turbid media was modeled by the continuous wave (CW) diffusion equation that was solved by the finite element method. The x-ray propagation and attenuation were modeled by an exponential function described in [13]. The image reconstruction algorithm used was the Majorization-Minimization algorithm with L1 regularization which has been developed in [22–25] for fluorescence molecular tomography (FMT) but adapted to solve the XLCT inverse problem. In addition, images from the x-ray detector were used to provide the x-ray pencil beam location as prior information during image reconstruction. While XLCT is a three-dimensional (3D) imaging modality, we only reconstructed the scanned transverse section of the phantom. To minimize the effects of the finite element mesh size on the XLCT reconstructed images, we discretized the transverse section using a 2D mesh with a pixel size of 200 × 200 μm2 and the system was interpolated to the fine grid. The forward models and the reconstruction algorithm were programmed with MATLAB (R2016b, MathWorks®) and ran on a calculation server with 128 GB memory and a 40-core CPU (each core frequency: 1200 MHz).
D. Phantom and target geometry
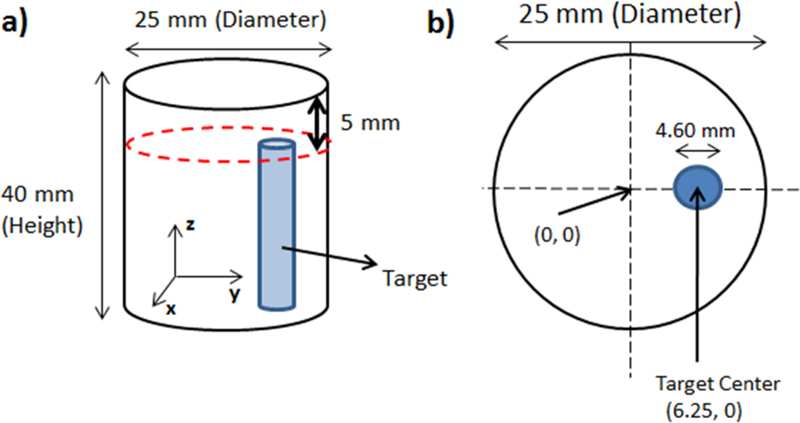
To evaluate the sensitivity of XLCT, we performed a set of cylindrical phantom experiments with four different phantoms, each containing a cylindrical target. The geometry of the phantom with its target is shown in Fig. 4. The cylindrical phantoms were 40 mm long and 25 mm in diameter and were composed of 1% intralipid and 2% agar containing a 4.60 mm off-center through-hole to embed the target as shown in Fig. 4b. The background contained no GOS particles. The cylindrical target had a diameter of 4.60 mm and a length of 35 mm and was composed of 1% intralipid, 2% agar, and the GOS nanophosphors. The target was inserted into the through-hole and then the remaining 5 mm was capped off with background material. For the four different experimental cases, the targets had a GOS concentration of 27.6 mM, 2.76 mM, 276 μM, and 27.6 μM, or 10, 1.0, 0.1, and 0.01 mg/mL, respectively. The optical properties of the phantom were estimated to have the absorption coefficient (μa) of0.0020 mm−1 and the reduced scattering coefficient (μs’) of 1.0 mm−1 at the wavelength of 703 nm, corresponding to the highest emission peak for GOS.
Figure 4.
Phantom geometry used in the experimental study. (a) Overall phantom geometry. (b) Top surface geometry.
To study the effects of optical absorbers such as ink on the sensitivity of XLCT, we also created a second set of phantoms, this time adding India ink as an absorber. These phantoms were estimated to have optical properties of μa = 0.007 mm−1 and μs’ = 1.0 mm−1 at the wavelength of 703 nm, which is close to the optical properties of tissue.
All of the cylindrical XLCT phantoms were fabricated following the procedure used in [26]. Briefly, the solution of agar and water were heated up to 95.0°C to dissolve the agar. The intralipid (and GOS for the target solution) was then added into the solution at 60°C (50°C for the GOS). Then, the liquid solution was placed into a mold and allowed to solidify at room temperature.
E. XLCT experimental scanning scheme
For all XLCT measurements, the EMCCD camera was operated at −92.50°C with an EM Gain and an analog gain of 255 and 5, respectively. The x-ray tube output was set to maximum (50 kVp, 2.0 mA, or 100 W) for all experiments as well. We took measurements from 6 angular projections with an angular step size of 30°. Since the diameter of the phantom was 25 mm, based on the size of the x-ray beam (1 mm), 25 linear steps were used to scan the entire phantom for each angular projection. For each linear step, one x-ray luminescence image was acquired from the phantom top surface. The EMCCD camera exposure time used for all cases is given in Table 1. The x-ray detector was used to determine the phantom boundary (start location for scanning). For each of the phantoms without India ink, to test the depth capabilities of XLCT for imaging, we took measurements at 4 different scanning depths (6, 11, 16, and 21 mm), which is the distance from the top surface of the phantom. For the phantoms with India ink, we only performed a single scan for each concentration at a scanning depth of 11 mm, which is close to the typical radius (or depth) of a mice torso.
Table 1.
XLCT Imaging EMCCD Camera Exposure Time
| Target Conc. | Scan Depth (mm) | Exposure Time (s) |
|---|---|---|
| No Ink | ||
| 27.6 mM (10 mg/mL) | ||
| 6 | 0.080 | |
| 11 | 0.300 | |
| 16 | 0.500 | |
| 21 | 2.000 | |
| 2.76 mM (1.0 mg/mL) | ||
| 6 | 0.080 | |
| 11 | 1.000 | |
| 16 | 2.000 | |
| 21 | 5.000 | |
| 276 μM (0.1 mg/mL) | ||
| 6 | 0.500 | |
| 11 | 2.000 | |
| 16 | 4.000 | |
| 21 | 5.000 | |
| 27.6 |μM (0.01 mg/mL) | ||
| 6 | 1.000 | |
| 11 | 5.000 | |
| 16 | 8.000 | |
| 21 | 10.000 | |
| Ink Phantoms | ||
| 27.6 mM | 11 | 0.080 |
| 2.76 mM | 11 | 0.500 |
| 276 μM | 11 | 1.000 |
| 27.6 μM | 11 | 3.000 |
To compare the sensitivity of XLCT to that of micro-CT, immediately after the XLCT data acquisition, each phantom was placed into our micro-CT system to perform a full CT scan. The x-ray tube output was set to 50 kVp and 0.33 mA (16.5 W) to avoid x-ray detector saturation. For the micro-CT scan, 180 projections with an angular step size of 2° were used and the x-ray detector exposure time was set to 500 ms.
F. XLCT image quality evaluation criteria
Two metrics were used in our evaluation of image quality:
Target Size Error (TSE): The TSE is defined as the percentage error between the reconstructed target and the true target’s diameter given by the following equation (1):
| (1) |
where Dr and Dt are the diameters of the reconstructed and true targets, respectively. In our calculation of Dr we used a line profile along the center of the reconstructed target and determined the diameter by using the full width tenth maximum (FWTM).
Dice Similarity Coefficient (DICE): The DICE is used for quantifying the shape and location accuracy between the reconstructed and true target regions and is defined as the ratio of the intersection to the average of two volumes [23–24] and is given by the following equation (2):
| (2) |
where ROIr is the reconstructed region of interest that is defined as the pixels whose intensities are at least 10% of the maximum reconstructed value and ROIt is the true target region. The closer the DICE is to 100%, the greater the similarity between the reconstructed and true target.
Besides the two criteria, we have also calculated the maximum and mean values in the target region of the reconstructed XLCT images. The target region was selected from the ground truth images according to the phantom geometry and the micro-CT scan. Both the reconstructed max and mean values have been normalized to their corresponding EMCCD camera exposure time (Table 1).
3. RESULTS
A. XLCT measurements
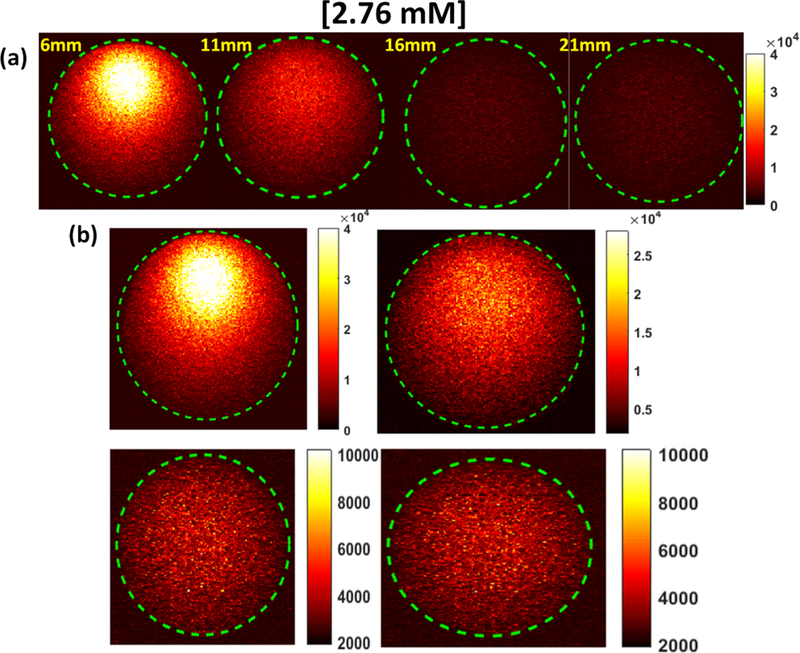
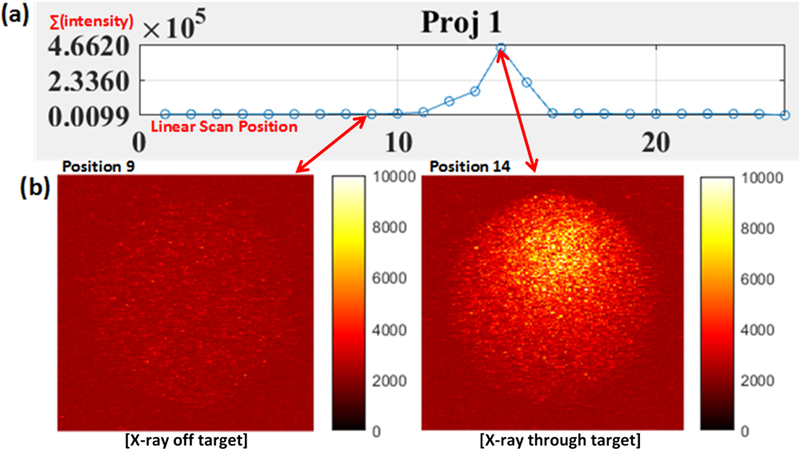
Before the XLCT image reconstruction, we analyzed the XLCT measurements on the top surface of the phantom to examine how the measurements changed for different target concentrations and different scanning depths. We captured the top surface optical signal from a single projection during which the target was closest to the x-ray source and the x-ray beam traversed the center of the target of concentration 2.76 mM (1.0 mg/mL), using an EMCCD camera exposure time of 500 ms for all cases for four different scan depths (6, 11, 16, and 21 mm). The raw measurements pictures are shown in Fig. 5 where the dotted green circle indicates the top surface boundary. The pictures in the top row (Fig. 5a) are plotted with the same color bar for comparison and the pictures in the bottom row (Fig. 5b) are plotted with their own color bar for better view. Fig. 5 indicates that there are sufficient optical photons that reach the top surface for the XLCT reconstruction for a target as deep as 21 mm. In Fig. 6a, the measurements from angular projection 1 for the phantom embedded with a 27.6 μM (0.01 mg/mL) GOS target are plotted. At each linear scan position (x-axis), the total intensity in the EMCCD camera image is summed up (y-axis). In Fig. 6b, the EMCCD camera images for positions 9 (left) and 14 (right) are shown to demonstrate the difference in the signal acquired while the x-ray beam excited the GOS target (right) and while the x-ray beam did not (left). When the x-ray beam traversed the target, the measured optical signal had good contrast to the background as seen in the right image. When the x-ray beam did not excite the target and went through the background phantom, there were almost no measured signals and no contrast as seen in the left image.
Figure 5.
Top surface EMCCD camera image for the phantom embedded with a 2.76 mM (1.0 mg/mL) GOS target under x-ray excitation at varying scanning depths. (a) All images shown with the same color bar. (b) Each image with its own adjusted color bar for better view.
Figure 6.
Measurements from the phantom embedded with a 27.6 μM (0.01 mg/mL) GOS target under x-ray excitation at a scan depth of 6 mm. (a) Plot of measurements at each linear scan position for a typical angular projection. (b) Actual EMCCD camera images for positions 9 (left) where the target was not excited by the x-ray and for position 14 (right) where the x-ray beam passed through the target. Images are plotted with the same color bar.
B. XLCT reconstructed images
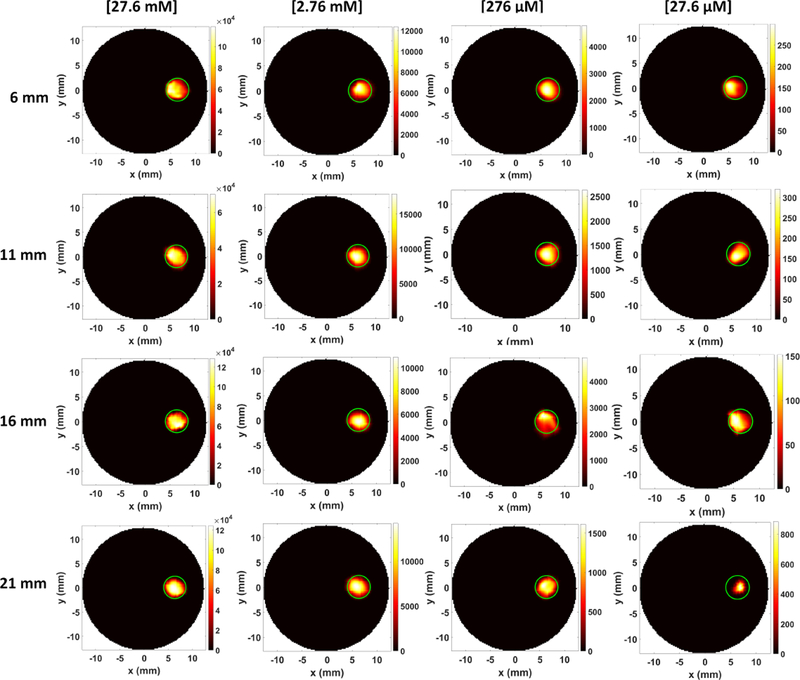
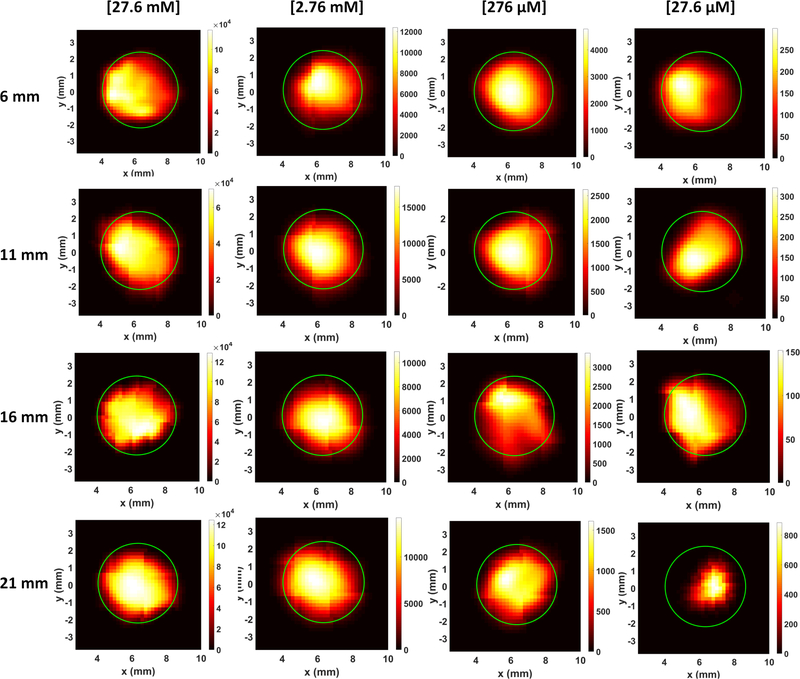
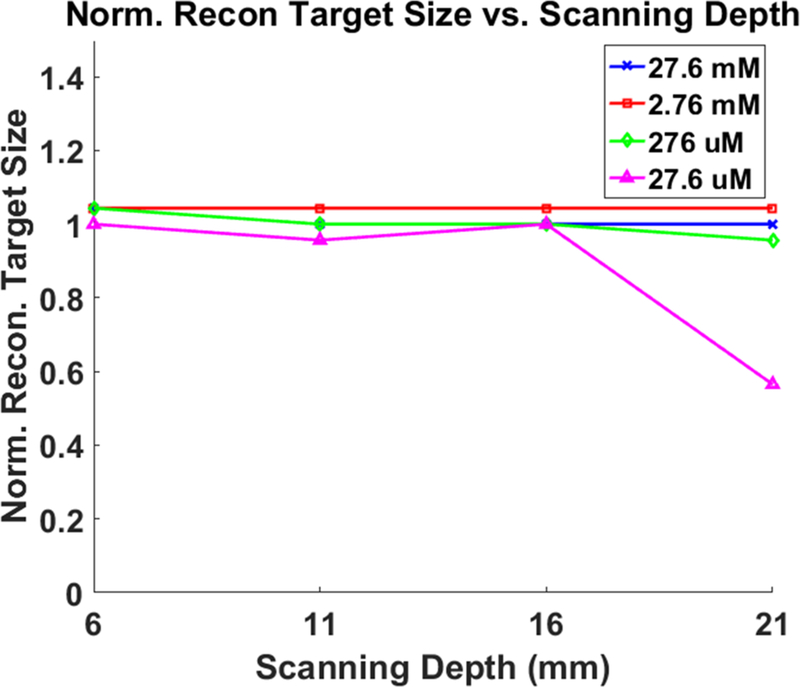
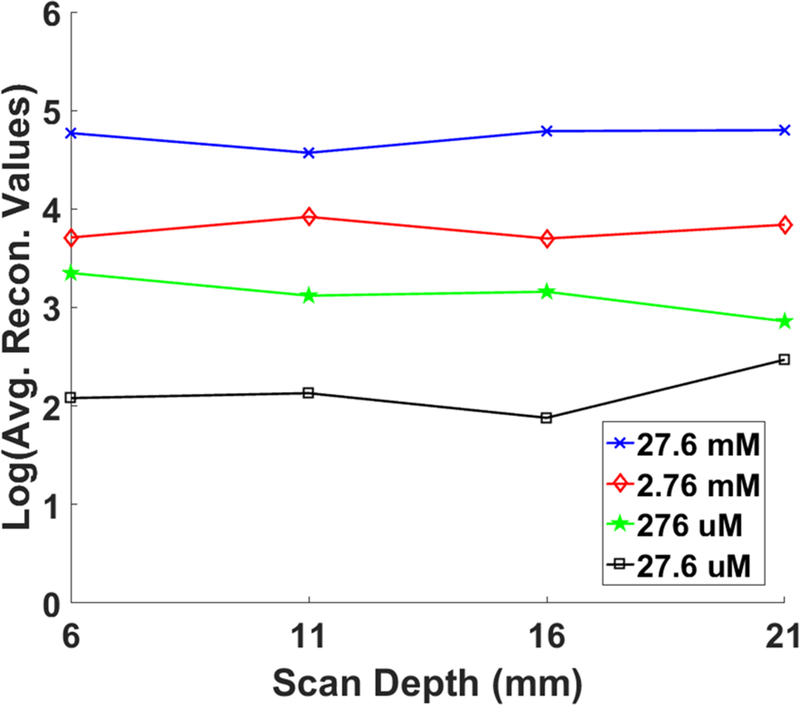
Fig. 7 shows the XLCT reconstructed images for the phantoms without India ink for varying concentrations (27.6 mM, 2.76 mM, 276 μM, and 27.6 μM) and x-ray scanning depths (6, 11, 16, 21 mm). Four different columns in Fig. 7 show the reconstructed XLCT images from four different target concentrations with the leftmost column indicating the highest concentration (27.6 mM). The four rows in Fig. 7 represent the reconstructed XLCT images for four different scan depths with the bottom row indicating the maximum depth used (21 mm). Each reconstructed image in Fig. 7 is plotted with its own color bar that indicates the reconstructed phosphor concentration. We have also normalized the XLCT reconstructed images by their own EMCCD camera exposure time (Table 1) so that the effects of exposure can be minimized. Fig. 8 shows the zoomed-in target region for each case (same image arrangement as Fig. 7). The green circle indicates the true target’s location in both Figs. 7 and 8. From the reconstructed images alone it is quite clear the target was reconstructed successfully in the correct location for all the scan depths and target concentrations. Table 2 shows the evaluated image quality metrics for each case. In nearly all cases the DICE was around 90%, indicating a high similarity between the reconstructed target and true target, except for 27.6 μM at the depth of 21 mm which had a DICE of 54.286%. In addition, for each concentration (except for 27.6 μM), the TSE was at most 4.35%, indicating that across the 4 scanning depths, the reconstructed target size varied by less than the 4.35%. In Fig. 9, the reconstructed target size (normalized to the actual size), is plotted against the scan depth for the four different target concentration cases. Ideally, the value should stay at 1.0 across all the scanning depths. As indicated by Fig. 9, the reconstructed target size changes by less than 4.35% for all four concentrations at four different scanning depths, except for the worst case scenario of 27.6 μM at 21 mm depth. For this case, the DICE was lowest (54.286%) and the TSE was the greatest (43.48%). The increase in TSE and lower DICE can be attributed to the low and noisy signal obtained from such a low concentration at a significant depth. Lastly in Fig. 10, the average reconstructed values inside the target region for each concentration at each scan depth were plotted. For better view, the values are plotted in logarithmic scale (base 10). From the plot, we can see that the higher concentration targets were always reconstructed with higher values than the lesser concentrations. In addition, for the depths up to 16 mm, which is sufficient for mice imaging, we have calculated the standard deviation between the reconstructed average values to be 26%, 31%, 31%, and 28% for the 27.6 mM, 2.76 mM, 276 μM, and 27.6 μM concentrations respectively. This indicates that across the scanning depths, the average reconstructed values only differed by about 30% on average. From the average reconstructed values, we also calculated the ratio between them to be approximately 349.5:40.7:9.2:1.0. Between the two highest concentrations (27.6 mM and 2.76 mM) and the two smallest concentrations (276 μM and 27.6 μM) we have about a 9:1 ratio in the average reconstructed values. Between the 2.76 mM and 276 μM concentrations, we only had about a 4.5:1 ratio difference, which was smaller than expected.
Figure 7.
XLCT reconstructed images for different GOS target concentrations at different scanning depths. The green circle depicts the true target location.
Figure 8.
The zoomed-in target region for XLCT reconstructed images.
Table 2.
XLCT Image Quality Metrics (No Ink)
| Target Conc. | Scan Depth (mm) | Diameter (mm)/TSE (%) | DICE (%) |
|---|---|---|---|
| 27.6 mM (10 mg/mL) | 6 | 4.800/4.35 | 94.002 |
| 11 | 4.600/0 | 90.972 | |
| 16 | 4.600/0 | 91.579 | |
| 21 | 4.600/0 | 92.664 | |
| 2.76 mM (1.0 mg/mL) | 6 | 4.800/4.35 | 89.975 |
| 11 | 4.800/4.35 | 90.361 | |
| 16 | 4.800/4.35 | 90.037 | |
| 21 | 4.800/4.35 | 91.558 | |
| 276 μM (0.1 mg/mL) | 6 | 4.800/4.35 | 93.141 |
| 11 | 4.600/0 | 87.383 | |
| 16 | 4.600/0 | 88.426 | |
| 21 | 4.400/4.35 | 91.919 | |
| 27.6 μ (0.01 mg/mL) | 6 | 4.600/0 | 87.671 |
| 11 | 4.400/4.35 | 87.548 | |
| 16 | 4.600/0 | 88.674 | |
| 21 | 2.600/43.48 | 54.286 |
Figure 9.
Plot of normalized XLCT reconstructed target size versus the x-ray beam scanning depth for the non-ink phantoms containing four varying GOS target concentrations.
Figure 10.
Plot of the average reconstructed values for each concentration at each scanning depth. The values given in the plot are in logarithmic (base 10) scale.
C. micro-CT imaging
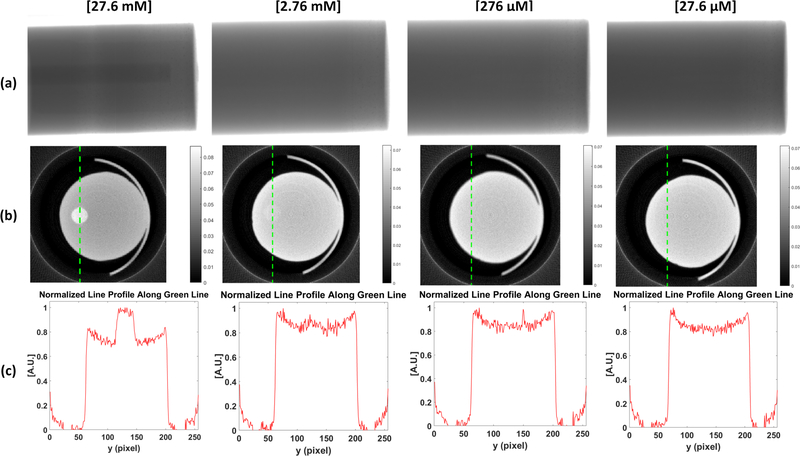
Fig. 11 shows the results of the micro-CT imaging. Prior to performing a full scan, a single projection image for each concentration was taken with an exposure time of 50 ms. After the preprocessing (i.e. dead pixel correction), a single projection image is shown in Fig. 11a. From these images, the target can only clearly be seen in the 27.6 mM case but not in the other three cases (2.76 mM, 276 μM, and 27.6 μM). After performing a full micro-CT scan, the reconstructed micro-CT images at a single transverse slice are displayed in Fig. 11b for the four different target concentration cases. Although we could not see the target in the single projection image taken for the 2.76 mM case, after the full scan, the target can be visualized as shown in Fig. 11b. Again, the target could not be reconstructed for the cases of 276 μM and 27.6 μM. To further analyze the reconstructed micro-CT images, we plot the normalized profile lines across the targets in Fig.11c. The vertical line profile position is indicated by the green dotted line in Fig. 11b. From the line profile of the 27.6 mM case, the contrast between the target and background can be clearly visualized in the plot. For the 2.76 mM concentration, the contrast can be seen but it is not as evident as in the prior case. The rest of the concentrations demonstrated no contrast in their normalized line profiles. It appears that the limit of detection in micro-CT for a GOS target is about 2.76 mM, which is currently 100 times lower than that of XLCT.
Figure 11.
micro-CT imaging results. (a) Single projection images. (b) micro-CT reconstructed images. (c) Normalized line profile along vertical green line shown in (b).
D. Effects of optical absorber (India ink) on XLCT reconstruction
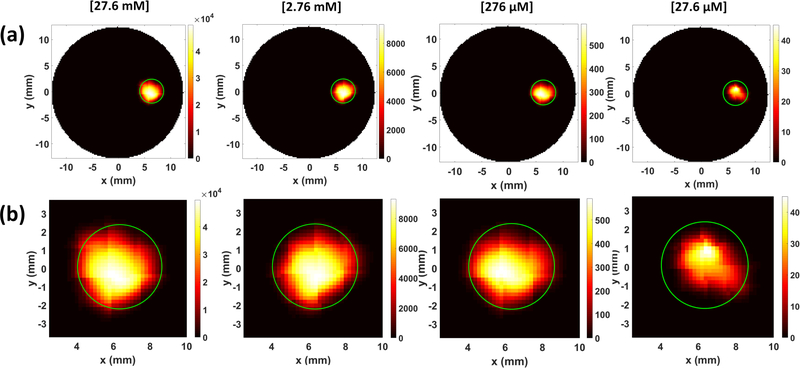
For the phantoms fabricated with India ink to closely mimic the optical absorption of tissues, we performed both a full XLCT and micro- CT scan. For the XLCT measurements, we only used a single scanning depth at 11 mm. The reconstructed XLCT images and the zoomed-in target region for these phantoms are shown in Fig. 12a and 12b respectively. The only noticeable effect from the addition of the ink was a minor decrease in the optical signal intensity. The decrease was not enough to compromise the reconstruction and for all cases, the target was reconstructed successfully in the correct position. Table 3 shows the evaluated image quality metrics each case. The maximum TSE for all the cases was again 4.35%, similar to our results for the non-ink phantoms. In addition, the DICE was around 90% for all cases (89.774, 91.255, and 92.015 %) except the 27.6 μM; however, the result is still acceptable at 79.195%. Based on the micro-CT reconstruction for these phantoms, the extra addition of ink did not change the results, primarily because the addition of ink does not cause any noticeable change in x-ray attenuation.
Figure 12.
XLCT reconstructed images for the phantoms with added India ink. (a) The reconstructed image. (b) Zoomed-in target region
Table 3.
XLCT Image Quality Metrics (Ink Phantoms)
| Target Conc. | Target Diameter (mm)/TSE (%) | DICE (%) |
|---|---|---|
| 27.6 mM (10 mg/mL) | 4.600/0 | 89.774 |
| 2.76 mM (1.0 mg/mL) | 4.800/4.35 | 91.255 |
| 276 μM (0.1 mg/mL) | 4.800/4.35 | 92.015 |
| 27.6 μM (0.01 mg/mL) | 4.400/4.35 | 79.195 |
4. DISCUSSION AND CONCLUSION
In this work, the sensitivity of two imaging modalities, XLCT and micro-CT were compared using phantom experiments with GOS targets. In our study, we used GOS target concentrations consistent with those used for numerical simulations for CT reconstruction in [6]. For all concentrations, XLCT was able to detect the optical signal emitted from the target when the target was excited by the x-ray beam and based on our XLCT reconstructed images (Fig. 7), the signal was sufficient to reconstruct the target in the correct location with high DICE and low TSE (Table 2). We can also see from Fig. 9 that even as we increase our scanning depth, we can still reconstruct our target with a low TSE, which means that there was little variation in the reconstructed target size. In addition, we found that the standard deviation in the average reconstructed values was about 30% for depths up to 16 mm. Since we have not performed a calibration of our system in regards to the reconstructed values or concentrations, we believe this result is acceptable. Overall from the results obtained, it seems that we have not quite yet reached the threshold for detection for XLCT, especially at 6 mm depth.
One phenomenon observed during our XLCT scans was the presence of some background luminescence emitted from our phantom. During all times of scanning, from the EMCCD camera images the top surface of the phantom was always visible (with very low contrast) indicating that this was probably not due to the EMCCD camera noise but some other phenomena. For x-ray luminescence imaging, it was reported in [27] that a source of background luminescence during imaging is water which our phantom is mostly composed of. However, our results could not verify this conclusion as shown in Fig. 6, in which we did not observe the signal variations when the x-ray beam excited the background phantom (98% water) from linear steps 1–10. Especially we observed the same amount of background signals when the x-ray beam barely touched the phantom in linear scan step 1 (the left-most point in Fig. 6a), which indicates that the background signals might not be from the x-ray excitation of water. Furthermore, the emitted signal from the 0.01 mg/mL target is 400 times larger than the background signal, which indicates that the XLCT detection limitation is far beyond 0.01 mg/mL for a deep GOS target.
Our micro-CT reconstructed images are shown in Fig. 11b. Based off of these results, we can see that the target can be visualized for the 27.6 and 2.76 mM cases and not for the other lower concentrations. Based on the low contrast seen from the micro-CT image for the 2.76 mM case, it seems this is approximately the limit of detection for micro-CT. The results are very consistent when comparing the numerical simulation results from [6] to our reconstructed micro-CT images (Fig. 10b), since the 1.0 mg/mL (2.76 mM) results both demonstrate similar contrast. From the results it is quite clear that the use of an x-ray induced optical signal (as in XLCT), provides a significant increase in sensitivity for detection of GOS targets compared to the purely x-ray attenuation based micro-CT imaging alone. We also found that the presence of an optical absorber such as India ink, does not dramatically affect our results. Although there is a minor decrease in the optical signal overall, it is not sufficient to compromise our image quality dramatically.
One of the major advantages of XLCT over other optical imaging modalities like FMT, are the use of photons with wavelengths in the near-infrared (NIR) range. Upon x-ray excitation, the GOS nanoparticles will emit photons primarily at 623 and 703 nm [7, 10, and 17]. Photons at these wavelengths have very high tissue penetration ability with modest scattering thus are ideal for optical imaging at depth. In a previous study [6] it was demonstrated by numerical simulations that XLCT could image a 4.8 mm diameter GOS target with the same concentrations used in this study, up to a scanning depth of 20 mm. In addition, XLCT was demonstrated experimentally in [7] to be able to image up to a depth of 7.7 mm. In this study, we performed imaging on a 4.6 mm diameter target and shown experimentally we could perform imaging with concentrations as low as 27.6 μM at a scanning depth of 21 mm (Fig. 7). From Table 2, we can see that for each case (with exception to 27.6 μM), as the scanning depth increased, there was little variation in our reconstructed target size with a maximum target size error of 4.35%. For the 27.6 μM target at 21 mm scanning depth, the large target size error can be attributed to the weak signal obtained from such a small concentration of GOS at such a significant depth (21 mm). For molecular imaging however, the depths shown are more than sufficient for most purposes.
In this study, we demonstrated that XLCT’s use of x-ray induced NIR optical photons as the basis for image contrast as opposed to x-ray attenuation (as in CT) brings dramatic improvements in the ability to detect contrast agents based on nanophosphors (e.g. GOS). From our micro-CT reconstruction, we found that we could barely detect targets at a concentration of 2.76 mM while for XLCT, we successfully reconstructed targets with concentrations as low as 2 7.6 μM and could go even lower. Future directions in regards to XLCT can allow for even higher measurement sensitivity than observed in this study. With ongoing research in regards to nanophosphor synthesis, we may see phosphors fabricated with greater light yield (such as in [28]) which can improve the sensitivity of XLCT. In addition, the sensitivity can also be improved by using a higher sensitivity photon detector or a higher flux x-ray beam as seen in [29]. Overall, with the combined merits of both x-ray (high spatial resolution) and optical (high sensitivity) imaging modalities as well as the ability to image at significant depths, XLCT has great potentials to become a powerful tool for molecular imaging where in the past, x-rays played little role.
Acknowledgment.
We thank Dr. Sim on R. Cherry from UC Davis for lending us an x-ray detector and the x-ray source used in the m icro-CT system set-up.
Funding Information. National Institutes of Health (NIH) (R03 EB022305); UC Merced (Start-up funds)
References
- 1.Ginat DT and Gupta R, “Advances in Computed Tomography Imaging Technology,”Annu. Rev. Biomed. Eng, 16, 431–453, Jul. 2014. [DOI] [PubMed] [Google Scholar]
- 2.Zhang G, Liu F, Luo J, Xie Y, Bai J, and Xing L, “Cone Beam X-ray Luminescence Computed Tomography Based on Bayesian Method ,” IEEE Trans. on Med. Imaging, 2016. [DOI] [PMC free article] [PubMed] [Google Scholar]
- 3.Carpenter CM, Sun C, and Pratx G, “Hybrid x-ray/optical luminescence imaging: characterization of experimental conditions ,” Med. Phys 37 (8), Aug. 2010. [DOI] [PMC free article] [PubMed] [Google Scholar]
- 4.Pratx G, Carpenter CM, Sun C, and Xing L, “X-ray luminescence computed tomography via selective excitation: a feasibility study ,” IEEE Transactions on Med. Imag, Vol. 29, No. 12, Dec. 2010. [DOI] [PubMed] [Google Scholar]
- 5.Speck U, “Contrast agents: X-ray contrast agents and molecular imaging - a contradiction? ” Handbook Exp. Pharmacol,185, 167 175, 2008. [DOI] [PubMed] [Google Scholar]
- 6.Li C, Martinez-Davalos A, and Cherry SR, “Numerical simulation of x-ray luminescence computed tomography fo r small-animal imaging ,” J. Biomed. Opt, Vol. 19, No. 4, Apr. 2014. [DOI] [PMC free article] [PubMed] [Google Scholar]
- 7.Li C, Di K, Bec J, and Cherry SR, “X-ray luminescence computed tomography imaging: experimental studies ,” Opt. Letters, Vol. 38, No. 13, July, 2013. [DOI] [PMC free article] [PubMed] [Google Scholar]
- 8.Chen Do, Zhu S, Yi H, Zhang X, Chen Du., Liang J, and Tian J, “Cone beam x-ray luminescence computed tomography: a feasibility study ,” Med. Phys 40 (3), March 2013. [DOI] [PubMed] [Google Scholar]
- 9.Chen Do., Zhu S, Cao X, Zhao F, and Liang J, “X-ray luminescence computed tomography based on x-ray distribution model and adaptively split Bregman method ,” Biomed. Opt. Expr, Vol. 6, No. 7, Jul. 2015. [DOI] [PMC free article] [PubMed] [Google Scholar]
- 10.Pratx G, Carpenter CM, Sun C, Rao R, and Xing L, “Tomographic molecular imaging of x-ray excitable nanoparticles ,” Opt. Letters, Vol. 35, No. 20, Oct. 2010. [DOI] [PubMed] [Google Scholar]
- 11.Pratx G, Carpenter CM, Sun C, Rao R, and Xing L, “Tomographic molecular imaging of x-ray excitable nanoparticles ,” Opt. Letters, Vol. 35, No. 20, Oct. 2010. [DOI] [PubMed] [Google Scholar]
- 12.Zhang W, Zhu D, Zhang K, and Li C, “Microscopic x-ray luminescence computed tomography ,” Proc. of SPIE Vol. 9316, 93160M–1, 2015. [Google Scholar]
- 13.Zhang W, Zhu D, Lun M, and Li C, “Multiple pinhole collimator based x-ray luminescence computed tomography ,” Biomed. Opt. Expr, Vol. 7, No. 7, May 2016. [DOI] [PMC free article] [PubMed] [Google Scholar]
- 14.Liu X, Wang H, Xu M, Nie S, and Lu H, “A wavelet-based single-view reconstruction approach fo r cone beam x-ray luminescence computed tomography imaging ,” Biomed. Opt. Expr, Vol. 5, No. 11, Nov. 2014. [DOI] [PMC free article] [PubMed] [Google Scholar]
- 15.Liu X, Liao Q, Wang H, and Yan Z, “Excitation-resolved cone-beam x-ray luminescence tomography ,” JBO Letters, Vol. 20 (7), Jul. 2015. [DOI] [PubMed] [Google Scholar]
- 16.Liu X, Liao Q, and Wang H, “Fast X-ray Luminescence Computed Tomography Imaging ,” IEEE Trans. on Biomed. Eng, Vol. 61, No. 6, June 2014. [DOI] [PubMed] [Google Scholar]
- 17.Chen H, Longfield D, Varahagiri VS, Nguyen KT, Patrick AL, Qian H, VanDerveer DG, and Anker JN, “Optical imaging in tissue with x-ray excited luminescent sensors ,” Analyst, 2011, 136, 3438. [DOI] [PubMed] [Google Scholar]
- 18.Paulus MJ, Gleason SS, Kennel SJ, Hunsicker PR, and Johnson DK, “High Resolution X-ray Computed Tomography: An Emerging Tool fo r Cancer Research ,” Nature Review, Neoplasia, Vol. 2, Nos. 1–2, pp 62–70, Jan-Apr 2000. [DOI] [PMC free article] [PubMed] [Google Scholar]
- 19.Schambach SJ, Bag S, Schilling L, Groden C, and Brockmann MA, “Application of micro-CT in sm all animal imaging ,” Elsevier, Methods 50 (2010). [DOI] [PubMed] [Google Scholar]
- 20.Ahmad M, Pratx G, Bazalova M, and Xing L, “X-ray Luminescence and X-ray Fluorescence Computed Tomography: New Molecular Imaging Modalities ,” IEEE Access, Vol. 2, 1051–1061, 2014. [Google Scholar]
- 21.Yang K, Kwan ALC, Miller DF, and Boone JM, “A geometric calibration method fo r cone beam CT systems ,” Med. Phys, 1695–1706 (33) 6 2006. [DOI] [PMC free article] [PubMed] [Google Scholar]
- 22.Zhu D and Li C, “Nonconvex regularizations in fluorescence molecular tomography fo r sparsity enhancement ,” Phys. Med. Biol 59, 2901–2912, 2014. [DOI] [PubMed] [Google Scholar]
- 23.Zhu D and Li C, “Nonuniform update fo r sparse target recovery in fluorescence molecular tomography accelerated by ordered subsets ,” Biomed. Opt. Expr, Vol. 5, No. 12, Dec. 2014. [DOI] [PMC free article] [PubMed] [Google Scholar]
- 24.Zhu D, Zhao Y, Baikejiang R, Yuan Z, and Li C, “Comparison of Regularization Methods in Fluorescence Molecular Tomography ,” Photonics Vol. 1, No. 2, 95–109, 2014. [Google Scholar]
- 25.Zhu D, Li C, “Accelerated image reconstruction in fluorescence molecular tomography using a non-uniform updating scheme with momentum and ordered subsets methods”, J. of Biomed. Opt, 21 (1), 016004 (2016). [DOI] [PubMed] [Google Scholar]
- 26.Li C, Mitchell GS, Dutta J, Ahn S, Leahy RM, and Cherry SR, “A three-dimensional multispectral fluorescence optical tomography imaging system fo r small animals based on a conical mirror design ,” Opt. Expr, 2009;17(9):7571–7585. [DOI] [PMC free article] [PubMed] [Google Scholar]
- 27.Pratx G, “A tale of two photons: radioluminescence and its application in molecular imaging .” Proc. of SPIE, Vol. 10049, 2017. [Google Scholar]
- 28.Sudheendra L, Das GK, Li C, Stark D, Cena J, Cherry SR, Kennedy IM, “NaGdF4: Eu3+ nanoparticles fo r enhanced x-ray excited optical imaging ,” ACS Chem. of Mater, Vol. 26, Issue 5, 2014. [DOI] [PMC free article] [PubMed] [Google Scholar]
- 29.Zhang W, Lun M, and Li C, “Fiber based fast sparse sampling X-ray luminescence computed tomography .” Proc. of SPIE, Vol. 10057, 2017. [Google Scholar]


