

Abstract
Objective
Frontotemporal lobar degeneration (FTLD) is the second most prevalent dementia in young patients and is characterized by the presence of two main protein aggregates in the brain, tau (FTLD‐Tau) or TDP43 (FTLD‐TDP), which likely require distinct pharmacological therapy. However, specific diagnosis of FTLD and its subtypes remains challenging due to largely overlapping clinical phenotypes. Here, we aimed to assess the clinical performance of novel cerebrospinal fluid (CSF) biomarkers for discrimination of FTLD and its pathological subtypes.
Methods
YKL40, FABP4, MFG‐E8, and the activities of catalase and specific lysosomal enzymes were analyzed in patients with FTLD‐TDP (n = 30), FTLD‐Tau (n = 20), AD (n = 30), DLB (n = 29), and nondemented controls (n = 29) obtained from two different centers. Models were validated in an independent CSF cohort (n = 188).
Results
YKL40 and catalase activity were increased in FTLD‐TDP cases compared to controls. YKL40 levels were also higher in FTLD‐TDP compared to FTLD‐Tau. We identified biomarker models able to discriminate FTLD from nondemented controls (MFG‐E8, tTau, and Aβ 42; 78% sensitivity and 83% specificity) and non‐FTLD dementia (YKL40, pTau, p/tTau ratio, and age; 90% sensitivity, 78% specificity), which were validated in an independent cohort. In addition, we identified a biomarker model differentiating FTLD‐TDP from FTLD‐Tau (YKL40, MFGE‐8, βHexA together with βHexA/tHex and p/tTau ratios and age) with 80% sensitivity and 82% specificity.
Interpretation
This study identifies CSF protein signatures distinguishing FTLD and the two main pathological subtypes with optimal accuracy (specificity/sensitivity > 80%). Validation of these models may allow appropriate selection of cases for clinical trials targeting the accumulation of Tau or TDP43, thereby increasing their efficiency and facilitating the development of successful therapies.
Introduction
Frontotemporal lobar degeneration (FTLD) is the second most prevalent dementia in patients below 65 years old1, 2 and has the worst life expectancy among non‐prion dementia.3 Two main pathological subtypes have been described based on the proteinopathy found in the brain: around half of the cases develop aggregates of the microtubule‐associated protein tau (FTLD‐Tau), while the other half are characterized by cytoplasmic inclusions of the transactivator regulatory DNA‐binding protein 43 (TDP43, FTLD‐TDP).4 These two main pathologies likely require distinct pharmacological therapy, and thus, discrimination of both subtypes is strongly needed. However, the clinical presentation of the FTLD pathological subtypes is heterogeneous and overlapping.5 So far, there are still no effective early biomarkers available to discriminate FTLD and its two main pathological subtypes, hampering the selection of appropriate patients for clinical trials targeting the specific proteinopathy (i.e., Tau or TDP43).6, 7
Most biomarker studies have been performed in pathologically heterogeneous populations.8 The few studies analyzing antemortem cerebrospinal fluid (CSF) with known underlying neuropathology have revealed several candidate biomarkers, such as the pTau181 to tau ratio, which discriminates FTLD‐TDP from FTLD‐Tau cases with approximately 80% sensitivity and 60% specificity.9, 10, 11 Despite these promising results, their specificity is far from optimal, most of the identified markers are awaiting further validation and their diagnostic accuracy remains to be evaluated.
In order to unravel novel specific biomarkers for FTLD subtypes, we previously mapped and validated changes in the proteome of antemortem CSF of well‐characterized FTLD patients with confirmed tau or TDP43 pathology and nondemented controls.12 In this study, we externally validated and assessed the clinical performance of the identified novel CSF biomarkers (chitinase‐3‐like protein 1 [CHI3L1 or YKL‐40], milk fat globule‐EGF factor 8 protein [MFG‐E8], fatty acid‐binding protein 4 [FABP4], catalase activity, and specific lysosomal enzymes’ activity), as single biomarkers or combined, in discriminating FTLD and its different pathological subtypes using two independent cohorts biobanked at the Emory University and Milan University Hospital Policlinico.
Methods
Human CSF samples
CSF material was obtained from the Emory University (n = 100, USA) and Milan University Hospital Policlinico (n = 45, Italy) (discovery cohort, Table 1). FTLD patients with an underlying TDP43 pathology (FTLD‐TDP, n = 30) were selected based on autopsy (n = 8) and C9orf72/GRN mutations (n = 15).13, 14 Diagnostic groups were enriched with CSF from patients with FTLD‐Plus syndromes that reflect high correlation with a specific neuropathology. Thus, the FTLD‐TDP group was enriched with FTLD patients with amyotrophic lateral sclerosis (FTLD‐ALS, n = 7), associated with TDP43 pathology.15 FTLD cases with tau neuropathology (FTLD‐Tau, n = 20) were selected based on autopsy (n = 2), MAPT mutations (n = 2),6 and familial history of autopsy confirmed FTLD‐Tau (n = 1). The FTLD‐Tau group was also enriched with CSF from patients with FTLD‐Plus syndromes related to tau pathology such as progressive supranuclear palsy (FTLD‐PSP, n = 10) or corticobasal syndrome (FTLD‐CBS, n = 5).16, 17 Noteworthy, six FTLD‐Tau and six FTLD‐TDP patients had a positive AD CSF biomarker profile (low CSF β‐amyloid 1–42 (Aβ42) and high p or t‐Tau level, applying local laboratory standards), suggesting potential AD copathology in those cases. Non‐demented healthy controls (CON, n = 29, 4 of them with positive CSF AD biomarker profile) and patients with other types of dementia, such as AD (n = 30) and DLB (n = 29), were also selected to test the specificity of the biomarker signatures to FTLD. An additional independent CSF cohort was used for validation of the resulting CSF protein biomarker signatures (validation cohort: [subjective cognitive decline (SCD) = 59, FTLD‐TDP = 42, FTLD‐Tau = 50, AD = 17, and DLB = 20]), consisting of samples recruited at the Erasmus Medical Center (MC) and the VU Medical Center (VUmc; Table 1).
Table 1.
Descriptive statistics of demographics by diagnostic groups
| CON | FTLD‐TDP | FTLD‐Tau | AD | DLB | |
|---|---|---|---|---|---|
| Cohort 1 (Emory + Milan) | |||||
| n (M/F) | 29 (14/15) | 30 (18/12) | 20 (13/7) | 30 (15/15) | 29 (15/14) |
| Age, years (mean ± SD) | 62 (15) | 66 (7) | 65 (10) | 69 (8) | 68 (8) |
| n (Emory/Milan) | 20/9 | 20/10 | 20/0 | 20/10 | 20/9 |
| Aβ 1–42 (pg/mL) | 408 (307)a,c, d,e | 230 (452)b | 176 (101)b | 218 (211)b | 298 (279)b |
| t‐Tau (pg/mL) | 46 (36)a | 78 (114)a | 43 (35)a | 171 (156)b,c,d,e | 43 (199)a |
| pTau (pg/mL) | 18 (12)a,e | 23 (21)a,e | 18 (14)a | 72 (46)b,c,d,e | 33 (19)a,b,c |
| FTLD subgroups | 8 autopsy | 2 autopsy | |||
| 15 mutations | 2 mutations | ||||
| 7 FTLD‐ALS | 1 family history | ||||
| 10 PSP | |||||
| 5 CBS | |||||
| Cohort 2 (VUmc + ErasmusMC) | |||||
| n (M/F) | 59 (32/27) | 42 (23/19) | 50 (26/24) | 17 (9/8) | 20 (17/3) |
| Age, years (mean ± SD) | 59 (10) | 60(8) | 64 (9) | 64 (6) | 63 (5) |
| Aβ 1–42 (pg/mL) | 983 (342)a,c, d,e | 874 (328)a,b | 795 (335)a,b | 461 (137)b,c,d,e | 648 (483)a,b |
| t‐Tau (pg/mL) | 249 (106)a,c | 353 (137)a,b | 290 (182)a | 622 (237)b,c,d,e | 299 (118)a |
| pTau (pg/mL) | 45 (20)a | 38 (15)a,e | 39 (21)a | 84 (26)b,c,d,e | 53 (24)a |
| FTLD subgroups | 15 autopsy | 3 autopsy | |||
| 21 mutations | 5 mutations | ||||
| 6 FTLD‐ALS | 22 PSP | ||||
| 20 CBS | |||||
CON, nondemented controls; FTLD, frontotemporal lobar degeneration; AD, Alzheimer's disease; DLB, dementia with Lewy body; PSP, progressive supranuclear palsy; CBS, corticobasal syndrome; n, number of cases; M, Male; F, female.
P < 0.05 compared to AD.
P < 0.05 compared to CON.
P < 0.05 compared to FTLD‐TDP.
P < 0.05 compared to FTLD‐Tau.
P < 0.05 compared to DLB.
All participants underwent standard neurological and cognitive assessments and diagnosis was assigned according to consensus criteria.18, 19, 20, 21, 22, 23, 24 The control group of the validation cohort were labeled during a multidisciplinary consensus meeting as SCD when they presented with subjective cognitive complaints, but objective cognitive and laboratory investigations (including AD CSF biomarkers) were normal and thus comparable to controls (CON). Non‐demented healthy control or SCD cases did not meet criteria for mild cognitive impairment and had no signs of inflammatory or neurodegenerative disorders, or family history of neurodegenerative diseases. All CSF samples of all cohorts were stored in agreement with the JPND‐BIOMARKAPD guidelines.25 Demographic data, concentration of CSF Aβ42, t‐Tau, pTau, and type of diagnosis of all cases used in each cohort and the biomarkers measured are summarized in Table.1. The studies were approved by the Institutional Ethical Review Boards of each center. Informed consent was obtained from all subjects or their authorized representatives.
Biomarker analysis
CSF levels of the biomarkers were measured using specific immunoassays that have been previously validated for CSF analysis12 (Data S1). Intra‐ and interassays CVs were calculated using two CSF pools as quality controls, resulting in 1.8% and 10% for YKL‐40, 3.1% and 9.5% for FABP4, 10.8% and 24.2% for MFG‐E8, and 3.1% and 13.7% for catalase activity. The levels of AD‐related biomarkers (total and phosphorylated tau [t‐Tau and pTau181]) were analyzed in the corresponding sample collection center using the commercially available kits (Emory: INNO‐BIA AlzBio3; Milan: Innotest Aβ(1‐42), hTAUAg, phosphor‐Tau(181P); Fujiribo, Ghent, Belgium, both using the same antibodies) as previously described.9, 26 The levels of neurofilament light change (NfL) were measured in a subset of cases within the validation cohort using a validated immunoassay ELISA of UmanDiagnostics (Umeå, Sweden) as previously described.27 All biomarkers were analyzed by a single experienced technician blinded to the clinical groups.
Effects of preanalytical factors
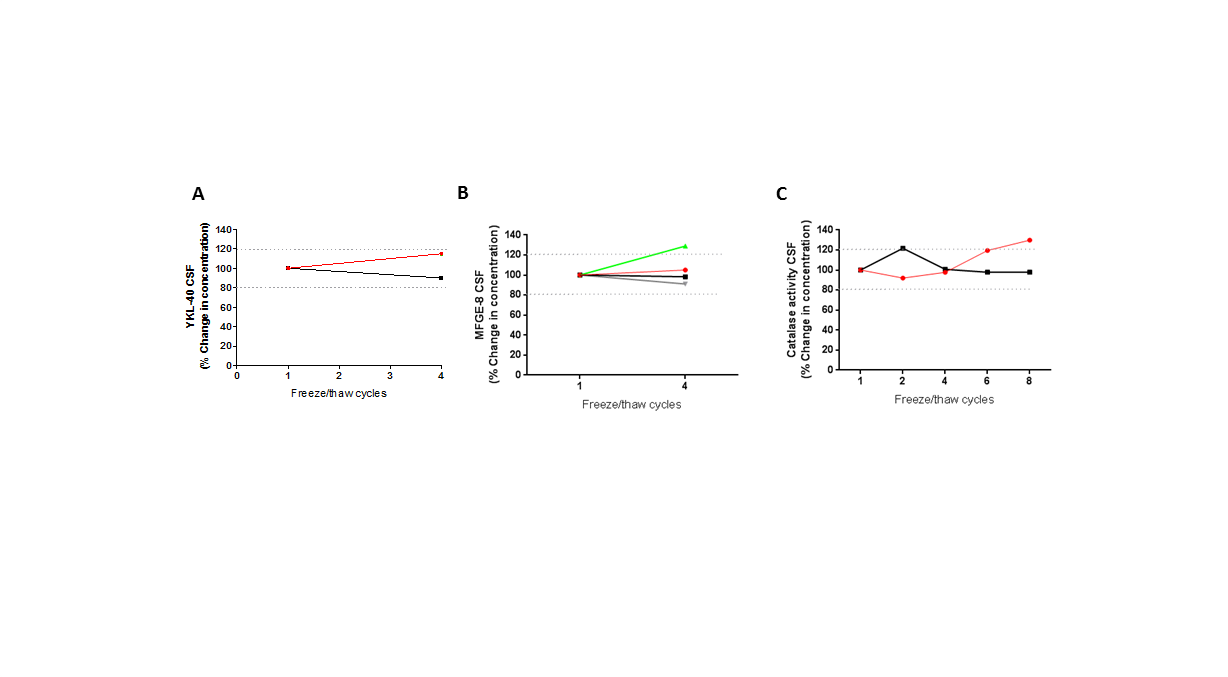
The effects of age, sex, and storage duration on CSF analytes were assessed by statistical evaluation of the results as described below. The effect of freeze–thaw cycles was experimentally determined for YKL40, MFG‐E8, and catalase activity by freezing and thawing independent CSF samples (n = 2–3) up to four times, leaving the samples each time at least 2 hours at room temperature, and next store at −80°C for at least 12 h.
Statistical analysis
Statistical analyses were performed using SPSS (Chicago, IL, USA). The influence of different preanalytical variables on biomarker levels was analyzed by linear regression after normalizing skewed data using two‐step transformation.28, 29 Between‐group analyses of demographic variables were performed using the Student's t‐test or Pearson's chi‐square test in normally distributed data. Non‐Gaussian distributed data were analyzed using the Mann–Whitney test. In the discovery cohort, difference in the biomarker levels between the clinical groups was evaluated by ANCOVA using normalized values and including either center and age or length of storage as covariate followed by Fisher's least significant difference (LSD, equivalent to Mann–Whitney U test for adjusted means). Noteworthy, not every differentially expressed marker necessarily has discriminatory power in a classification exercise.30 Thus, we next used multivariate stepwise backward logistic regression based on likelihood ratio to find the classification signature that gives maximum predictive performance in the demarcation of the specific diagnostic groups including all the CSF markers analyzed and age. The resulting predicting probabilities were used to assess the diagnostic value of biomarker combination using receiver operator characteristic (ROC). Multilayer perceptron analysis was used to validate the models by randomly selecting subset of samples from the whole cohort. Areas under the curve (AUC), sensitivity, and specificity values were calculated. The performance of the models was classified as poor (AUC:0.6–0.7), moderate (AUC = 0.7–0.8), good (AUC = 0.8–0.9), and optimal (AUC = 0.9–1). To further validate the biomarker models, we next analyzed the corresponding biomarker combinations in the independent validation cohort by logistic regression and ROC analysis. For models that could not be further tested in the validation cohort, data were reanalyzed using support vector machine (SVM), which randomly splits the original samples of analysis into training and validation sets (70–30%, respectively). Values with P < 0.05 were considered significant.
Results
Demographic and preanalytical effects
No difference in age or sex was observed between FTLD pathological subtypes (Table 1). Samples from the Emory cohort had a shorter storage time and patients had a lower age compared to those obtained from Milan (P < 0.001). We observed that the overall levels of all biomarkers with the exception of FABP4 were higher in samples collected at Emory University (Table S1).
Freeze–thaw cycles did not influence the levels of YKL‐40, MFG‐E8, or catalase activity (Fig. S1), except for lysosomal activities, which change only after two freeze–thaw cycles.31 Longer storage time was associated with decreased levels of MFG‐E8 (P < 0.0001), as well as the activities of catalase (P < 0.0001) and all lysosomal enzymes (P < 0.01). Patient age influenced only the levels of YKL‐40 (P < 0.01) and FABP4 (P < 0.01). Sex did not influence any of the biomarkers analyzed (Table S2).
In summary, we observed that age influenced the levels of YKL‐40 and FABP4. The center in which samples were collected had a strong influence on all the CSF biomarkers analyzed and the length of storage negatively influenced MFG‐E8 concentration and the activities of catalase and lysosomal enzymes. Thus, analysis of the data was performed always correcting for center and either length of storage or age when applicable.
Change in levels of YKL‐40, MFG‐E8, and catalase activity in CSF across different diagnostic groups
YKL40 was increased in the overall FTLD group compared to nondemented controls (P < 0.01) and was higher in FTLD‐TDP compared to FTLD‐Tau cases (P < 0.05). YKL40 was also increased in FTLD‐TDP compared to DLB and nondemented controls (P < 0.0001), but did not differ from those in AD (Fig. 1A). ROC analysis showed that CSF YKL‐40 levels had a moderate performance discriminating nondemented healthy controls (CON) from the overall FTLD patients (AUC: 0.74; 95% CI: 0.62–0.85, P < 0.0001) or FTLD‐TDP subtype (AUC: 0.78; 95% CI: 0.67–0.90, P < 0.0001, Fig. 2D) but did not reach sufficient sensitivity/specificity values (<80%, Table 2).
Figure 1.
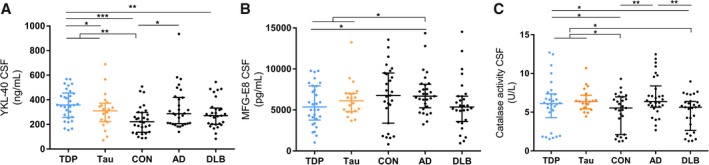
YKL‐40, MFG‐E8 and catalase activity in CSF were changed across the different diagnostic groups. Dot plot displays the uncorrected values of YKL40 (A) MFG‐E8 (B) and the activity of catalase (C) in CSF for each clinical group (FTLD‐TDP in blue and FTLD‐Tau in orange). Median and interquartile range are represented *P < 0.05; ***P < 0.001. Abbreviations: n.s., nonsignificant; CSF, cerebrospinal fluid; CON, healthy nondemented controls; TDP, TAR DNA‐binding protein 43; AD, Alzheimer's disease; DLB, dementia with Lewy bodies.
Figure 2.
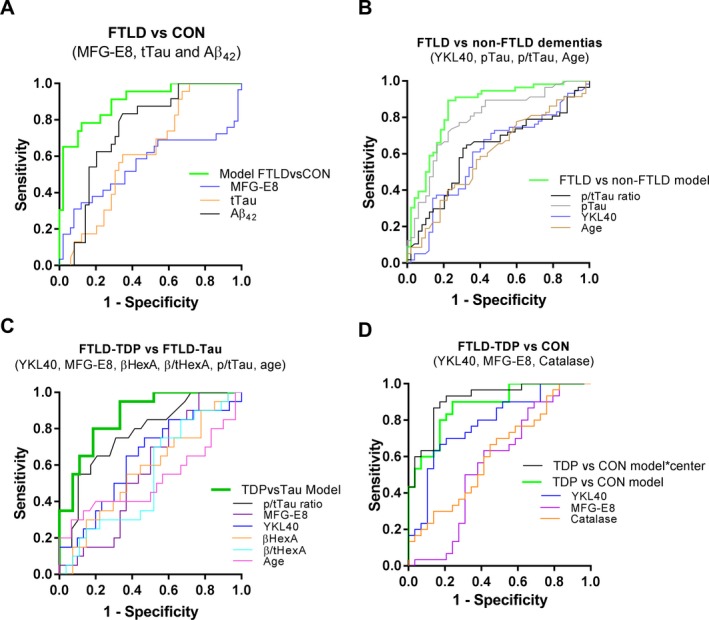
Receiver operating curves (ROC) of the different models discriminating specific diagnostic groups in the discovery cohort. (A) ROC curves of the individual markers or the corresponding biomarker combination (MFG‐E8, tTau, and Aβ 42) discriminating FTLD from CON. (B) ROC curves of the individual markers or the corresponding biomarker combination (YKL40, pTau, p/tTau, and age) discriminating FTLD from non‐FTLD dementia (AD, DLB). (C) ROC curves of the individual markers or the corresponding biomarker combination (YKL40, MFG‐E8, p/tTau ratio, βHexA activity, β/tHexA, and age) discriminating FTLD‐TDP from FTLD‐Tau. (D) ROC curves of the individual markers or the corresponding biomarker combination discriminating FTLD‐TDP from CON (YKL40, MFG‐E8, and catalase activity) with and without center as interaction factor.
Table 2.
ROC analysis of CSF parameters discriminating different diagnostic groups in the discovery cohort
| Cut‐off point1 | Sensitivity (%) | Specificity (%) | AUC (95% CI) | +LR2 | LR3 | p value (individually) | Coefficient (B) | P value (within model) | |
|---|---|---|---|---|---|---|---|---|---|
| CSF variables | |||||||||
| FTLD (n = 49) vs. CON (n = 23) | |||||||||
| MFG‐E8 | na | na | na | 0.55 (0.405‐0.702) | na | na | 0.428 | −0.0004 | 0.005 |
| tTau | na | na | na | 0.62 (0.487–0.747) | na | na | 0.111 | 0.068 | <0.0001 |
| Aβ42 | 264 | 71 | 69 | 0.75 (0.632–0.859) | 2.29 | 0.42 | 0.001 | −0.010 | <0.0001 |
| FTLD vs. CON model4 | 0.686 | 78 | 83 | 0.90 (0.827–0.976) | 4.59 | 0.27 | <0.0001 | ||
| FTLD (n = 49) vs. non‐FTLD dementia (n = 57) | |||||||||
| YKL40 | na | na | na | 0.60 (0.491–0.708) | na | na | 0.071 | −0.004 | 0.021 |
| pTau | 29.1 | 77 | 67 | 0.80 (0.702–0.877) | 2.3 | 0.3 | <0.0001 | 0.044 | <0.0001 |
| p/tTau | na | na | na | 0.62 (0.512–0.728) | na | na | 0.034 | 2.33 | 0.008 |
| Age | na | na | na | 0.61 (0.503–0.719) | na | na | 0.047 | 0.079 | 0.010 |
| FTLD vs. non‐FTLD dementia model5 | 0.3903 | 90 | 78 | 0.86 (0.781–0.930) | na | na | <0.0001 | ||
| FTLD‐TDP (n = 29) vs. FTLD ‐Tau (n = 20) | |||||||||
| p/t Tau ratio | 0.285 | 80 | 59 | 0.77 (0.641–0.906) | 2 | 0.3 | 0.001 | 7.67 | 0.006 |
| YKL40 | na | na | na | 0.64 (0.476–0.794) | na | na | 0.109 | −0.009 | 0.049 |
| MFG‐E8 | na | na | na | 0.57 (0.411–0.729) | na | na | 0.406 | 0.001 | 0.027 |
| βHexA | na | na | na | 0.57 (0.404–0.737) | na | na | 0.414 | −0.012 | 0.021 |
| βHexA/tHex | na | na | na | 0.54 (0.370–0.708) | na | na | 0.651 | 44.330 | 0.041 |
| Age | na | na | na | 0.52 (0.336–0.696) | na | na | 0.851 | 0.133 | 0.036 |
| TDP vs. Tau model6 | 0.4563 | 80 | 81 | 0.87 (0.772–0.969) | 4.2 | 0.2 | <0.0001 | ||
| FTLD‐TDP (n = 29) vs. CON (n = 30) | |||||||||
| YKL40 | 25.35 | 80 | 62 | 0.78 (0.665–0.901) | 2.1 | 0.3 | <0.0001 | 0.017 | 0.001 |
| MFG‐E8 | na | na | na | 0.44 (0.283–0.589) | na | na | 0.396 | −0.001 | 0.003 |
| Catalase | na | na | na | 0.62 (0.474–0.761) | na | na | 0.122 | 0.430 | 0.024 |
| TDP vs. CON model7 | 0.4431 | 90 | 76 | 0.88 (0.796–0.965) | 3.8 | 0.1 | <0.0001 | ||
AUC, area under the curve; CI, confident interval; LR, likelihood ratio; CON, nondemented controls; FTLD, frontotemporal lobar degeneration.
n.a: not applicable due to the lack of significance.
Selected value of the individual biomarker or combination where the two groups of analysis could be discriminated with the reported sensitivity and specificity.
Positive likelihood: sensitivity/100‐specificity.
Negative likelihood: 100‐sensitivity/specificity.
FTLD vs. CON model: y = 2.94 − 0.0004*MFGE8 + 0.07*tTau − 0.01*Aβ 42.
FTLD vs. non‐FTLD dementia models: y = −6.621 − 0.004*YKL40 + 0.044*pTau + 2.33*p/tTau ratio + 0.79*Age.
TDP vs. Tau model: y = −14.659 − 0.009*YKL40 + 0.001*MFGE8 − 0.012*βHexA activity + 44.33*βHexA/tHex activity ratio + 7.671*p/tTau ratio + 0.133*Age.
TDP vs. CON model: y = −3.193 + 0.017*YKL40 − 0.001*MFGE8 + 0.43*catalase activity.
Markers/models achieving sufficient biomarker performance are highlighted in bold.
The levels of MFG‐E8 were decreased in the overall FTLD group compared to AD (P < 0.05). No significant difference was observed between FTLD‐TDP and FTLD‐Tau. MFG‐E8 levels were especially lower in FTLD‐TDP patients compared to AD (P < 0.05, Fig. 1B). MFG‐E8 did not show enough diagnostic performance on discriminating FTLD from AD.
Catalase activity in CSF was increased in FTLD and FTLD‐TDP compared to controls (P < 0.05) and DLB patients (P < 0.05; Fig. 1C). Catalase activity could only discriminate FTLD from nondemented controls with poor performance (AUC: 0.64; P = 0.05, Fig. 2A, Table 2).
The levels of FABP4 as well as the activity of the different lysosomal enzymes in CSF were not changed between the different diagnostic groups (Fig. S2). Differences in biomarker levels between the non‐FTLD dementia groups were also observed (Fig. 1A–C).
Specific CSF protein signatures discriminate FTLD and its pathological subtypes
CSF biomarkers discriminating FTLD from CON
Multivariate stepwise backward regression revealed that combination of MFG‐E8 together with tTau and Aβ 42 could discriminate control cases from FTLD patients (FTLD vs. CON model) with optimal performance (AUC: 0.90, 95% CI: 0.83–0.98, P < 0.0001) leading to 78% sensitivity and 83% specificity. This performance was better to that observed for any of the individual markers within the model (Fig. 2A, Table 2). These results were confirmed by multilayer perceptron analysis (AUC: 0.91).
CSF biomarkers discriminating FTLD from non‐FTLD dementia cases
Combination of YKL‐40 with pTau, the p/tTau ratio and age could discriminate FTLD cases from patients with non‐FTLD dementia (AD and DLB) with optimal performance (AUC: 0.86, 95% CI: 0.78–0.93, P < 0.0001) leading to 90% sensitivity and 78% specificity. This performance was better to that observed for any of the individual markers within the model (Fig. 2B, Table 2). These results were confirmed by multilayer perceptron analysis (AUC: 0.86).
CSF biomarkers discriminating FTLD‐TDP from FTLD‐Tau
Combination of YKL40, MFG‐E8, activity of βHexA, and the βHexA/tHex activity ratio together with p/tTau ratio and age could discriminate FTLD‐TDP from FTLD‐Tau (TDP vs. Tau model) with an accuracy of 0.87 (95% CI AUC: 0.77–0.97, P < 0.0001), and a sensitivity and specificity of 80% and 81%, respectively (Fig. 2C, Table 2). Such results were confirmed by multilayer perceptron analysis (AUC: 0.9). This performance was better to that observed for the p/tTau ratio alone (AUC: 0.78; 95% CI: 0.65–0.91, P = 0.001, 80% sensitivity and 59% specificity, Fig. 2C, Table 2), the marker showing the strongest discrimination between FTLD‐TDP and FTLD‐Tau to date.9, 10
CSF biomarkers discriminating FTLD‐TDP from CON
Combination of YKL‐40, MFG‐E8, and catalase activity including center as an interaction factor could discriminate control cases from FTLD‐TDP patients (TDP vs. CON model) with optimal performance (AUC: 0.92, 95% CI: 0.84–0.97, P < 0.0001, Fig. 2D) leading to 90% sensitivity and 83% specificity. Adding tau markers, either alone or as ratio, did not improve the sensitivity or specificity of the model. Importantly, removing center as an interaction factor decreased specificity to 76% (AUC: 0.88, 95% CI AUC: 0.80–0.97, P < 0.0001, Fig. 2D, Table 2). These results were confirmed by multilayer perceptron analysis (AUC: 0.88).
CSF biomarker signatures discriminating CON from FTLD‐Tau were not identified.
Validation of the biomarker models
We next tested how well the generated models could be validated in independent validation cohort (Table 3). We observed that the “FTLD vs. CON” model (MFG‐E8, tTau, and Aβ 42) could again discriminate FTLD from CON cases with optimal performance (AUC: 0.93, 95% CI: 0.89–0.97, P < 0.0001; with 88% sensitivity and 85% specificity (Fig. 3A; Table 3). Using a subset of cases for which NfL measurements were available (FTLD = 92, CON = 28), we observed that the FTLD vs. CON model (AUC:0.94; P < 0.0001) performed similar to NfL alone (AUC:0.94 P < 0.0001, Fig. S3), a non‐disease specific marker that optimally discriminate FTLD cases from controls.27, 32, 33, 34
Table 3.
ROC analysis of CSF parameters discriminating different diagnostic groups in the validation cohort
| Cut‐off point1 | Sensitivity (%) | Specificity (%) | AUC (95% CI) | +LR2 | LR3 | P value (individually) | Coefficient (B) | P value (within model) | |
|---|---|---|---|---|---|---|---|---|---|
| CSF variables | |||||||||
| FTLD (n = 90) vs. CON (n = 55) | |||||||||
| MFG‐E8 | 5975 | 81 | 69 | 0.81 (0.734–0.884) | 2.61 | 0.28 | <0.0001 | −0.001 | <0.0001 |
| tTau | 262.5 | 71 | 59 | 0.68 (0.592–0.765) | 1.73 | 0.49 | <0.0001 | 0.019 | <0.0001 |
| Aβ 42 | 886 | 66 | 65 | 0.67 (0.577–0.755) | 1.89 | 0.52 | 0.001 | −0.003 | 0.008 |
| FTLD vs. CON model | 0.594 | 88 | 85 | 0.93 (0.894–0.971) | 5.87 | 0.14 | <0.0001 | ||
| FTLD (n = 91) vs. non‐FTLD dementia models (n = 37) | |||||||||
| YKL40 | 273 | 72 | 70 | 0.74 (0.644–0.833) | 2.40 | 0.40 | <0.0001 | 0.011 | 0.001 |
| pTau | 45.5 | 78 | 71 | 0.82 (0.729–0.911) | 2.69 | 0.31 | <0.0001 | −0.083 | <0.0001 |
| p/tTau | 0.134 | 70 | 60 | 0.68 (0.577–0.788) | 1.75 | 0.50 | 0.001 | −13.04 | 0.017 |
| Age | na | na | na | 0.55 (0.444–0.646) | na | na | 0.423 | −0.062 | 0.113 |
| FTLD vs. non‐FTLD dementia model | 0.636 | 91 | 84 | 0.93 (0.884–0.975) | 5.69 | 0.11 | <0.0001 | ||
| FTLD‐TDP (n = 42) vs. CON (n = 57) | |||||||||
| YKL40 | 259.93 | 79 | 70 | 0.78 (0.690–0.881) | 2.63 | 0.30 | <0.0001 | 0.016 | <0.0001 |
| MFG‐E8 | 6069.5 | 80 | 79 | 0.83 (0.745–0.907) | 3.81 | 0.25 | <0.0001 | −0.001 | <0.0001 |
| Catalase | 4.44 | 70 | 62 | 0.71 (0.614–0.815) | 1.84 | 0.48 | <0.0001 | 0.413 | 0.151 |
| TDP vs. CON model | 0.297 | 90 | 86 | 0.94 (0.898–0.989) | 6.43 | 0.12 | <0.0001 | ||
AUC, area under the curve; CI, confident interval; LR, likelihood ratio; CON, nondemented controls; FTLD, frontotemporal lobar degeneration, n.a, nonapplicable.
Selected value of the individual biomarker or combination where the two groups of analysis could be discriminated with the reported sensitivity and specificity.
Positive likelihood: sensitivity/100‐specificity.
Negative likelihood: 100‐sensitivity/specificity.
Markers/models achieving sufficient biomarker performance are highlighted in bold.
Figure 3.

Receiver operating curves (ROC) of the different models discriminating specific diagnostic groups in the validation cohort. (A–C) ROC curves of the (A) FTLD vs. CON model (MFG‐E8, tTau, and Aβ 42), (B) the FTLD vs. non‐FTLD dementia models (YKL40, pTau, p/tTau, and age) and (C) the FTLD‐TDP vs. CON model (YKL40, MFG‐E8, and catalase activity) discriminating corresponding patients in the discovery (green line) and validation (blue line) cohorts. Abbreviations: FTLD, frontotemporal lobar degeneration; CON, healthy nondemented controls; TDP, TAR DNA‐binding protein 43; AD, Alzheimer's disease.
The “FTLD vs. non‐FTLD dementia” model (pTau, t/pTau ratio, YKL40 and age) could again optimally discriminate FTLD cases from non‐FTLD dementia cases (AD and DLB) in the validation cohort (AUC: 0.93, 95% CI: 0.88–0.98, P < 0.0001) achieving 91% sensitivity and 84% specificity (Fig. 3B; Table 3). The “FTLD‐TDP vs. CON” model (YKL‐40, MFG‐E8, and catalase activity) was also validated in the new independent cohort (AUC: 0.94, 95% CI: 0.90–0.99, P < 0.0001) with 90% sensitivity and 86% specificity (Fig. 3C; Table 3).
Most of the samples of the validation cohort had already undergone more than two freeze–thaw cycles, which affect the overall activity values of tHexA and βHexA.31 The number of samples available in which the activity of such enzymes could be optimally measured (TDP = 12, FTLD‐Tau = 6) was too small and thus the “TDP vs. Tau” model could not be validated in an independent cohort. However, analysis of the discovery cohort using supporting vector machine (SVM), an alternative statistical approach that randomly split the cohort into training and testing sets, reported similar results (AUC: 0.93) with average error rates of 22.4% and 21.3% for the training and testing test.
Discussion
Biomarkers discriminating FTLD pathological subtypes are strongly needed for the selection of patients in drug trials targeting the specific proteinopathies.6, 7 We have assessed and validated the clinical performance of novel CSF biomarkers identified previously12 for discrimination of FTLD pathological subtypes and nondemented controls using two independent CSF cohorts coming from different centers. The main findings were the identification of four novel CSF biomarker signatures able to discriminate: (1) FTLD from non‐demented controls (FTLD vs. CON model: MFG‐E8, tTau, and Aβ 42), (2) FTLD from other dementia (FTLD vs. non‐FTLD dementia model: YKL‐40, pTau, and p/tTau ratio) and (3) the main FTLD pathological subtypes (TDP vs. Tau model: YKL40, MFG‐E8, activity of βHexA, βHexA/tHex ratio, p/tTau ratio, and age).
In agreement with previous studies, CSF YKL40 was increased in FTLD and AD compared to controls.35, 36, 37 FTLD‐TDP had the highest YKL‐40 values, which were comparable to those observed in AD patients, but different to those observed in CON, FTLD‐Tau, or DLB. These findings are partially in agreement with our previous study in which higher levels were also observed in the FTLD‐Tau group.12 Importantly, FTLD‐Tau encompasses tauopathies with different etiologies such as FTLD‐MAPT, PSP, PiD, and CBD. While our previous proteomics‐based study analyzed mainly FTLD‐Tau cases with MAPT mutations,12 the current study was performed with a more heterogeneous FTLD‐Tau group including also sporadic CBS and PSP cases, which may explain the observed discrepancies. Indeed, recent studies have highlighted that CSF biomarkers (e.g., pTau) can differ between familial and sporadic FTLD cases that develop the same underlying neuropathology.38, 39 Thus, this data also highlights the impact that the heterogeneity within each FTLD subtype can have on the CSF biomarker profile. CSF YKL‐40 was also increased in different acute inflammatory disorders indicating that YKL‐40 is an inflammatory marker likely reflecting astrogliosis.40, 41, 42, 43, 44 Thus, the different levels of YKL‐40 levels across different pathological groups may indicate a different inflammatory response.
We also analyzed the levels of MFG‐E8, a molecule that has been shown to mediate microglia phagocytosis.45 Despite the fact that MFG‐E8 was increased in AD cases compared to both FTLD subtypes, it did not discriminate those clinical groups. Recent data has shown that Aβ can induce the release of MFG‐E8,46 and therefore, the higher levels of MFG‐E8 may reflect the higher amyloid load of AD patients that is rarely seen in FTLD cases.4
Catalase activity in CSF was increased in FTLD‐TDP compared to non‐demented controls, which challenges our previous findings in which the activity of catalase was specially decreased in the FTLD group.12 The time length of sample storage before analysis (which negatively influences CSF catalase activity) as well as the higher FTLD heterogeneity of this study may explain the discrepancy observed. Some cases within the nondemented controls or the FTLD‐TDP groups showed remarkably lower values of catalase than the rest of the samples (i.e., catalase <2.5 U/L), which are likely explained by the center of collection (Milan) or time of storage rather than by a specific pathophysiological characteristic (i.e., TDP‐ALS). Catalase is an antioxidant enzyme, and thus, the observed increase activity may reflect a compensatory mechanism to counteract the oxidative stress present in different dementia such as AD or FTLD.47, 48
We next assessed whether our protein dataset could reveal specific combination of markers discriminating non‐demented controls and FTLD subtypes. We observed that combination of MFG‐E8 together with CSF tTau and Aβ 42 could discriminate FTLD patients from nondemented controls with 78% sensitivity and 82% specificity, which was validated in a larger independent cohort achieving sensitivity and specificity values >80%. Most of the potential FTLD CSF biomarkers studied to date (e.g., tau, tdp43) did not achieve enough sensitivity or specificity.8, 49, 50, 51, 52 In a subset of cases, we observed that the FTLD vs. CON model achieved similar performance to that observed for NfL alone. However, CSF NfL is a nonspecific disease biomarker that is upregulated in other disorders such as AD.27, 32, 34 Importantly, recent studies showed that the ratio between NfL and the soluble β fragment of amyloid precursor protein (sAPPβ)53 or the combination of TDP43 with p/tTau ratio54 could optimally discriminate FTLD patients from CON in a large cohort, promising data that need to be replicated in independent cohorts. An additional challenge in clinical practice is the differential diagnosis of dementia. Noteworthy, up to 30% of FTLD cases are misdiagnosed with other disorders, especially AD.55 Several studies have shown that ratios with AD CSF biomarkers (i.e., pTau/Aβ42 or tTau/Aβ42) can discriminate FTLD from AD with performances over 80%.38, 56 In this study, we identified a model able to discriminate FTLD from a general group of non‐FTLD dementia (AD and DLB) with 91% sensitivity and 84% specificity using pTau, p/tTau ratio and YKL40. Taken together, the biomarker combinations described above may aid on the optimal diagnosis of FTLD within the dementia spectrum, the first step toward diagnosing the specific FTLD subtypes.
We next identified a model able to discriminate the two main pathological subtypes of FTLD (TDP vs.Tau model: YKL40, MFG‐E8, βHexA, βHexA/tHex, p/tTau ratio, and age) with a sensitivity and specificity of 80% and 82%. The p/tTau ratio has already been shown to be a reproducible biomarker discriminating both FTLD pathological subtypes with sensitivity and specificity values around 82% and 62%, respectively,9, 10 as also observed in the current study. Interestingly, the addition of age, YKL40, and MFG‐E8 together with the activity of βHexA and its ratio increased the specificity to 81%. These outcomes were not affected by the center in which samples were collected, and similar results were obtained when data were reanalyzed using SVM. These data reveal a potential biomarker model discriminating FTLD pathological subtypes with enough sensitivity and specificity values according to biomarker guidelines (>80%).57 Such model could be highly relevant since it may facilitate the appropriate selection of cases (FTLD‐TDP or FTLD‐Tau) for clinical trials targeting the specific protein aggregates (TDP43 or Tau) once FTLD diagnosis is made, ultimately easing the development of disease‐modifying therapies. However, it is important to highlight that the achieved sensitivity and specificity still did not reach excellent performance (over 90%) and that validation of this model in independent cohorts remains to be performed.
We identified a model that could discriminate FTLD‐TDP patients from controls with 90% sensitivity and 76% specificity, which was also validated in a larger independent cohort. Despite the clinical utility of this model might be limited, the optimal validation of the model in an independent cohort further supports the validity of the data obtained in this study. Importantly, we observed that the specificity of this model increased up to 83% when center of was included as an interaction factor, indicating a strong influence of preanalytical confounding factors (e.g., differences in freeze–thaw cycles, spinning conditions, length of storage, tube filling, brand collection tube). This data stresses the importance of unraveling and controlling for those preanalytical factors within biomarker studies.25
Strikingly, some of the biomarkers that were not significantly changed between two specific diagnostic groups (i.e., MFG‐E8) contributed to discriminate those patients within the predicting models. Thus, the results of this study also highlight the importance of selecting biomarker candidates based not only on the fold‐change between the groups of interest but also based on their effect in combination with other markers using unbiased predicting models. These models may reflect not only changes in protein concentration but also association of different proteins to the specific phenotype within each patient, ultimately reducing interindividual variability and increasing diagnostic performance. Thus, multivariate models might be especially helpful for diagnosis of complex disorders with strong comorbidity such as neurodegenerative dementia.
Limitations
The data revealed in this study are promising but important limitations also apply. Some of the models revealed in this study are based on complex formulas including six markers and thus its final implementation in clinical practice might be challenging. However, development of highly sensitive targeted multiplex assays may facilitate the validation of such biomarkers signatures.58, 59 Noteworthy, biomarkers outcomes may differ across different stages of the disease. Despite there is no well‐established tools to optimally define the disease stage of FTLD cases yet,60 the CSF samples used in this study were mostly collected at the same stage of the disease, within 1–3 years from symptoms onset. Thus, it would be also relevant to analyze the performance of the revealed models in cases at more advance stages of the disease. In addition, the lack of autopsy confirmation in some of the selected cases (i.e., those with clinical syndromes highly predictive of FTLD‐Tau and FTLD‐TDP) may have led to the inclusion of cases with AD copathology55 influencing the resulting diagnostic performances. However, inclusion of cases with potential AD comorbidity may provide also a more heterogeneous scenario that better resembles clinical practice. Lastly, although the cohorts analyzed in this study are relatively large compared to earlier pathology‐confirmed CSF biomarker studies, we acknowledge that the sample size remains small and therefore results should still be replicated in larger cohorts, specially the biomarker model that optimally discriminated FTLD‐TDP patients from FTLD‐Tau. However, considering that the three other models unraveled within this study (FTLD vs. CON, FTLD vs. non‐FTLD dementia, and TDP vs. CON) were replicated in a large independent cohort, we expect to further validate the TDP vs. Tau biomarker signature as soon as more samples become available. Whether combinations of the markers analyzed in this study aid in the diagnosis of non‐FTLD dementia remains to be evaluated.
Conclusion
This study reveals different biomarker models based on the p/tTau ratio and a panel of different neuroinflammatory and lysosomal CSF biomarkers that can discriminate FTLD from nondemented controls and other dementia as well as the main FTLD pathological subtypes with optimal accuracy (specificity/sensitivity >80%). These models may allow appropriate selection of cases for clinical trials targeting the specific proteinopathy, thereby facilitating the development of successful therapies.
Authors’ Contributions
MC developed the study concept and design, and was responsible of acquisition of data, statistical analysis and interpretation, and drafting/revision of the manuscript. NE, LB, and KW carried out the immunoassay analyses, and SP carried out the enzyme activities. JvS, YP, TB, and DG participated in acquisition and interpretation data and the critical revision of the manuscript. WH participated in acquisition, analysis and interpretation of data, and in the critical revision of the manuscript. CT developed the study concept and design, and was involved in acquisition of data, analysis and interpretation, drafting/revision of the manuscript, and study supervision. All authors read and approved the final manuscript.
Conflict of Interest
MC, NE, LB, KW, SP, DG, TB, and YP report no disclousures.
WH reports grants from Alzheimer's Drug Discovery Foundation, grants from National Institute of Health, and grants from American Federation for Aging Research, during the conduct of the study; personal fees from ViveBio, LLC, personal fees from Locks Law Firm, grants from Fujirebio US, nonfinancial support from Avid Radiopharmaceutical, personal fees from Abbvie, personal fees from Hoffman LaRoche, personal fees from AARP, Inc, personal fees from Interpleader Law, outside the submitted work; In addition, Dr. Hu has a patent US No. 9,618,522 issued.
CT reports personal fees from advisory board of Fujirebio and Roche, nonfinancial support from research consumables from ADxNeurosciences, other from performed contract research or received grants from Janssen prevention center, Boehringer, EIP farma, Roche and Probiodrug, PeopleBio, Charles River, outside the submitted work.
Data Availability
The datasets used and/or analyzed during the current study are available from the corresponding author on reasonable request.
Ethics Approval and Consent to Participate
The studies were approved by the Institutional Ethical Review Boards of each center. Informed consent was obtained from all subjects or their authorized representatives.
Supporting information
Figure S1. Effect of freeze–thaw on the concentration of YKL40 (A), MFG‐E8 (B), and catalase activity (C) in CSF. Each line represents a different CSF sample. Data represents the % of change in the biomarker concentration/activity. Most of samples remained within acceptable + 20% range (gray dash lines) according to guidelines.25
Figure S2. Dot plot of the levels of FABP4 (A) and the activity of HexA (B), β‐HexA (C), α‐GLA (D) in CSF displayed for each clinical group (FTD‐TDP in blue and FTD‐Tau in orange).
Figure S3. Receiver operating curves (ROC) of the CON vs. FTLD model and NfL in the validation cohort.
Table S1. Demographic data, overall CSF values and collection/storage protocols by center
Table S2. Relationship between CSF biomarker values and demographic variables calculated by linear regression
Data S1. Supplementary methods
Acknowledgments
Not applicable.
Funding Information
We would like to acknowledge the Association for Frontotemporal Degeneration and Alzheimer's Drug Discovery Foundation, and the ZonMw Memorabel program project “PRODIA,” as part of the Deltaplan Dementie, for their grant support of this study.
Funding Statement
This work was funded by Association for Frontotemporal Degeneration grant ; Alzheimer's Drug Discovery Foundation grant ; ZonMw grant .
References
- 1. Ratnavalli E, Brayne C, Dawson K, Hodges JR. The prevalence of frontotemporal dementia. Neurology 2002;58:1615–1621. [DOI] [PubMed] [Google Scholar]
- 2. Brunnström H, Gustafson L, Passant U, Englund E. Prevalence of dementia subtypes: a 30‐year retrospective survey of neuropathological reports. Arch Gerontol Geriatr 2009;49:146–149. [DOI] [PubMed] [Google Scholar]
- 3. Brodaty H, Seeher K, Gibson L. Dementia time to death: a systematic literature review on survival time and years of life lost in people with dementia. Int Psychogeriatr 2012;24:1034–1045. [DOI] [PubMed] [Google Scholar]
- 4. Mackenzie IRA, Neumann M, Bigio EH, et al. Nomenclature and nosology for neuropathologic subtypes of frontotemporal lobar degeneration: an update. Acta Neuropathol 2010;119:1–4. [DOI] [PMC free article] [PubMed] [Google Scholar]
- 5. Irwin DJ, Trojanowski JQ, Grossman M. Cerebrospinal fluid biomarkers for differentiation of frontotemporal lobar degeneration from Alzheimer's disease. Front Aging Neurosci 2013;5:6. [DOI] [PMC free article] [PubMed] [Google Scholar]
- 6. Irwin DJ, Cairns NJ, Grossman M, et al. Frontotemporal lobar degeneration: defining phenotypic diversity through personalized medicine. Acta Neuropathol 2015;129:469–491. [cited 2015 Jan 2]. Available from: http://www.ncbi.nlm.nih.gov/pubmed/25549971 [DOI] [PMC free article] [PubMed] [Google Scholar]
- 7. International Conference on Frontotemporal Dementias 2016 . Fluid NfL Shines, Tau PET Dims, in the Hunt for FTD Biomarkers|ALZFORUM. [date unknown]; Available from: http://www.alzforum.org/news/conference-coverage/fluid-nfl-shines-tau-pet-dims-hunt-ftd-biomarkers
- 8. Oeckl P, Steinacker P, Feneberg E, Otto M. Cerebrospinal fluid proteomics and protein biomarkers in frontotemporal lobar degeneration: current status and future perspectives. Biochim Biophys Acta – Proteins Proteomics 2014;1854:757–768. [DOI] [PubMed] [Google Scholar]
- 9. Hu WT, Watts K, Grossman M, et al. Reduced CSF p‐Tau181 to Tau ratio is a biomarker for FTLD‐TDP. Neurology 2013;81:1945–1952. [DOI] [PMC free article] [PubMed] [Google Scholar]
- 10. Borroni B, Benussi A, Archetti S, et al. Csf p‐tau181/tau ratio as biomarker for TDP pathology in frontotemporal dementia. Amyotroph Lateral Scler Frontotemporal Degener 2014;16:86–91. [DOI] [PubMed] [Google Scholar]
- 11. Pijnenburg YAL, Verwey NA, van der Flier WM, et al. Discriminative and prognostic potential of cerebrospinal fluid phosphoTau/tau ratio and neurofilaments for frontotemporal dementia subtypes. Alzheimer's Dement 2015;1:505–512. [DOI] [PMC free article] [PubMed] [Google Scholar]
- 12. Teunissen CE, Elias N, Koel‐Simmelink MJA, et al. Novel diagnostic cerebrospinal fluid protein biomarkers for pathologic subtypes of frontotemporal dementia identified by proteomics. Alzheimer's Dement 2016;2:86–94. [DOI] [PMC free article] [PubMed] [Google Scholar]
- 13. Baker M, Mackenzie IR, Pickering‐Brown SM, et al. Mutations in progranulin cause tau‐negative frontotemporal dementia linked to chromosome 17. Nature 2006;442:916–919. [DOI] [PubMed] [Google Scholar]
- 14. Renton AE, Majounie E, Waite A, et al. A hexanucleotide repeat expansion in C9ORF72 is the cause of chromosome 9p21‐linked ALS‐FTD. Neuron 2011;72:257–268. [DOI] [PMC free article] [PubMed] [Google Scholar]
- 15. Neumann M, Sampathu DM, Kwong LK, et al. Ubiquitinated TDP‐43 in frontotemporal lobar degeneration and amyotrophic lateral sclerosis. Science 2006;314:130–133. [DOI] [PubMed] [Google Scholar]
- 16. Ingelsson M, Ramasamy K, Russ C, et al. Increase in the relative expression of tau with four microtubule binding repeat regions in frontotemporal lobar degeneration and progressive supranuclear palsy brains. Acta Neuropathol 2007;114:471–479. [DOI] [PubMed] [Google Scholar]
- 17. Dickson DW, Bergeron C, Chin SS, et al. Office of rare diseases neuropathologic criteria for corticobasal degeneration. J Neuropathol Exp Neurol 2002;61:935–946. [DOI] [PubMed] [Google Scholar]
- 18. McKeith IG, Dickson DW, Lowe J, et al. Diagnosis and management of dementia with Lewy bodies: third report of the DLB Consortium. Neurology 2005;65:1863–1872. [DOI] [PubMed] [Google Scholar]
- 19. Neary D, Snowden JS, Gustafson L, et al. Frontotemporal lobar degeneration: a consensus on clinical diagnostic criteria. Neurology 1998;51:1546–1554. [DOI] [PubMed] [Google Scholar]
- 20. Rascovsky K, Hodges JR, Knopman D, et al. Sensitivity of revised diagnostic criteria for the behavioural variant of frontotemporal dementia. Brain 2011;134(Pt 9):2456–2477. [DOI] [PMC free article] [PubMed] [Google Scholar]
- 21. Armstrong MJ, Litvan I, Lang AE, et al. Criteria for the diagnosis of corticobasal degeneration. Neurology 2013;80:496–503. [DOI] [PMC free article] [PubMed] [Google Scholar]
- 22. Litvan I, Agid Y, Calne D, et al. Clinical research criteria for the diagnosis of progressive supranuclear palsy (Steele‐Richardson‐Olszewski syndrome): report of the NINDS‐SPSP international workshop. Neurology 1996;47:1–9. [DOI] [PubMed] [Google Scholar]
- 23. Jack CR, Albert MS, Knopman DS, et al. Introduction to the recommendations from the National Institute on Aging‐Alzheimer's Association workgroups on diagnostic guidelines for Alzheimer's disease. Alzheimer's Dement 2011;7:257–262. [DOI] [PMC free article] [PubMed] [Google Scholar]
- 24. McKhann GM, Knopman DS, Chertkow H, et al. The diagnosis of dementia due to Alzheimer's disease: recommendations from the National Institute on Aging‐Alzheimer's Association workgroups on diagnostic guidelines for Alzheimer's disease. Alzheimer's Dement 2011;7:263–269. [DOI] [PMC free article] [PubMed] [Google Scholar]
- 25. Del Campo M, Mollenhauer B, Bertolotto A, et al. Recommendations to standardize preanalytical confounding factors in Alzheimer's and Parkinson's disease cerebrospinal fluid biomarkers: an update. Biomark Med 2012;6:419–430. [DOI] [PubMed] [Google Scholar]
- 26. Carecchio M, Fenoglio C, Cortini F, et al. Cerebrospinal fluid biomarkers in progranulin mutations carriers. J Alzheimer's Dis 2011;27:781–790. [DOI] [PubMed] [Google Scholar]
- 27. Meeter LHH, Vijverberg EG, Del Campo M, et al. Clinical value of neurofilament and phospho‐tau/tau ratio in the frontotemporal dementia spectrum. Neurology 2018a;90:e1231–e1239. [DOI] [PMC free article] [PubMed] [Google Scholar]
- 28. Templeton GF. A two‐step approach for transforming continuous variables to normal: implications and recommendations for IS research. Commun Assoc Inf Syst 2011;28:41–59. [Google Scholar]
- 29. Templeton GF, Burney LL. Using a two‐step transformation to address non‐normality from a business value of information technology perspective. J Inf Syst 2017;31:149–164. [Google Scholar]
- 30. Strbenac D, Mann GJ, Yang JYH, Ormerod JT. Differential distribution improves gene selection stability and has competitive classification performance for patient survival. Nucleic Acids Res 2016;44:e119. [DOI] [PMC free article] [PubMed] [Google Scholar]
- 31. Persichetti E, Chiasserini D, Parnetti L, et al. Factors influencing the measurement of lysosomal enzymes activity in human cerebrospinal fluid. PLoS ONE 2014;9:e101453. [DOI] [PMC free article] [PubMed] [Google Scholar]
- 32. Zetterberg H, Skillbäck T, Mattsson N, et al. Association of cerebrospinal fluid neurofilament light concentration with Alzheimer disease progression. JAMA Neurol 2016;73:60. [DOI] [PMC free article] [PubMed] [Google Scholar]
- 33. Skillbäck T, Farahmand B, Bartlett JW, et al. CSF neurofilament light differs in neurodegenerative diseases and predicts severity and survival. Neurology 2014;83:1945–1953. [DOI] [PubMed] [Google Scholar]
- 34. Scherling CS, Hall T, Berisha F, et al. Cerebrospinal fluid neurofilament concentration reflects disease severity in frontotemporal degeneration. Ann Neurol 2014;75:116–126. [DOI] [PMC free article] [PubMed] [Google Scholar]
- 35. Craig‐Schapiro R, Perrin RJ, Roe CM, et al. YKL‐40: a novel prognostic fluid biomarker for preclinical Alzheimer's disease. Biol Psychiatry 2010;68:903–912. [DOI] [PMC free article] [PubMed] [Google Scholar]
- 36. Alcolea D, Carmona‐Iragui M, Suárez‐Calvet M, et al. Relationship between β‐secretase, inflammation and core cerebrospinal fluid biomarkers for Alzheimer's disease. J Alzheimer's Dis 2014;42:157–167. [DOI] [PubMed] [Google Scholar]
- 37. Antonell A, Mansilla A, Rami L, et al. Cerebrospinal fluid level of YKL‐40 Protein in preclinical and prodromal Alzheimer's disease. J Alzheimer's Dis. 2014;42:901–908. [DOI] [PubMed] [Google Scholar]
- 38. Lleó A, Irwin DJ, Illán‐Gala I, et al. A 2‐step cerebrospinal algorithm for the selection of frontotemporal lobar degeneration subtypes. JAMA Neurol 2018;75:738–745. [DOI] [PMC free article] [PubMed] [Google Scholar]
- 39. Irwin DJ, Lleó A, Xie SX, et al. Ante mortem cerebrospinal fluid tau levels correlate with postmortem tau pathology in frontotemporal lobar degeneration. Ann Neurol 2017;82:247–258. [DOI] [PMC free article] [PubMed] [Google Scholar]
- 40. Cantó E, Tintoré M, Villar LM, et al. Chitinase 3‐like 1: prognostic biomarker in clinically isolated syndromes. Brain 2015;138(Pt 4):918–931. [DOI] [PubMed] [Google Scholar]
- 41. Comabella M, Fernandez M, Martin R, et al. Cerebrospinal fluid chitinase 3‐like 1 levels are associated with conversion to multiple sclerosis. Brain 2010;133:1082–1093. [DOI] [PubMed] [Google Scholar]
- 42. Modvig S, Degn M, Roed H, et al. Cerebrospinal fluid levels of chitinase 3‐like 1 and neurofilament light chain predict multiple sclerosis development and disability after optic neuritis. Mult Scler J 2015;21:1761–1770. [DOI] [PubMed] [Google Scholar]
- 43. Martinez MAM, Olsson B, Bau L, et al. Glial and neuronal markers in cerebrospinal fluid predict progression in multiple sclerosis. Mult Scler J 2015;21:550–561. [DOI] [PMC free article] [PubMed] [Google Scholar]
- 44. Cantó E, Reverter F, Morcillo‐Suárez C, et al. Chitinase 3‐like 1 plasma levels are increased in patients with progressive forms of multiple sclerosis. Mult Scler J 2012;18:983–990. [DOI] [PubMed] [Google Scholar]
- 45. Fuller AD, Van Eldik LJ. MFG‐E8 regulates microglial phagocytosis of apoptotic neurons. J Neuroimmune Pharmacol 2008;3:246–256. [cited 2016 Jan 25]. [DOI] [PMC free article] [PubMed] [Google Scholar]
- 46. Neniskyte U, Brown GC. Lactadherin/MFG‐E8 is essential for microglia‐mediated neuronal loss and phagoptosis induced by amyloid β . J Neurochem 2013;126:312–317. [DOI] [PubMed] [Google Scholar]
- 47. Swerdlow R, Burns J, Khan SM. The Alzheimer's disease mitochondrial cascade hypothesis. J Alzheimer's Dis 2010;20(Suppl 2):265–279. [DOI] [PMC free article] [PubMed] [Google Scholar]
- 48. Carmona M, Portero‐otin M, Naudı A, et al. Type‐dependent oxidative damage in frontotemporal lobar degeneration : cortical astrocytes are targets of oxidative damage. J Alzheimer's Dis 2008;67:1122–1136. [DOI] [PubMed] [Google Scholar]
- 49. Suárez‐Calvet M, Dols‐Icardo O, Lladó A, et al. Plasma phosphorylated TDP‐43 levels are elevated in patients with frontotemporal dementia carrying a C9orf72 repeat expansion or a GRN mutation. J Neurol Neurosurg Psychiatry 2013;43:1–8. [DOI] [PubMed] [Google Scholar]
- 50. Hu WT, Chen‐Plotkin A, Grossman M, et al. Novel CSF biomarkers for frontotemporal lobar degenerations. Neurology 2010;75:2079–2086. [DOI] [PMC free article] [PubMed] [Google Scholar]
- 51. Kuiperij HB, Versleijen AAM, Beenes M, et al. Tau rather than TDP‐43 proteins are potential cerebrospinal fluid biomarkers for frontotemporal lobar degeneration subtypes: a pilot study. J Alzheimer's Dis 2017;55:585–595. [DOI] [PubMed] [Google Scholar]
- 52. Meeter LH, Dopper EG, Jiskoot LC, et al. Neurofilament light chain: a biomarker for genetic frontotemporal dementia. Ann Clin Transl Neurol 2016;3:623–636. [DOI] [PMC free article] [PubMed] [Google Scholar]
- 53. Alcolea D, Vilaplana E, Suárez‐Calvet M, et al. CSF sAPPβ, YKL‐40, and neurofilament light in frontotemporal lobar degeneration. Neurology 2017;89:178–188. [DOI] [PubMed] [Google Scholar]
- 54. Bourbouli M, Rentzos M, Bougea A, et al. Cerebrospinal fluid TAR DNA‐binding protein 43 combined with tau proteins as a candidate biomarker for amyotrophic lateral sclerosis and frontotemporal dementia spectrum disorders. Dement Geriatr Cogn Disord 2017;44:144–152. [DOI] [PubMed] [Google Scholar]
- 55. Forman MS, Farmer J, Johnson JK, et al. Frontotemporal dementia: clinicopathological correlations. Ann Neurol 2006a;59:952–962. [DOI] [PMC free article] [PubMed] [Google Scholar]
- 56. Rivero‐Santana A, Ferreira D, Perestelo‐Pérez L, et al. Cerebrospinal fluid biomarkers for the differential diagnosis between Alzheimer's disease and frontotemporal lobar degeneration: systematic review, HSROC analysis, and confounding factors. J Alzheimer's Dis 2017;55:625–644. [DOI] [PubMed] [Google Scholar]
- 57. The Ronald and Nancy Reagan Research Institute of the Alzheimer's Association and the National Institute on Aging Working Group 123 . Consensus report of the working group on: “molecular and biochemical markers of Alzheimer ‘s disease”. Neurobiol Aging 1998;19:109–116. [PubMed] [Google Scholar]
- 58. Christiansson L, Mustjoki S, Simonsson B, et al. The use of multiplex platforms for absolute and relative protein quantification of clinical material. EuPA Open Proteomics 2014;3:37–47. [Google Scholar]
- 59. Lewczuk P, Kornhuber J, Vanderstichele H, et al. Multiplexed quantification of dementia biomarkers in the CSF of patients with early dementias and MCI: a multicenter study. Neurobiol Aging 2008;29:812–818. [DOI] [PubMed] [Google Scholar]
- 60. Premi E, Gualeni V, Costa P, et al. Looking for measures of disease severity in the frontotemporal dementia continuum. J Alzheimer's Dis 2016;52:1227–1235. [DOI] [PubMed] [Google Scholar]
Associated Data
This section collects any data citations, data availability statements, or supplementary materials included in this article.
Supplementary Materials
Figure S1. Effect of freeze–thaw on the concentration of YKL40 (A), MFG‐E8 (B), and catalase activity (C) in CSF. Each line represents a different CSF sample. Data represents the % of change in the biomarker concentration/activity. Most of samples remained within acceptable + 20% range (gray dash lines) according to guidelines.25
Figure S2. Dot plot of the levels of FABP4 (A) and the activity of HexA (B), β‐HexA (C), α‐GLA (D) in CSF displayed for each clinical group (FTD‐TDP in blue and FTD‐Tau in orange).
Figure S3. Receiver operating curves (ROC) of the CON vs. FTLD model and NfL in the validation cohort.
Table S1. Demographic data, overall CSF values and collection/storage protocols by center
Table S2. Relationship between CSF biomarker values and demographic variables calculated by linear regression
Data S1. Supplementary methods
Data Availability Statement
The datasets used and/or analyzed during the current study are available from the corresponding author on reasonable request.