

Summary
Autophagy is a conserved catabolic pathway with emerging functions in mammalian neurodevelopment and human neurodevelopmental diseases. The mechanisms controlling autophagy in neuronal development are not fully understood. Here, we found that conditional deletion of the Forkhead Box O transcription factors FoxO1, FoxO3, and FoxO4 in neurons, strongly impaired autophagic flux in developing neurons of the adult mouse hippocampus. Moreover, FoxO-deficiency led to altered dendritic morphology, increased spine density and aberrant spine positioning in adult-generated neurons. Strikingly, pharmacological induction of autophagy was sufficient to correct abnormal dendrite and spine development of FoxOdeficient neurons. Collectively, these findings reveal a novel link between FoxO transcription factors, autophagic flux, and maturation of developing neurons.
eTOC Blurb:
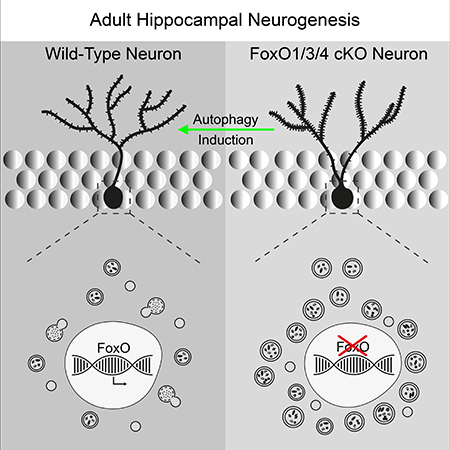
Schäffner et al. identify FoxO-transcription factors as critical regulators of autophagic flux in adult hippocampal neurogenesis and show that FoxO-dependent autophagic flux is necessary for morphological maturation and synaptic integration of adult-born hippocampal neurons.
Graphical Abstract
Introduction
The dentate gyrus (DG) of the hippocampal formation is one of the few regions of the adult mammalian brain, where neural stem / progenitor cells (NSPCs) give rise to functional neurons throughout life (Goncalves et al., 2016a). Adult-generated hippocampal dentate granule neurons fulfill critical functions in plasticity. As a consequence, perturbations of adult hippocampal neurogenesis are associated with learning and memory deficits and altered anxiety behavior. Moreover, there is evidence that impaired adult neurogenesis contributes to the pathogenesis of cognitive and behavioral deficits in ageing and neuropsychiatric diseases (Abrous and Wojtowicz, 2015; Rolando and Taylor, 2014).
The generation of dentate granule neurons is a multistep developmental process that begins with the activation of quiescent radial-glia like neural stem / progenitor cells (NSPCs) and culminates in the synaptic integration of the newly generated dentate granule neuron into the hippocampal circuit (Goncalves et al., 2016a). Precise execution of the adult neurogenic sequence is dependent on the expression of stage-specific genetic programs, which are coordinated by the activity of transcription factors (Beckervordersandforth et al., 2015).
Forkhead Box O proteins constitute a highly conserved family of transcription factors that controls gene expression programs involved in resistance to oxidative stress, DNA damage repair, metabolism, autophagy, cell cycle arrest, and cell survival, in a context-dependent fashion (Eijkelenboom and Burgering, 2013). In the context of adult neurogenesis, the Forkhead Box O family members FoxO1, 3, and 4 (hereafter referred to as FoxOs) are considered regulators of long-term maintenance of the adult NSPC pool based on the observation that their embryonic deletion results in accelerated depletion of NSPCs during adulthood (Paik et al., 2009; Renault et al., 2009; Yeo et al., 2013). Notably, FoxO expression is not confined to NSPCs but is observed throughout the adult DG (Hwang et al., 2018; Renault et al., 2009), raising the possibility that FoxOs have a function in later steps of the adult neurogenic sequence.
Here, we describe that adult-specific conditional deletion of FoxOs from the hippocampal neurogenic lineage not only impairs stem cell maintenance but also alters the dendritic structure as well as the number and positioning of excitatory synapses of adult-generated DG neurons. Biochemical and imaging analyses revealed a major impediment in macroautophagy (autophagy hereafter) – a conserved catabolic pathway that involves the capturing of organelles and proteins in autophagosomes and their subsequent degradation via lysosomes. Intriguingly, treatment with pharmacological enhancers of autophagy was sufficient to correct FoxO-deficiency associated neurogenesis deficits not only in vitro but also in vivo. These data identify a function for FoxOs in controlling the development of connectivity of adult-born DG neurons and reveal a novel link between FoxO transcription factors, maintenance of autophagic degradation activity, and morphological maturation of developing neurons.
Results
FoxO1/3/4 directly regulate long-term maintenance of the radial-glia like neural stem/progenitor cell pool
Mice with a germline deletion of FoxO3 or a conditional developmental deletion of Foxo1/3/4 display premature depletion of the adult NSPC pool and a progressive impairment of adult neurogenesis (Paik et al., 2009; Renault et al., 2009). We first sought to determine whether the adult NSPC and neurogenesis phenotype are the consequence of impaired embryonic neurodevelopment or of a specific function of FoxOs in adult NSPCs. Confirming previous reports (Hwang et al., 2018; Renault et al., 2009), we observed strong FoxO1 and FoxO3 expression throughout the DG; whereas FoxO4 expression in the DG was very low and was only detectable by qRT-PCR (Figure S1A, B). qRT-PCR and Western blot analysis showed that adult NSPCs expressed high levels of FoxO1 and FoxO3, and very low levels of FoxO4 (Figure S1B, Figure S3D). We generated conditional knockout mice (GLAST::CreERT2; FoxO1/3/4fl/fl; R26::β-Galactosidase; hereafter referred to as FoxO cKO), which allow for tamoxifen-induced deletion of FoxO1, 3, and 4, in adult NSPCs and tracing of recombined cells and their progeny by expression of β-Galactosidase (β-gal) (Mori et al., 2006; Paik et al., 2007; Soriano, 1999). GLAST::CreERT2; R26::β-Galactosidase mice harboring wildtype alleles for FoxO1, 3, and 4 (hereafter referred to as FoxO WT), served as controls. Recombination was induced in 8-week old mice (Figure S1C). β-gal reporter positive cells in FoxO WT mice were immunoreactive for FoxO1 and FoxO3, while β-gal+ cells in FoxO cKO mice were negative for FoxO1 and FoxO3, demonstrating the successful conditional ablation of the most highly expressed FoxOs (Figure S1D).
To evaluate the short-term and long-term impact of FoxO deletion on hippocampal neurogenesis, animals were analyzed three days, one month, four months and eight months after tamoxifen treatment (Figure S1C). At the earliest time point, removal of FoxO1/3/4 from NSPCs resulted in an increased number of β-gal+ radial glia-like NSPCs expressing the proliferation marker MCM2 (Figure S1E, F) and in higher numbers of Bromodeoxyuridine (BrdU)-incorporating cells (Figure S1H, I), indicating that FoxO-deficiency promoted the activation of NSPCs and increased proliferation in the hippocampal neurogenic niche.
At one month after recombination, the fraction of β-gal+ cells expressing the immature neuronal marker Doublecortin (DCX) or the dentate granule neuron marker PROX1 was comparable between conditional knockout and control mice, indicating that acute FoxO1/3/4 deficiency did not impair neuronal differentiation of NSPCs in vivo (Figure S1M-P).
Starting at 4 months, the number of β-gal+ cells in the DG of FoxO cKO mice was substantially lower than in control mice, suggesting a strong impairment of neurogenesis (Figure S1K, L). Quantification of proliferating cells via BrdU-incorporation 8 months after recombination demonstrated that proliferative activity in the DG of FoxO cKO mice was reduced to approximately half of that in age-matched control mice (Figure S1J). At this time point, we also found significantly lower numbers of radial glia-like NSPCs in FoxO cKO mice (Figure S1K, L). While recombined cells constituted approximately 60% of the radial glia-like NSPCs across all time points, the contribution of recombined cells to the NSPC population progressively declined in conditional knockout mice starting at 4 months after deletion of FoxOs, indicating that FoxO-deficiency impaired long-term maintenance of NSPCs (Figure S1K, L). Strikingly, at 4 months after recombination β-gal+ NSPCs in FoxO cKO mice were negative for MCM2, indicating that FoxO-deficient NSPCs were largely non-proliferative and suggesting that FoxO-deficient NSPCs failed to substantially contribute to cell genesis at later time-points (Figure S1G).
Collectively, our results extend previous findings obtained from developmental deletion of FoxOs (Paik et al., 2009; Renault et al., 2009) and provide direct proof that FoxO function in the adult neurogenic lineage is essential for long-term maintenance of the adult radial glia-like NSPC pool and neurogenesis. The observations that FoxO-deficiency is associated with increased NSPC proliferation early after recombination and loss of NSPCs at late time-points are consistent with the concept that FoxOs are required to restrict activation of quiescent NSPCs to prevent precocious depletion of the NSPC pool.
FoxO-deficiency alters dendrite and spine development of adult-born DG neurons and impairs their long-term survival
In accordance with other studies, we observed FoxO expression in the dentate granule cell layer and in neuronally differentiating adult NSPCs (Figures S1A; Figure S2A, B; Figure S3A) (Hwang et al., 2018; Paik et al., 2009; Renault et al., 2009). This expression pattern raised the possibility that FoxOs may not only play a critical role in the regulation of NSPC function but may also function during later stages of neurogenesis. To conditionally ablate FoxO1/3/4 from the adult neurogenic lineage after the stage of the radial-glia like NSPC, a MML retrovirus bi-cistronically encoding for GFP and Cre-recombinase (CAG-GFP-IRES-Cre) was stereotactically injected into the DG of young adult mice carrying conditional (FoxO1/3/4fl/fl) or wildtype (FoxO1/3/4WT/WT) alleles for FoxOs (Paik et al., 2007; Tashiro et al., 2006b). A MML retrovirus encoding for mitochondria-targeted dsRED (CAG-IRES mito-dsRed) was co-injected to estimate survival of transduced cells in the different experimental conditions (Tashiro et al., 2006a). Animals were sacrificed at 10 days post retrovirus injection (dpi), 21 dpi, 42 dpi and 4 months post injection (Figure 1A). As described above, FoxO4 expression in the DG is very low and was only detectable by qRT-PCR (Figure S1B), but not by immunohistochemistry (Figure S1A). Immunohistochemistry for FoxO1 and 3, i.e., the FoxOs with the highest expression in the DG, confirmed high recombination efficiency in CAG-GFP-IRES-Cre transduced cells in FoxO1/3/4fl/fl animals (Figure S2A and B).
Figure 1.

Adult-born neuron morphogenesis is dependent on FoxO-signaling.
A Experimental scheme of retroviral injection paradigm used in B-G. Adult mice with wildtype or floxed alleles for FoxOs were stereotactically injected with MML-retrovirus and were sacrificed 10 days post injections (dpi), 21 dpi, 42 dpi or 4 months post injections (mpi).
B Retrovirus transduced adult-born neurons in FoxO WT and FoxO cKO mice at 42 dpi. Arrows and arrowheads indicate CAG-GFP-IRES-Cre and CAG-IRES-mito-dsRed double transduced cells and CAG-IRES-mito-dsRed single transduced cells, respectively. Note that double transduced cells in FoxO cKO mice do not bear a long apical dendrite. Scale bars = 10 μm.
C Quantifications of the total dendritic length and length of the apical dendrite at 21 and 42 dpi indicate a transiently reduced total dendritic length and a permanent reduction of the length of the apical dendrite in FoxO cKO mice. n=27/16 (21/42 dpi) WT and n=20/24 (21/42 dpi) cKO cells from 6 mice / group.
D Schematic depiction of a retrovirus transduced DG neuron and the areas chosen for spine analysis.
E Representative reconstructions of FoxO WT and FoxO cKO neurons.
F Representative images showing dendritic segments in different layers of the DG. Note the increased spine density and abnormal spine formation in the GCL of FoxO cKO mice. Scale bars = 1 μm.
G Quantifications of the number of spines in FoxO WT and FoxO cKO neurons. n=10 cells from 4 mice / group.
Data represented as mean ± SEM; t-test was used to determine significance.
Consistent with the finding that FoxO-deletion in radial glia-like NSPCs did not affect neuronal fate determination (Figure S1M-P), Cre-transduced cells in FoxO1/3/4fl/fl and FoxO1/3/4WT/WT animals showed similar levels of neuronal differentiation as determined by the expression of the neuronal markers DCX and Calbindin (Figure S2H). To evaluate effects of FoxO1/3/4 deletion on survival, we compared the fraction of CAG-GFP-IRES-Cre and CAG-IRES-mito-dsRed double-positive neurons (identified by co-expression of GFP and dsRed) amongst all CAG-IRES-mito-dsRed (identified by expression of dsRed) expressing neurons across time. While the fraction of neurons generated by double-transduced NSPCs remained comparable between all time-points in FoxO1/3/4WT/WT animals, the fraction of double-positive neurons in FoxO1/3/4fl/fl animals was decreased 4 months after transduction compared to earlier time-points, indicating that FoxOs are required for long-term survival of adult-generated DG neurons (Figure S2C) and that impaired survival of FoxO-deficient adult-born neurons contributed to the progressive decline of recombined cells in the DG of FoxO cKO mice (see Figure S1K, L).
GFP expression in CAG-GFP-IRES-Cre transduced cells allowed us to evaluate the impact of FoxO deletion on the morphology of newly generated neurons. Analysis at 21 and 42 dpi revealed a transient decrease in total dendritic length in FoxO-deficient neurons (Figure 1C). Sholl analysis indicated a subtle but highly reproducible difference in dendritic structure at 21 and 42 dpi (Figure 1E; Figure S2F). This difference was not caused by alterations in the number of branch points and dendrite termini (Figure S2D, E), but by the absence or substantial shortening of the apical dendrite in FoxO-deficient neurons, which in WT cells spans the granule cell layer and branches into secondary dendrites in the molecular layer (Figure 1B, C, E). Similar to control neurons, FoxO-deficient neurons were located within the lower third of the DG, indicating that apical dendrite shortening was not caused by altered positioning of the neuronal soma along the radial axis (Figure S2G).
We next analyzed the impact of FoxO-deficiency on spine density and morphology as a proxy for the development of the glutamatergic postsynaptic compartment (Goncalves et al., 2016b; Zhao et al., 2006). Compared to WT neurons, FoxO-deficient neurons bore more spines in the inner molecular layer (iML) and outer molecular layer (oML) at both time-points (Figure 1D, F, G). Most intriguingly, FoxO-deficient neurons also bore spines within the granule cell layer (GCL), while their WT counterparts only had spines in the molecular layer (Figure 1D, F, G). Morphometric analysis of spine morphology showed that FoxO-deficient neurons had more thin spines, whereas the density of mushroom spines and filopodia spines was comparable between FoxO-deficient and WT neurons (Figure S2I).
Expression of the immediate early gene c-fos is associated with neuronal activity and is commonly used as a proxy for the functional incorporation of adult-born neurons into the hippocampal circuit (Jungenitz et al., 2014; Kee et al., 2007; McAvoy et al., 2016). While the overall number of c-fos+ cells in the DG of FoxO1/3/4fl/fl and FoxO1/3/4WT/WT was comparable (Figure S2K), the fraction of c-fos+ cells was significantly reduced amongst 42 dpi FoxO-deficient neurons compared to their WT counterparts (Figure S2J, L).
Collectively, these data demonstrate that FoxOs participate in the control of dendrite and spine development and affect the integration of adult-born dentate granule neurons into the hippocampal circuit.
FoxO1/3/4-deficiency impairs autophagic flux in NSPCs and their progeny
In order to analyze adult FoxO-deficient NSPCs and their progeny in more detail, we established NSPC cultures from adult (8-week old) FoxO1/3/4fl/fl mice. NSPCs were grown as free-floating neurospheres and were transduced with either a MML retrovirus encoding for GFP (CAG-GFP-IRES-GFP; control cells) or a MML retrovirus encoding for Cre-recombinase (CAG-GFP-IRES-Cre; knockout cells). Transduced cells were enriched by fluorescence activated cell sorting (FACS) on the basis of GFP expression. Notably, while FACS-purified cultures silenced GFP expression over time, repeated genotyping, western blot analyses for FoxO1, FoxO3, and FoxO4, and immunocytochemistry with antibodies against FoxO1 and FoxO3, confirmed the Cre-mediated cKO in CAG-GFP-IRES-Cre transduced cells (Figure S3B-E).
Interestingly, FoxO cKO cells showed increased proliferation and generated more neurospheres in single cell neurosphere assays over several passages than control cells (Figure S3F-H). In these assays, NSPCs isolated from 8-week-old FoxO1/3/4WT/WT mice and transduced with the CAG-GFP-IRES-Cre virus showed similar characteristics to control cells (Figure S3G), indicating that increased proliferation and neurosphere formation were the result of FoxO-deficiency and not of the expression of Cre-recombinase. In addition, FoxO-deficiency altered the differentiation pattern of NSPCs with FoxO cKO cells generating significantly more DCX+ and MAP2ab+ neurons and less GFAP+ astrocytes compared to control cells (Figure S3I, J).
FoxOs have been proposed to control cellular homeostasis through the regulation of the ubiquitin–proteasome pathway and the autophagy–lysosome pathway (ALP) (Eijkelenboom and Burgering, 2013; Webb and Brunet, 2014). Here, we focused on the impact of FoxO-deficiency on ALP activity and first measured the levels of autophagosome marker proteins (Klionsky et al., 2016). During autophagosome formation, the soluble form of MAP1LC3/LC3-I (microtubule-associated protein light chain 3) is conjugated to the lipid phosphatidylethanolamine on the autophagosome membrane generating the LC3-II form of the protein (Tanida et al., 2004). The selective autophagy receptor protein sequestosome 1/p62 (SQSTM1/p62) interacts with ubiquitin chains to deliver polyubiquitinated cargoes to the autophagosome (Lippai and Low, 2014). Notably, we observed stronger immunoreactivity for LC3 and p62 in FoxO cKO cells compared to control cells (Figure 2A, B). Similarly, western blot analyses showed higher LC3-II levels and p62-levels in FoxO cKO cells compared to control cells under both proliferating and differentiating conditions (Figure 2C, D; Figure S4A, B). Since higher LC3-II and p62 levels in FoxO-deficient cells could indicate the increased presence of autophagosomes, we examined cells at the ultrastructural level. Transmission electron-microscopic analysis revealed that in contrast to controls, FoxO cKO cells were packed with vacuolar structures containing electron-dense material and parts of the cytosol (Figure 2F), which is consistent with the accumulation of autophagosomes and autophagolysosomes, i.e., the products of the fusion of autophagosomes with lysosomes.
Figure 2.

Impairments in the autophago-lysosomal degradation system in FoxO-deficient cells in vitro.
A, B Representative confocal images and total corrected cell fluorescence based quantifications of the autophagic markers LC3 and p62 in control and FoxO cKO NSPCs after 6 days of differentiation revealed increased immunoreactivity for LC3 and p62 in FoxO cKO cells. n=3 (LC3) and n=4 (p62) biological replicates / group. Scale bars = 10 μm.
C Western blots of lysates of differentiated control and FoxO cKO cells. Antibodies against LC3I/II and p62 were applied as markers of the autophagic system. β-actin was used as endogenous loading control. For quantification in D and E, protein amounts were normalized to β-actin and subsequently compared to control cells.
D Differentiated FoxO cKO cells showed increased protein content of LC3-II and p62 compared to control cells. n=4 biological replicates / group.
E BafA1 turnover assay reveals a decreased BafA1+/BafA1-ratio of LC3-II and p62 protein content in FoxO cKO cells compared to control cells indicating an impairment in autophagic flux. n=4 biological replicates / group.
F Electron microscopic analysis shows increased accumulation of vacuoles with electron dense content indicative for autophagosomes and autophagolysosomes in FoxO-deficient NSPCs differentiated for 6 days. Scale bars = 2.5 μm.
G Confocal images of control and FoxO cKO NSPCs transduced with CAG-mCherry/GFP/LC3 retrovirus to assess the autophagic flux. Cells were differentiated for 6 days and treated with vehicle or BafilomycinA1 12h prior fixation. FoxO deficient cells revealed substantial more and larger autophagosomes (yellow puncta) under vehicle conditions. While control cells showed autophagosomes (yellow puncta) and functional autophagolysosomes (red only puncta), almost no functional autophagolysosomes were detected in FoxO cKO cells. Blocking the autophagic flux with BafA1 lead to a massive accumulation of autophagosomes in control cells while no visible change was observed in FoxO cKO cells. Scale bars = 10 μm.
H, I Line intensity plots of the fluorescence signals qualitatively depict the autophagosomes (overlap of high GFP and high mCherry signal) and functional autophagolysosomes (low GFP / high mCherry signal). Scale bars = 1 μm.
Data represented as mean ± SEM; t-test was used to determine significance.
To distinguish whether FoxO-deficiency increased or inhibited activity of the ALP, we biochemically measured autophagic flux, i.e., the amount of autophagic degradation. BafilomycinA1 (BafA1) disrupts ALP activity by inhibiting V-ATPase-dependent acidification and autophagosome-lysosome fusion (Mauvezin and Neufeld, 2015) and results in accumulation of autophagy substrates including LC3 and p62. The degree of accumulation in LC3 and p62 following BafA1 treatment thus serves as a measure of autophagic flux. Control and FoxO cKO cells were treated with a 12 h pulse of BafA1 or vehicle prior to harvesting followed by western blot analysis. The BafA1 over vehicle ratio for p62 and LC3-II was significantly lower in FoxO cKO cells both under differentiation and proliferation (Figure 2C, E; Figure S4A, C), indicating that FoxO-deficiency resulted in impaired autophagic flux.
mTOR kinase activity suppresses the ALP by negatively regulating autophagosome formation and is used as an additional indirect indicator of ALP activity (Bai et al., 2017; Boland et al., 2008; Zhang et al., 2017). Immunohistochemical and biochemical analyses showed that the level of phosphorylated over total S6 protein (pS6/S6), which indicates mTOR activity, was higher in differentiated FoxO-deficient NSPCs than in control NSPCs (Figure S4D-F). Similarly, pS6 immunoreactivity was higher in β-gal+ recombined cells of FoxO cKO mice as compared to the β-gal+ recombined cells in control mice (Figure S4G, H).
To further validate impaired autophagic flux and the identity of accumulated autophagy-related structures in FoxO cKO cells, we employed a tandem monomeric mCherry-GFPtagged LC3 reporter (mCherry/GFP/LC3) (N’Diaye et al., 2009; Pankiv et al., 2007), which takes advantage of the differential pH-sensitivity of the mCherry and GFP fluorescent proteins. While mCherry fluorescence is pH-stable, GFP is pH-sensitive and is quenched under the acidic conditions as present in functional autophagolysosomes. Under physiological conditions, co-localization of mCherry with GFP is characteristic of an autophagosome, while a mCherry signal without GFP is characteristic of a functional autophagolysosome (Figure S4J). Control and FoxO cKO cells were transduced with an MML retrovirus encoding for mCherry/GFP/LC3 (CAG-mCherry/GFP/LC3) and differentiated for 6 days (Figure S4I). Control cells with neuronal morphology showed both double positive GFP+/mCherry+ puncta and mCherry-only (GFP-/mCherry+) puncta (Figure 2G, H). Consistent with BafA1’s inhibitory effect on acidification and autophagosome-lysosome fusion, BafA1 treatment resulted in the almost complete abolition of GFP-/mCherry+ puncta (Figure 2G). In contrast, FoxO-deficient cells contained more and larger GFP+/mCherry+ puncta but almost no GFP-/mCherry+ puncta already without BafA1 treatment (Figure 2G, I). Similar observations were made under proliferative conditions (Figure S4K). Collectively, these data support the notion that FoxO-deficiency results in impaired autophagic flux and suggest that the structures accumulated within FoxO-deficient cells were autophagosomes and non-functional autophagolysosomes. qRT-PCR analysis of FoxO cKO cells revealed decreased expression of several genes involved in early and later stages of the ALP such as autophagosome formation (e.g., Atg5, ATG7, Atg9a, ATG12, Atg14), maturation and autophago-lysosomal fusion (e.g., Rab5a, Rab7, VPS34) (Figure S4L) (Eskelinen and Saftig, 2009; Zhao and Zhang, 2018). Analysis of a FoxO3 ChIP-seq dataset revealed enrichment of FoxO3 on enhancers of several of these genes in adult NSPCs (Figure S4M) (Webb et al., 2016; Webb et al., 2013). These observations suggest that FoxOs impact on ALP at least in part through the direct regulation of an autophagy-related gene network.
To analyze autophagy in adult-born neurons in vivo, we injected the CAG-mCherry/GFP/LC3-IRES-Cre MML-retrovirus, which bi-cistronically encodes for mCherry/GFP/LC3 and Cre-recombinase, into the DG of adult FoxO1/3/4WT/WT or FoxO1/3/4fl/fl mice. Animals were sacrificed 21 days after virus injection (Figure 3A). In line with a previous report, mCherry/GFP/LC3 reporter expressing newborn neurons were characterized by a cytoplasmic GFP signal and pronounced mCherry+ puncta (Figure 3B) (Xi et al., 2016). To clearly distinguish autophagosomes from autophagolysosomes, mCherry+ puncta were analyzed in orthogonal views from different planes (xy, xz, and yz, Figure 3C) for GFP co-localization. Compared to control neurons, FoxO-deficient neurons contained more and larger autophagosomes (GFP+/mCherry+), almost no functional autophagolysosomes (GFP-/mCherry+), and thus showed a massive decrease in the functional autophagolysosome to autophagosome ratio as a measure of autophagic flux (Figure 3D). In summary, the in vitro and in vivo analyses consistently indicate that FoxO-deficiency impairs autophagic flux in the adult neurogenic lineage.
Figure 3.

Impaired autophagic flux in developing FoxO-deficient neurons in vivo.
A Experimental scheme for analysis of autophagic flux in adult-born WT and FoxO-deficient neurons in vivo using the CAG-mCherry/GFP/LC3-IRES-Cre retrovirus.
B Confocal images of FoxO WT and FoxO cKO cells in the DG of adult mice transduced with a CAG-mCherry/GFP/LC3-IRES-Cre retrovirus at 21 dpi.
C Orthogonal views of a mCherry/GFP/LC3-IRES-Cre transduced FoxO WT and cKO cell illustrate the detection of a functional autophagolysosome (red only puncta, I) and of an autophagosome (red + green puncta, II).
D Quantifications revealed an increased number of autophagosomes (yellow puncta) in the FoxO cKO cells, while functional autophagolysosomes (red only puncta) were rarely detected in the FoxO deficient cells. Calculation of the ratio of autophagolysosomes to autophagosomes showed impaired autophagic flux in FoxO cKO cells. n=10 cells from 4 mice / group.
Data represented as mean ± SEM; t-test was used to determine significance; all scale bars = 1 μm.
Induction of autophagic flux rescues FoxO1/3/4 cKO phenotypes in vitro and in vivo
Next, we tested the impact of activating autophagy on FoxO knockout phenotypes. For activation, we used the mTOR inhibitor Rapamycin and the mTOR-independent autophagy activator Trehalose (DeBosch et al., 2016; Fletcher et al., 2013; Mayer et al., 2016; Sarkar et al., 2007) (for experimental scheme see Figure S4I). Rapamycin treatment of FoxO cKO and control cells decreased mTOR activity as indicated by reduced pS6 immunoreactivity and a lower pS6/S6 ratio (Figure S5A-C). Consistent with its mTOR-independent mode of action, Trehalose treatment did not alter the pS6/S6 ratio (Figure S5B, C). We next examined the impact of Rapamycin and Trehalose treatment on autophagic flux. Both compounds led to a trend towards higher p62 levels and significantly increased the levels of LC3-II in FoxO cKO cells (Figure S5D). The ratio of LC3-II levels in BafA1+ to BafA1-conditions was similar between control and treatment conditions (Figure S5E); given, however, that total LC3-II levels were robustly elevated in Rapamycin and in particular in Trehalose conditions, these data suggest that Rapamycin and Trehalose enhanced autophagy in FoxO cKO cells. In control cells, p62 levels remained relatively constant and LC3-II levels were only slightly increased (approximately 1.5-fold) after Rapamycin and Trehalose treatment (Figure S5D). Neither Rapamycin nor Trehalose substantially increased the BafA1+ / BalfA1-ratios of p62 and LC3-II in control cells (Figure S5E), which may be due to the phenomenon that in cells with a high rate of autophagic flux, additional changes in LC3 and p62 turnover upon induction of autophagy cannot be sensitively detected by western blot (Mizushima et al., 2010).
To clarify whether Rapamycin and Trehalose treatment induced autophagy, we used the mCherry/GFP/LC3 reporter. In Rapamycin and Trehalose treated control cells, the number and size of GFP+/mCherry+ puncta (autophagosomes) as well as the number of the GFP-/mCherry+ puncta were increased (functional autophagolysosomes), indicating ALP induction (Figure 4A, B; Figure S5F, G). In line with our previous observations, autophagolysosomes were only very rarely present in vehicle-treated FoxO cKO cells (Figure 2G; Figure 4A, B; Figure S4K, S5F, G). FoxO-deficient cells treated with Rapamycin and Trehalose contained numerous autophagolysosomes indicating that both compounds induced autophagy (Figure 4A, B; Figure S5F, G). Remarkably, Rapamycin and Trehalose treated FoxO cKO cells showed proliferation and neuronal differentiation levels that were comparable to control cells (Figure 4C, D and Figure S5H).
Figure 4.

Autophagy induction reverts the in vitro phenotype of FoxO-deficient cells.
A Confocal images of control and FoxO cKO cells transduced with CAG-mCherry/GFP/LC3 retrovirus, treated with either Vehicle, Rapamycin, Trehalose, or BafilomycinA1 (BafA1) and differentiated for 6 days in vitro. Line intensity plots of the fluorescence signals qualitatively depict autophagosomes (overlap of high GFP and high mCherry signal) and functional autophagolysosomes (low GFP / high mCherry signal). Scale bar = 1 μm.
B Rapamycin and Trehalose increased the number of autophagosomes (yellow puncta) and autophagolysosomes (red only puncta) in control cells indicating a functional induction of autophagy and the autophagic flux. Rapamycin and Trehalose increased the number of autophagolysosomes (red only puncta) in FoxO cKO cells indicating an induction of the autophagic flux. n=10 cells from 3 biological replicates / group.
C Representative images of control and FoxO cKO cells differentiated for 6 days and treated with either Vehicle or Rapamycin or Trehalose stained against GFAP (grey), DCX (red) and DAPI (blue).
D Quantification of GFAP and DCX expressing cells showed that neuronal differentiation of FoxO cKO cells was comparable to control cells following Rapamycin (R) and Trehalose (T) treatment. Vehicle treatment (V). n=3 biological replicates / group. Scale bars = 10 μm.
Data represented as mean ± SEM; t-test was used to determine significance.
We also sought to genetically inhibit mTOR activity to induce autophagy in FoxO cKO cells. To this end, we retrovirally overexpressed a dominant-negative mutant of the mTOR activator Rheb GTPase, i.e., RhebD60I, which powerfully inhibits mTOR activity (Tabancay et al., 2003). Using the mCherry/GFP/LC3 reporter we found increased number of autophagolysosomes and enhanced autophagic flux in RhebD60I expressing control and FoxO cKO cells (Figure S6A, B). Similar to Rapamycin and Trehalose treatment, RhebD60I expression corrected excessive neuronal differentiation of FoxO cKO cells and resulted in differentiation rates that were comparable to control cells (Figure S6C, D).
Next, we sought to determine whether induction of autophagic flux ameliorated the dendrite and spine phenotype of FoxO-deficient adult-generated neurons. Retroviral over-expression of RhebD60I resulted in death of newborn neurons between 7 and 21 dpi (data not shown), which precluded further analysis of the effects of RhebD60I-induced autophagic flux in vivo. We therefore focused in the following on the effects of Rapamycin and Trehalose treatment. FoxO1/3/4fl/fl and FoxO1/3/4WT/WT animals were stereotactically injected with the CAG-mCherry/GFP/LC3-IRES-Cre retrovirus and were treated for 21 days with Rapamycin (2 mg/kg bodyweight i.p., 3 times / week), Trehalose (2 g/kg bodyweight i.p., 3 times / week; + 3% w/v Trehalose in the drinking water), or vehicle (DMSO) as control (Figure 5A). Immunohistochemistry showed decreased pS6 immunoreactivity in Rapamycin treated animals, thus validating in vivo mTOR pathway inhibition (Figure S7A). Rapamycin and Trehalose treatment resulted in comparable increases in both the number of autophagosomes and autophagolysosomes in FoxO WT neurons (Figure 5B, C). FoxO-deficient neurons contained almost exclusively autophagosomes (GFP+/mCherry+) in vehicle treatment conditions. Yet, both compounds robustly induced autophagic flux in FoxO-deficient neurons as evidenced by the appearance of autophagolysosomes and the increase in the autophagolysosome to autophagosome ratio (Figure 5C). These data indicate that treatment with either compound induced autophagy in control and FoxO-deficient neurons.
Figure 5.

Rapamycin and Trehalose enhance autophagic flux in FoxO-deficient cells in vivo.
A Experimental scheme of retroviral injections and autophagy induction paradigm in vivo. Adult FoxO WT and FoxO cKO mice were stereotactically injected with the CAGmCherry/GFP/LC3-IRES-Cre retrovirus. For autophagy induction animals were i.p. injected with Rapamycin or Trehalose 3 times / week. Animals were sacrificed 21 dpi.
B Confocal images of CAG-mCherry/GFP/LC3-IRES-Cre retrovirus transduced adult-born neurons in adult FoxO WT and cKO mice treated with Vehicle, Rapamycin or Trehalose.
Scale bars = 1 μm.
C Quantifications of autophagosomes (yellow puncta) and autophagolysosomes (red only puncta) showed efficient induction of autophagy by Rapamycin and Trehalose both in FoxO WT and cKO cells in vivo. The number of autophagosomes and autophagolysosomes was significantly elevated in FoxO WT cells. Rapamycin and Trehalose enhanced autophagic flux in FoxO cKO cells depicted by the increasing number of autophagolysosomes (red only puncta). n=15–16 cells from 4 mice / group.
Data represented as mean ± SEM; t-test was used to determine significance.
Finally, we analyzed the impact of Rapamycin and Trehalose-induced autophagy on dendrite and spine morphology. FoxO1/3/4fl/fl and FoxO1/3/4WT/WT mice were injected with CAG-GFP-IRES-Cre and CAG-IRES-mito-dsRed retroviruses, treated with the compounds, and sacrificed 21 or 42 days later (Figure 6A). Neither Rapamycin nor Trehalose affected cell survival between 21 and 42 days (Figure S7B). Neurons in vehicle, and compound-treated FoxO1/3/4WT/WT mice showed similar dendritic morphologies and spine densities (Figure 6B, C, Figure 7A, B and Figure S7 C). In line with our previous findings (Figure 1 and Figure S2), vehicle-treated FoxO-deficient neurons showed reduced total dendritic length at 21 dpi, bore no or only a short apical dendrite at both time-points, and showed aberrant spine formation and increased spine densities in the GCL, iML, and oML, respectively (Figure 6B, C, D, Figure 7A, B and Figure S7D). Strikingly, dendritic morphologies of neurons in Rapamycin and Trehalose-treated FoxO1/3/4fl/fl were similar to dendritic morphologies of WT neurons (Figure 6B-D). Furthermore, Rapamycin and Trehalose treatment normalized spine numbers in FoxO cKO neurons in the GCL, iML, and oML, at 21 dpi, and in the GCL and the oML at 42 dpi (Figure 7A, B), and corrected the density of thin spines in FoxO cKO neurons to WT levels (Figure S7F). Treatment with Rapamycin or Trehalose did not alter the fraction of c-fos+ neurons amongst WT neurons but resulted in a strong trend towards higher numbers of c-fos+ neurons amongst FoxO cKO neurons (Figure S7G), suggesting that induction of autophagy partially corrected deficits in the integration of FoxO-deficient neurons into the hippocampal circuit. Overall, the mTOR inhibitor Rapamycin and the mTOR-independent inducer of autophagy Trehalose were equally powerful in rescuing the FoxO-phenotype, indicating that the FoxO-phenotype was caused by impaired autophagic activity and not by autophagy-independent functions of the hyperactivated mTOR pathway (Feliciano et al., 2013; Switon et al., 2017). Collectively, these data strongly indicate that FoxO-dependent autophagic activity is essential for dendrite and spine development in adult-born neurons.
Figure 6.

Autophagy induction reverts the dendrite phenotype of FoxO-deficient cells in vivo.
A Experimental scheme of retroviral injections and autophagy induction paradigm in vivo. Adult FoxO WT and FoxO cKO mice were stereotactically injected with a GFP-IRES-Cre retrovirus and a mito-dsRed retrovirus into the dentate gyrus. For autophagy induction, animals were injected with Rapamycin or Trehalose 3 times / week. Animals were sacrificed 21 dpi or 42 dpi.
B Representative reconstructions of FoxO WT and cKO neurons.
C Quantification showed increased total dendritic length at 21 dpi and increased apical dendrite length at 21 and 42 dpi after Rapamycin and Trehalose injections in the FoxO cKO cells. n=10 (21 dpi) and n=16–17 (42 dpi) cells from 4 mice / group.
D Consistent with the shortened apical dendrite, Sholl analysis of 21 dpi and 42 dpi neurons show a significant left shift of the curve in FoxO cKO cells. Induction of autophagy via Rapamycin and Trehalose rescued the shortened apical dendrite phenotype and reverted the left shift of the curve in FoxO cKO cells at both time points. n=10 (21 dpi) and n=15 (42 dpi) cells from 4 mice / group.
Data represented as mean ± SEM; t-test was used to determine significance if not indicated otherwise; all scale bars 10 μm.
Figure 7.

Autophagy induction normalizes spine density of FoxO-deficient cells in vivo
A Representative images showing dendritic segments of adult-born neurons in different layers of the DG following Vehicle, Rapamycin, or Trehalose, at 21 dpi and 42 dpi.
B Rapamycin and Trehalose treatment reduced spine density in the FoxO cKO cells. n=10 cells from 4 mice / group.
Data represented as mean ± SEM; t-test was used to determine significance; all scale bars 1 μm.
Discussion
Here, we explored the function of FoxO transcription factors in adult hippocampal neurogenesis using an adult-specific conditional knockout approach. Similar to FoxO deletion during embryonic stages, GLAST::CreERT2 driven conditional deletion of FoxOs in adult mice resulted in increased NSPC activation, hyper-proliferation, and precocious depletion, thus strengthening the notion that FoxO function is essential for long-term maintenance of the NSPC pool (Paik et al., 2009; Renault et al., 2009). In addition, we observed impaired long-term survival of adult-generated cells in FoxO cKO mice. Because GLAST::CreERT2 is also active in astrocytes, we cannot fully exclude the possibility that astrocytic expression of FoxO contributes to the regulation of adult NSPCs and adult-born neuron survival. The findings i) that FoxO-ablation in isolated NSPCs was also associated with hyper-proliferation, and that ii) selective ablation of FoxOs in fast proliferating precursor cells resulted in impaired neuronal survival in vivo, however, argue that at least part of the in vivo phenotype is a direct consequence of FoxO function in NSPCs and their progeny.
The main discovery of this study is the critical function of FoxO-dependent autophagy in establishing the stereotypic dendritic architecture and spine distribution of adult-generated DG neurons. We demonstrate that loss of FoxO transcription factors is associated with altered dendrite morphology, defects in spine numbers and spine positioning, and altered integration into the hippocampal circuit. We also show that FoxO transcription factors are required to maintain physiological autophagic flux and that pharmacological induction of autophagy in FoxO-deficient DG neurons was paralleled by a substantial reversal of dendrite and spine defects.
In vivo, treatment with pharmacological inducers of autophagy may have also affected the function of neurogenic niche cells, which provide regulatory signals for the development of adult-generated neurons (Goncalves et al., 2016a). It is therefore possible that the in vivo rescue of the dendrite and spine phenotype was mediated at least in part by mechanisms other than induction of autophagy in FoxO-deficient neurons. To resolve this issue, future studies should aim to selectively induce autophagy in FoxO-deficient neurons. In preliminary experiments we sought to cell-specifically stimulate autophagy by retrovirus mediated over-expression of a powerful upstream inhibitor of mTOR function, i.e., RhebD60I. In vitro, RhebD60I over-expression strongly induced autophagy and rescued the FoxO-deficiency associated differentiation phenotype. In vivo, however, RhebD60I caused death of adult-generated neurons prior to the time-points for analysis of the dendrite and spine compartment - potentially because of the prolonged massive inhibition of the mTOR pathway (Urbanska et al., 2018), which precluded further analysis of the impact of cell-autonomous induction of autophagy on the FoxO-phenotype. Development of strategies for targeted induction of autophagy in FoxO-deficient neurons will have to take into account that FoxOs regulate multiple key factors of the ALP.
A previous study investigated the function of autophagy in adult-born DG neuron development through knockout of the autophagy-related gene Atg5 and observed only a transient decrease in spine numbers and no alteration of dendrite morphology (Xi et al., 2016). At present, we can only speculate why FoxO-deficiency and Atg5-deficiency, which both impair autophagy, result in distinct phenotypes. Deletion of different autophagy genes in the same cell type can produce divergent outcomes (Li et al., 2016; Lv et al., 2014; Vazquez et al., 2012; Wang et al., 2016; Wang et al., 2017; Wu et al., 2016; Yazdankhah et al., 2014). Such differences are thought to be the consequence of autophagy-independent gene functions or of the existence of alternate autophagy pathways. Indeed, there is evidence for an Atg5-independent autophagic pathway (Nishida et al., 2009), whose activity may underlie the phenotypic differences between Atg5- and FoxO-deficient cells. Moreover, Atg5 is involved in early stages of the ALP, i.e., autophagosome elongation / formation (Klionsky et al., 2016), whereas FoxO-deficiency affects not only key genes involved in multiple stages of the ALP (Figure S4L, M) but also activity of the ALP regulating mTOR pathway (Figure S4D-H, (Hay, 2011)). It has also been reported that FoxO transcription factors can regulate the expression of neuronal polarity-, neurite growth-, and synaptic genes (de la Torre-Ubieta et al., 2010; Salih et al., 2012) and it is possible that dysregulation of such genes may have contributed to the complex phenotype of FoxO-deficient DG neurons.
It will be important to understand how FoxO-dependent autophagy controls neuronal development. Autophagy plays an integral role in cellular homeostasis and the cellular stress response through removal of protein aggregates and dysfunctional organelles (Marino et al., 2011). Absence of the apical dendrite of adult-born DG neurons was suggested as a common sign of cellular stress in the developing DG neuron (Llorens-Martin et al., 2015), raising the possibility that the dendritic phenotype may primarily reflect cellular stress due to loss of FoxO-dependent autophagy (Webb and Brunet, 2014). Autophagy can directly target spines and degrade organelles such as centrosomes and mitochondria, whose activity has recently been linked to neuronal morphogenesis and spine development (Beckervordersandforth et al., 2017; Li et al., 2004; Nikoletopoulou et al., 2017; Park et al., 2014; Ploumi et al., 2017; Steib et al., 2014; Tang et al., 2014; Watanabe et al., 2016). Thus, FoxO-dependent autophagy may be required to remove spines and to adapt organelle content for physiological dendrite and spine development. Finally, impaired autophagy was described to affect interaction of the postnatal neurogenic lineage with microglia (Wang et al., 2017). Given the role of microglia in shaping synaptic connections (Hong et al., 2016) it has to be considered that the excessive spine numbers may in part stem from altered interaction of FoxO-deficient neurons with microglia. Altered crosstalk of FoxO-deficient cells with niche cells may also be responsible for our observation that FoxO-deficiency differentially affected the rate of neuronal differentiation under in vivo conditions and niche-free in vitro conditions (Figure S1M-P, Figure S3I, J).
We observed alterations in the percentage of activated, i.e., c-fos+ FoxO-deficient neurons, indicating that the perturbation of dendritic architecture and of the spine number and distribution impacted on the integration of FoxO-deficient neurons into the hippocampal circuit. Intriguingly, FoxO-deficient neurons had a lower probability for c-fos expression despite their excessive number of spines, which raises interesting questions such as whether spines generated in excess were functional and whether FoxO-deficiency impacted on inhibitory synapse formation. It will also be interesting to determine whether the altered integration contributed to the decreased long-term survival of FoxO-deficient neurons.
Dysregulation of autophagy, perturbation of spine formation, and altered neuronal activity patterns have been identified as contributing mechanisms in the pathophysiology of autism-spectrum disorders (ASD) (Luikart et al., 2011; Nelson and Valakh, 2015; Tang et al., 2014). Notably, embryonic deletion of FoxOs reproduce neuropathological features found in a subset of ASD patients, i.e., increased brain size and cortical thickness - (Khundrakpam et al., 2017; Paik et al., 2009). Moreover, there are indications that FoxOs operate downstream of the ASD-linked genes Cav1.2 and MeCP2 (Nott et al., 2016; Tian et al., 2014). It will be interesting to investigate whether the requirement FoxO-dependent autophagy for neuronal development during adulthood extends to the developmental period and whether dysregulation of the FoxO-autophagy pathway constitutes a common pathway in the pathophysiology of a subset of ASD.
STAR★METHODS
CONTACT FOR REAGENT AND RESOURCE SHARING
Further information and requests for reagents may be directed to, and will be fulfilled by the corresponding author, D. Chichung Lie (chi.lie@fau.de).
EXPERIMENTAL MODEL AND SUBJECT DETAILS
All experiments were carried out in accordance with the European Communities Council Directive (86/609/EEC) and were approved by the Government of Upper Bavaria. FoxO1/3/4fl/fl mice (Paik et al., 2007), GLAST::CreERT2 mice (Mori et al., 2006) and β-galactosidase (Rosa26R) reporter mice (Soriano, 1999) have been described previously. For all experiments, mice were group housed in standard cages under a 12 h light/dark cycle with ad libitum access to water and food. In experiments involving FoxOfl/fl/FoxOWT/WT, GLAST::CreERT2, β-galactosidase (Rosa26R) mice we used female (f) and male (m) mice. Groups were age and sex matched [f:m ratio for 3 dpt and 1 mpt time-points = 2:1; f:m ratio for 4 mpt and 8 mpt time-points = 1:2]. In experiments involving retrovirus-mediated ablation of FoxOs, we exclusively used female FoxOfl/fl and FoxOWT/WT mice. For in vitro studies, NSPCs were isolated from female FoxOfl/fl mice.
METHOD DETAILS
Tissue processing
Animals were sacrificed using CO2. Mice were transcardially perfused with 100ml phosphatebuffered saline (PBS, pH 7.4) followed by 100ml 4% paraformaldehyde (PFA, pH 7.4, Roth, Cat# 0335) at a rate of 20 ml/min. Brains were post fixed in 4% PFA for 3h at room temperature and were subsequently transferred to a 30% sucrose solution. Coronal brain sections were produced using a sliding microtome (Leica Microsystems, Wetzlar, Germany).
Genotyping
The following primers were used for genotyping GLAST::CreERT2, β-galactosidase(Rosa26R) and FoxO1/3/4fl/fl mice or cells:
| FoxO1: | fwd GCTTAGAGCAGAGATGTTCTCACATT, |
| rev1 CCAGAGTCTTTGTATCAGGCAAATAA, | |
| rev2 CAAGTCCATTAATTCAGCACATTG | |
| FoxO3: | fwd ATTCCTTTGGAAATCAACAAAACT, |
| rev1 TGCTTTGATACTATTCCACAAACCC, | |
| rev2 AGATTTATGTTCCCACTTGCTTCCT | |
| FoxO4: | fwd CTTCTCTGTGGGAATAAATGTTTGG, |
| rev1 CTACTTCAAGGACAAGGGTGACAG, | |
| rev2 TGAGAAGCCATTGAAGATCAG | |
| GLAST::CreERT2: | fwd1 GAGGCACTTGGCTAGGCTCTGAGGA, |
| fwd2 GGTGTACGGTCAGTAAATTGGACAT, | |
| rev GAGGAGATCCTGACCGATCAGTTGG | |
| Rosa26R: | fwd1 CACACCAGGTTAGCCTTTAAGC, |
| fwd2 GCGAAGAGTTTGTCCTCA, | |
| rev CAAAGTCGCTCTGAGTTGTTATC. |
In vitro assays
Neural stem/precursor cell (NSPC) isolation
NSPCs were isolated from the forebrain of 8-week old FoxO1/3/4fl/fl mice with the MACS neural tissue dissociation kit according to manufacturer’s protocol (MACS Miltenyi Biotec, Cat# 130–092-628). Cells were kept in proliferative growth medium consisting of DMEM F12 Glutamax (GIBCO, Cat# 10565018) medium with 1×Neurobrew-21 (MACS Miltenyi Biotec, Cat# 130–093-566), 1×PSF (GIBCO, Cat# 15240062) 8mM HEPES and 10ng/ml EGF (Peprotech, Cat# AF-100–15) and 10ng/ml FGF (Peprotech, Cat# AF-100–18B) and were grown as neurospheres in cell culture flasks (Greiner Bio-one, Cat# 658175).
KO induction of FoxO1/3/4fl/fl cells
FoxO1/3/4fl/fl NSPCs were grown as neurospheres and dissociated with Accutase (Millipore, Cat# SCR005) into single cells. Five million cells were seeded in 10 ml growth medium on 10 cm tissue culture plates coated with PDL/Laminin. After 24 hours cells were transduced with a GFP encoding control MML-retrovirus or a MML-retrovirus bi-cistronically encoding for Cre recombinase and GFP. Cells were FACsorted for homogenous GFP-positive populations and recombination was confirmed via genotyping PCR, western blots, and immunocytochemistry.
Transmission electron microscopy
For transmission electron microscopy, differentiated control and FoxO cKO cells were fixed in 2.5% glutaraldehyde in 0.1M phosphate buffer, post fixed in 2% buffered osmium tetroxide, dehydrated in graded alcohol concentrations, and embedded in epoxy resin according to standard protocols. 1 μm semithin sections for orientation were stained with toluidine blue. Ultrathin sections were stained with uranyl acetate and lead citrate and examined with a transmission electron microscope (EM 906E; Carl Zeiss Microscopy, Oberkochen, Germany).
Proliferation assays
For single cell neurosphere assays, NSPCs were grown as neurospheres and dissociated with Accutase (Millipore, Cat# SCR005) into single cells. Dissociated cells in growth medium were seeded in a density of 1 cell per well into the wells of 60-well Nunc® MicroWell® MiniTrays (Sigma, Cat# M0815). After 7 days, the number of formed neurospheres was determined under a brightfield microscope.
To measure bulk proliferation, NSPCs were grown as neurospheres and dissociated with Accutase into single cells. 100,000 cells in growth medium were seeded into culture flasks and treated as indicated. After 7 days formed neurospheres were harvested with 500 rpm, dissociated into single cells with Accutase and total number of cells determined.
Differentiation analysis
NSPCs were grown as neurospheres, dissociated with Accutase (Millipore, Cat# SCR005) into single cells and seeded in a density of 100,000 cells per well on PDL/Laminin coated glass cover slips into 24-well-plates (Greiner Bio-one, Cat# 662160). After 24 h growth medium was replaced by differentiation medium (growth medium without EGF and FGF) and cells differentiated for 4, 6, or 8 days. After fixation with 4% PFA for 10 min at room temperature, cells were washed with PBS and stored at 4°C until further use. For western blot analysis, NSPCs were grown as neurospheres, dissociated with Accutase into single cells and 5 million cells in 10 ml growth medium were seeded in PDL/Laminin coated 10 cm plates (Thermo Scientific, Cat# 150350). After 24 h growth medium was replaced by differentiation medium (growth medium without EGF and FGF), treated as indicated and cells differentiated for 6 days.
Immunocytochemistry
PFA fixed cells were washed with PBS and incubated with primary antibody in PBS with 3% donkey serum and 0.25% Triton-X at 4°C over night. After washing with PBS cells were incubated with secondary antibodies in PBS with 3% donkey serum and 0.25% Triton-X at room temperature for 2 h, incubated with Dapi for 10 min, washed twice with PBS and mounted with Aqua-Poly/Mount. Primary antibodies were visualized with Alexa-conjugated secondary antibodies.
Corrected total cell fluorescence
For in vitro analysis of the expression of the autophagic markers LC3 and p62 the corrected total cell fluorescence was calculated. To this end, the level of fluorescence within the area of one cell was determined via ImageJ as previously described (Burgess et al., 2010).
Line Intensity Plots
The Plot Profile function of ImageJ was used to create line intensity plots of a single plane of confocal microscopy z-stack (Schindelin et al., 2012). Line intensity plots were used to depict the immunofluorescence intensity of the mCherry signal and the GFP signal of the mCherry/GFP/LC3 construct in vitro illustrating autophagosomes with co-localization of mCherry and GFP signal and functional autophagolysosomes with mCherry signal only.
BafilomycinA1, Rapamycin and Trehalose treatment
NSPCs were treated 12 h prior harvest/fixation with 20 nM BafilomycinA1 (AppliChem, Cat# A7823,0001). Treatment with 20 nM Rapamycin (LC Laboratories, Cat# R-5000) or 25 mM Trehalose (Sigma, Cat# T9531) was administered to the cells as indicated in Supplemental Figure S4I.
SDS-PAGE and western blotting
For SDS-PAGE and western blot analysis, proliferating or differentiated NSPCs were collected by centrifugation at 300×g for 5min at room temperature and washed once with PBS. Cells were lysed in RIPA buffer (1% Nonidet P40, 0.1% SDS, 0.5% sodium deoxycholate, 50mM Tris, 150mM NaCl, 1 mM EDTA, complemented with protease and phosphatase inhibitors) and total protein was determined using Pierce BCA protein assay (Thermo Scientific, Cat# 23225). 30 μg of total protein were separated on 4–12% Bis-Tris gels (Life Technologies, Cat# NP0322BOX), transferred to a PVDF membrane (Immobilon-P, Millipore, Cat# IPVH00010) and blocked for 1 h at room temperature in 1% BSA PBS-0.1% Tween 20 (PBS-T). Incubation with primary antibodies was performed overnight at 4°C. After washing with PBS-T incubation with fluorescent-labeled secondary antibodies was performed for 1 h at room temperature. Immunoblots were analyzed by fluorescence intensity with the FusionFX (Peqlab, Erlangen, Germany) and quantified using the Bio1D software (Vilber Lourmat, Eberhardzell, Germany). All protein amounts were normalized to β-actin prior to comparison between experimental conditions.
qRT-PCR and ChiP-Seq data
Quantitative Real-Time PCR was performed on a Roche Light Cycler (384-well format) using Power SYBR Green PCR Master Mix (ThermoFischer Scientific, Waltham, MA, USA) according to the manufacturer’s instructions. cDNA from at least three independent biological replicates was used for each experimental group. The ΔCt method was used to quantify changes in mRNA expression. Mean CT values of each target gene were normalized to mean CT values of the housekeeping gene (RPL27). Fold changes were calculated by normalizing each ΔΔCT value to the control ΔΔCT values. Oligonucleotide sequences of used qRT-PCR primers are listed in Table S1.
ChiP-Seq data was generated by re-analyzing published data from (Webb et al., 2013). MACS (Model-based Analysis of ChIP-Seq data) (Zhang et al., 2008) was used to generate ChiP enrichment scores.
Histology and counting procedures
Immunofluorescent staining of free-floating 50 μm and 120 μm sections was performed as followed: Sections were rinsed 3 times for 10 min with PBS, rinsed once in blocking solution (PBS with 3% donkey serum and 0.25% Triton-X) at room temperature for 1 h and incubated with primary antibodies in blocking solution for 72 h at 4 °C. After rinsing 3 times for 10 min in PBS, sections were rinsed 30 min in blocking solution and incubated with secondary antibodies in blocking solution at 4 °C over night. After rinsing for 10 min in 4′,6-Diamidin-2phenylindol (Dapi, Sigma, Cat# D9542), sections were washed 2 times with PBS for 10 min and mounted with Aqua-Poly/Mount (Polysciences, Cat# 18606). For 5-bromo-2’-deoxyuridine (BrdU) staining, sections were incubated in 2N HCl for 10 min at 37°C after the staining procedure of the other used antibodies was completed. After two rinses in 0.1 M borate buffer, sections were washed three times with PBS. Fluorescent staining for BrdU antibody was then performed as described above. For FoxO1, FoxO3 and FoxO4 staining, sections were incubated in sodium citrate buffer for 15 min at 99°C after the staining procedure of the other used antibodies was completed. After cooling down to RT, sections were washed three times with H2O and three times with PBS. Fluorescent staining for FoxO1, FoxO3 and FoxO4 was then performed as described above. Primary antibodies were visualized with Alexa-conjugated secondary antibodies (all 1:500; Invitrogen). Biotinylated secondary antibodies (1:500; Vector Laboratories) were used in combination with Alexa-conjugated to Streptavidin (Invitrogen) to enhance the signal of GFP if CAG-GFP-IRES-Cre retrovirus targeted cells were visualized.
Confocal single plane images and z-stacks were taken with a Leica SP5 (Leica Microsystems, Wetzlar, Germany) or a Zeiss LSM 780 (Carl Zeiss, Oberkochen, Germany) each equipped with four laser lines (405, 488, 559 and 633nm) and 63×, 40× and 20× objective lens.
Images were processed using using Fiji ImageJ. 3D reconstructions were obtained by using Imaris software (Bitplane AG, Zürich, Switzerland).
Tamoxifen administration
To induce recombination, 8 weeks-old animals were intraperitoneally (i.p.) injected with 1 mg Tamoxifen (Sigma, Cat# T5648) for 5 consecutive days twice per day (Mori et al., 2006).
BrdU administration
For proliferation analysis 8 weeks-old animals were intraperitoneally injected with a daily dose of Bromodeoxyuridine (BrdU, 50 mg/kg body weight, Sigma-Aldrich, Cat# B5002) for 3 consecutive days and sacrificed 3 h after the last BrdU injection. BrdU was dissolved in 0.9% NaCl and sterile filtered.
Rapamycin administration
To induce autophagy in an mTor-dependent manner, 8 weeks-old animals were intraperitoneally (i.p.) injected with Rapamycin (2 mg/kg bodyweight, LC Laboratories, Cat# R-5000) 3× per week for 3 or 6 weeks. Rapamycin was dissolved in a stock concentration of 25 mg/ml in DMSO, diluted further with 5% PEG400 / 5% Tween80 in PBS and sterile filtered.
Trehalose administration
To induce autophagy in an mTor-independent manner, 8 weeks-old animals were intraperitoneally (i.p.) injected with Trehalose (2 g/kg bodyweight, Sigma, Cat# T9531) 3× per week for 3 or 6 weeks. Trehalose was dissolved in PBS and sterile filtered. In addition, animals received 3 % w/v Trehalose in the drinking water.
Retrovirus preparation and stereotactic injections
The CAG-GFP-IRES-Cre, CAG-IRES mito-dsRed and the CAG-RFP retroviral plasmids have been previously described (Steib et al., 2014; Tashiro et al., 2006a). For generation of the CAG-mCherry/GFP/LC3 and of the CAG-mCherry/GFP/LC3-IRES-Cre the GFP coding sequence of the CAG-GFP (Tashiro et al., 2006b) and of the CAG-GFP-IRES-Cre retroviral plasmids were replaced with the mCherry/GFP/LC3 reporter sequence (N’Diaye et al., 2009). For generation of the CAG-RhebD60I and of the CAG-RhebD60I-IRES-RFP the GFP coding sequence of the CAG-GFP and of the CAG-IRES-RFP retroviral plasmids were replaced with the RhebD60I sequence (Tabancay et al., 2003). MML-retroviruses were generated as previously described (Tashiro et al., 2006b). Viral titers were approximately 2×10⁸ colony-forming units (cfu) ml-1.
For stereotactic injections, 8-weeks old mice were deeply anesthetized by injecting Fentanyl (0.05 mg/kg; Janssen-Cilag AG, New Brunswick, USA), Midazolam (5 mg/kg; Dormicum, Hoffmann-La Roche, Basel, Switzerland) and Medetomidine (0.5 mg/kg; Domitor, Pfizer Inc., New York, USA) dissolved in 0.9% NaCl. Mice were stereotactically injected with 0.9 μl of the retroviruses with a titer of 1×10⁸ cfu × ml−1 into the left and right dentate gyrus (coordinates from bregma were −1.9 anterior/posterior, ±1.6 medial/lateral, −1.9 dorsal/ventral from dura). Anesthesia was antagonized by injecting Buprenorphine (0.1 mg/kg, Temgesic, Essex Pharma GmbH, Munich, Germany), Atipamezol (2.5 mg/kg, Antisedan, Pfizer Inc., New York, USA) and Flumazenil (0.5 mg/kg; Anexate, Hexal AG, Holzkirchen, Germany) dissolved in 0.9% NaCl.
QUANTIFICATION AND STATISTICAL ANALYSIS
Expression analysis of stage-specific markers
Expression of stage-specific markers (Nestin, Mcm2, DCX, Prox1, Calbindin; n>50 cells/per animal and marker) was analyzed by confocal microscopy in at least 3 sections containing the dentate gyrus from at least 3 different animals. The exact value of n is described in the figure legends.
Dendritic and spine morphology analyses
To analyze dendritic and spine morphology, confocal images of transduced cells expressing GFP were taken with a 63× glycerol objective using a Leica TCS Sp5 confocal microscope (step size 0.3 μm, resolution 1024×1024). The sections for the dendritic morphology were 120 μm thick and the sections for the spine morphology 50 μm thick. In addition, a 3× zoom was used for the spine analysis. At least 10 cells per group from at least 3 different animals were analyzed. The exact value of n is described in the figure legends. 3D reconstructions were obtained using the Filament Tracer tool and the Surface Tracer tool in Imaris, and values for total dendritic length, length of the apical dendrite, number of Sholl intersections, number of branch points and number of dendrite termini were determined. The numbers of overall spines, filopodia spines (spine head diameter <0.25 μm), thin spines (spine head diameter >0.25 μm and <0.45 μm) and mushroom spines (spine head diameter >0.45 μm) were investigated with Fiji (Schindelin et al., 2012; Sultan et al., 2013).
Fluorescent reporter-based autophagic flux analysis
Autophagic flux was analyzed using the mCherry/GFP/LC3 fusion protein reporter (N’Diaye et al., 2009). This reporter labels autophagosomes with red and green fluorescence, while the GFP is quenched in functional autophagolysosomes due to the acidic pH. The ratio of red only functional autophagolysosomes over red and green autophagosomes was used as read-out for the autophagic flux. Confocal images of transduced cells expressing mCherry/GFP/LC3 were taken with a 63× glycerol objective using a Zeiss LSM 780 confocal microscope with a 5× zoom and a step size of 0.3 μm (resolution 1024×1024). Cells from at least 3 different animals were analyzed. The exact value of n is described in the figure legends.
Statistical analysis
Significance levels were assessed using unpaired Student’s t-test with unequal variances; for quantification of Sholl-analysis we applied Two-Way ANOVA with replications to determine significance. Differences were considered statistically significant at *p<0.05, **p<0.01 and ***p<0.001. All data are presented as mean ± SEM (standard error of the mean).
Supplementary Material
Highlights:
FoxOs control morphology and spine density of adult-born hippocampal neurons
Autophagic flux is severely impaired in FoxO-deficient adult-born neurons
Induction of autophagy rescues dendrite and spine deficits of FoxO-ablated neurons
Acknowledgments
We thank M. Götz (LMU Munich) for providing the GLAST::CreERT2 mice. We thank S. Jessberger for helpful discussions and comments on the manuscript. This work was supported by grants from the German Research Foundation (LI 858/6–3 and 9–1 to D.C.L, INST 410/45–1 FUGG; BE 5136/1–2 and 2–1 to R.B.; KL 1395/8–1 to J.K.; WU 164/5–1 and CRC870 to W.W.), the Bavarian Research Network “ForIPS” to D.C.L., J.K., B.W. and W.W., the University Hospital Erlangen (IZKF grants E12, E16, to D.C.L., E21 to D.C.L. and J.K.; E25 to B.W.), the German Federal Ministry of Education and Research (BMBF: 01GQ113, 01GM1520A, 01EK1609B to B.W., Integrament 01ZX1314H to W.W.), and the National Institutes of Health (AG048284 to J. P.; AG053268 to A.E.W.). R.B. is an associated fellow of the research training group 2162 “Neurodevelopment and Vulnerability of the Central Nervous System” of the Deutsche Forschungsgemeinschaft (DFG GRK2162/1).
Footnotes
DATA AND SOFTWARE AVAILABLILTY
Not applicable.
ADDITIONAL RESOURCES
Not applicable.
Declaration of interests
The authors declare no competing interests.
Publisher's Disclaimer: This is a PDF file of an unedited manuscript that has been accepted for publication. As a service to our customers we are providing this early version of the manuscript. The manuscript will undergo copyediting, typesetting, and review of the resulting proof before it is published in its final citable form. Please note that during the production process errors may be discovered which could affect the content, and all legal disclaimers that apply to the journal pertain.
References
- Abrous DN, and Wojtowicz JM (2015). Interaction between Neurogenesis and Hippocampal Memory System: New Vistas. Cold Spring Harbor perspectives in biology 7. [DOI] [PMC free article] [PubMed] [Google Scholar]
- Bai L, Mei X, Shen Z, Bi Y, Yuan Y, Guo Z, Wang H, Zhao H, Zhou Z, Wang C, et al. (2017). Netrin-1 Improves Functional Recovery through Autophagy Regulation by Activating the AMPK/mTOR Signaling Pathway in Rats with Spinal Cord Injury. Scientific reports 7, 42288. [DOI] [PMC free article] [PubMed] [Google Scholar]
- Beckervordersandforth R, Ebert B, Schaffner I, Moss J, Fiebig C, Shin J, Moore DL, Ghosh L, Trinchero MF, Stockburger C, et al. (2017). Role of Mitochondrial Metabolism in the Control of Early Lineage Progression and Aging Phenotypes in Adult Hippocampal Neurogenesis. Neuron 93, 560–573 e566. [DOI] [PMC free article] [PubMed] [Google Scholar]
- Beckervordersandforth R, Zhang CL, and Lie DC (2015). Transcription-Factor-Dependent Control of Adult Hippocampal Neurogenesis. Cold Spring Harbor perspectives in biology 7, a018879. [DOI] [PMC free article] [PubMed] [Google Scholar]
- Boland B, Kumar A, Lee S, Platt FM, Wegiel J, Yu WH, and Nixon RA (2008). Autophagy induction and autophagosome clearance in neurons: relationship to autophagic pathology in Alzheimer’s disease. J Neurosci 28, 6926–6937. [DOI] [PMC free article] [PubMed] [Google Scholar]
- Burgess A, Vigneron S, Brioudes E, Labbe JC, Lorca T, and Castro A (2010). Loss of human Greatwall results in G2 arrest and multiple mitotic defects due to deregulation of the cyclin B-Cdc2/PP2A balance. Proc Natl Acad Sci U S A 107, 12564–12569. [DOI] [PMC free article] [PubMed] [Google Scholar]
- de la Torre-Ubieta L, Gaudilliere B, Yang Y, Ikeuchi Y, Yamada T, DiBacco S, Stegmuller J, Schuller U, Salih DA, Rowitch D, et al. (2010). A FOXO-Pak1 transcriptional pathway controls neuronal polarity. Genes Dev 24, 799–813. [DOI] [PMC free article] [PubMed] [Google Scholar]
- DeBosch BJ, Heitmeier MR, Mayer AL, Higgins CB, Crowley JR, Kraft TE, Chi M, Newberry EP, Chen Z, Finck BN, et al. (2016). Trehalose inhibits solute carrier 2A (SLC2A) proteins to induce autophagy and prevent hepatic steatosis. Science signaling 9, ra21. [DOI] [PMC free article] [PubMed] [Google Scholar]
- Eijkelenboom A, and Burgering BM (2013). FOXOs: signalling integrators for homeostasis maintenance. Nature reviews Molecular cell biology 14, 83–97. [DOI] [PubMed] [Google Scholar]
- Eskelinen EL, and Saftig P (2009). Autophagy: a lysosomal degradation pathway with a central role in health and disease. Biochimica et biophysica acta 1793, 664–673. [DOI] [PubMed] [Google Scholar]
- Feliciano DM, Lin TV, Hartman NW, Bartley CM, Kubera C, Hsieh L, Lafourcade C, O’Keefe RA, and Bordey A (2013). A circuitry and biochemical basis for tuberous sclerosis symptoms: from epilepsy to neurocognitive deficits. International journal of developmental neuroscience : the official journal of the International Society for Developmental Neuroscience 31, 667–678. [DOI] [PMC free article] [PubMed] [Google Scholar]
- Fletcher L, Evans TM, Watts LT, Jimenez DF, and Digicaylioglu M (2013). Rapamycin treatment improves neuron viability in an in vitro model of stroke. PLoS One 8, e68281. [DOI] [PMC free article] [PubMed] [Google Scholar]
- Goncalves JT, Schafer ST, and Gage FH (2016a). Adult Neurogenesis in the Hippocampus: From Stem Cells to Behavior. Cell 167, 897–914. [DOI] [PubMed] [Google Scholar]
- Goncalves JT, Bloyd CW, Shtrahman M, Johnston ST, Schafer ST, Parylak SL, Tran T, Chang T, and Gage FH (2016b). In vivo imaging of dendritic pruning in dentate granule cells. Nature neuroscience 19, 788–791. [DOI] [PMC free article] [PubMed] [Google Scholar]
- Hay N (2011). Interplay between FOXO, TOR, and Akt. Biochimica et biophysica acta 1813, 1965–1970. [DOI] [PMC free article] [PubMed] [Google Scholar]
- Hong S, Dissing-Olesen L, and Stevens B (2016). New insights on the role of microglia in synaptic pruning in health and disease. Current opinion in neurobiology 36, 128–134. [DOI] [PMC free article] [PubMed] [Google Scholar]
- Hwang I, Oh H, Santo E, Kim DY, Chen JW, Bronson RT, Locasale JW, Na Y, Lee J, Reed S, et al. (2018). FOXO protects against age-progressive axonal degeneration. Aging cell 17. [DOI] [PMC free article] [PubMed] [Google Scholar]
- Jungenitz T, Radic T, Jedlicka P, and Schwarzacher SW (2014). High-frequency stimulation induces gradual immediate early gene expression in maturing adult-generated hippocampal granule cells. Cereb Cortex 24, 1845–1857. [DOI] [PubMed] [Google Scholar]
- Kee N, Teixeira CM, Wang AH, and Frankland PW (2007). Preferential incorporation of adult-generated granule cells into spatial memory networks in the dentate gyrus. Nature neuroscience 10, 355–362. [DOI] [PubMed] [Google Scholar]
- Khundrakpam BS, Lewis JD, Kostopoulos P, Carbonell F, and Evans AC (2017). Cortical Thickness Abnormalities in Autism Spectrum Disorders Through Late Childhood, Adolescence, and Adulthood: A Large-Scale MRI Study. Cereb Cortex 27, 1721–1731. [DOI] [PubMed] [Google Scholar]
- Klionsky DJ, Abdelmohsen K, Abe A, Abedin MJ, Abeliovich H, Acevedo Arozena A, Adachi H, Adams CM, Adams PD, Adeli K, et al. (2016). Guidelines for the use and interpretation of assays for monitoring autophagy (3rd edition). Autophagy 12, 1–222. [DOI] [PMC free article] [PubMed] [Google Scholar]
- Li M, Lu G, Hu J, Shen X, Ju J, Gao Y, Qu L, Xia Y, Chen Y, and Bai Y (2016). EVA1A/TMEM166 Regulates Embryonic Neurogenesis by Autophagy. Stem cell reports 6, 396–410. [DOI] [PMC free article] [PubMed] [Google Scholar]
- Li Z, Okamoto K, Hayashi Y, and Sheng M (2004). The importance of dendritic mitochondria in the morphogenesis and plasticity of spines and synapses. Cell 119, 873–887. [DOI] [PubMed] [Google Scholar]
- Lippai M, and Low P (2014). The role of the selective adaptor p62 and ubiquitin-like proteins in autophagy. Biomed Res Int 2014, 832704. [DOI] [PMC free article] [PubMed] [Google Scholar]
- Llorens-Martin M, Rabano A, and Avila J (2015). The Ever-Changing Morphology of Hippocampal Granule Neurons in Physiology and Pathology. Frontiers in neuroscience 9, 526. [DOI] [PMC free article] [PubMed] [Google Scholar]
- Luikart BW, Schnell E, Washburn EK, Bensen AL, Tovar KR, and Westbrook GL (2011). Pten knockdown in vivo increases excitatory drive onto dentate granule cells. J Neurosci 31, 4345–4354. [DOI] [PMC free article] [PubMed] [Google Scholar]
- Lv X, Jiang H, Li B, Liang Q, Wang S, Zhao Q, and Jiao J (2014). The crucial role of Atg5 in cortical neurogenesis during early brain development. Scientific reports 4, 6010. [DOI] [PMC free article] [PubMed] [Google Scholar]
- Marino G, Madeo F, and Kroemer G (2011). Autophagy for tissue homeostasis and neuroprotection. Current opinion in cell biology 23, 198–206. [DOI] [PubMed] [Google Scholar]
- Mauvezin C, and Neufeld TP (2015). Bafilomycin A1 disrupts autophagic flux by inhibiting both V-ATPase-dependent acidification and Ca-P60A/SERCA-dependent autophagosome-lysosome fusion. Autophagy 11, 1437–1438. [DOI] [PMC free article] [PubMed] [Google Scholar]
- Mayer AL, Higgins CB, Heitmeier MR, Kraft TE, Qian X, Crowley JR, Hyrc KL, Beatty WL, Yarasheski KE, Hruz PW, et al. (2016). SLC2A8 (GLUT8) is a mammalian trehalose transporter required for trehalose-induced autophagy. Scientific reports 6, 38586. [DOI] [PMC free article] [PubMed] [Google Scholar]
- McAvoy KM, Scobie KN, Berger S, Russo C, Guo N, Decharatanachart P, Vega-Ramirez H, Miake-Lye S, Whalen M, Nelson M, et al. (2016). Modulating Neuronal Competition Dynamics in the Dentate Gyrus to Rejuvenate Aging Memory Circuits. Neuron 91, 1356–1373. [DOI] [PMC free article] [PubMed] [Google Scholar]
- Mizushima N, Yoshimori T, and Levine B (2010). Methods in mammalian autophagy research. Cell 140, 313–326. [DOI] [PMC free article] [PubMed] [Google Scholar]
- Mori T, Tanaka K, Buffo A, Wurst W, Kuhn R, and Gotz M (2006). Inducible gene deletion in astroglia and radial glia--a valuable tool for functional and lineage analysis. Glia 54, 21–34. [DOI] [PubMed] [Google Scholar]
- N’Diaye EN, Kajihara KK, Hsieh I, Morisaki H, Debnath J, and Brown EJ (2009). PLIC proteins or ubiquilins regulate autophagy-dependent cell survival during nutrient starvation. EMBO reports 10, 173–179. [DOI] [PMC free article] [PubMed] [Google Scholar]
- Nelson SB, and Valakh V (2015). Excitatory/Inhibitory Balance and Circuit Homeostasis in Autism Spectrum Disorders. Neuron 87, 684–698. [DOI] [PMC free article] [PubMed] [Google Scholar]
- Nikoletopoulou V, Sidiropoulou K, Kallergi E, Dalezios Y, and Tavernarakis N (2017). Modulation of Autophagy by BDNF Underlies Synaptic Plasticity. Cell Metab 26, 230–242 e235. [DOI] [PubMed] [Google Scholar]
- Nishida Y, Arakawa S, Fujitani K, Yamaguchi H, Mizuta T, Kanaseki T, Komatsu M, Otsu K, Tsujimoto Y, and Shimizu S (2009). Discovery of Atg5/Atg7-independent alternative macroautophagy. Nature 461, 654–658. [DOI] [PubMed] [Google Scholar]
- Nott A, Cheng J, Gao F, Lin YT, Gjoneska E, Ko T, Minhas P, Zamudio AV, Meng J, Zhang F, et al. (2016). Histone deacetylase 3 associates with MeCP2 to regulate FOXO and social behavior. Nature neuroscience 19, 1497–1505. [DOI] [PMC free article] [PubMed] [Google Scholar]
- Paik JH, Ding Z, Narurkar R, Ramkissoon S, Muller F, Kamoun WS, Chae SS, Zheng H, Ying H, Mahoney J, et al. (2009). FoxOs cooperatively regulate diverse pathways governing neural stem cell homeostasis. Cell Stem Cell 5, 540–553. [DOI] [PMC free article] [PubMed] [Google Scholar]
- Paik JH, Kollipara R, Chu G, Ji H, Xiao Y, Ding Z, Miao L, Tothova Z, Horner JW, Carrasco DR, et al. (2007). FoxOs are lineage-restricted redundant tumor suppressors and regulate endothelial cell homeostasis. Cell 128, 309–323. [DOI] [PMC free article] [PubMed] [Google Scholar]
- Pankiv S, Clausen TH, Lamark T, Brech A, Bruun JA, Outzen H, Overvatn A, Bjorkoy G, and Johansen T (2007). p62/SQSTM1 binds directly to Atg8/LC3 to facilitate degradation of ubiquitinated protein aggregates by autophagy. J Biol Chem 282, 24131–24145. [DOI] [PubMed] [Google Scholar]
- Park JM, Tougeron D, Huang S, Okamoto K, and Sinicrope FA (2014). Beclin 1 and UVRAG confer protection from radiation-induced DNA damage and maintain centrosome stability in colorectal cancer cells. PLoS One 9, e100819. [DOI] [PMC free article] [PubMed] [Google Scholar]
- Ploumi C, Daskalaki I, and Tavernarakis N (2017). Mitochondrial biogenesis and clearance: a balancing act. The FEBS journal 284, 183–195. [DOI] [PubMed] [Google Scholar]
- Renault VM, Rafalski VA, Morgan AA, Salih DA, Brett JO, Webb AE, Villeda SA, Thekkat PU, Guillerey C, Denko NC, et al. (2009). FoxO3 regulates neural stem cell homeostasis. Cell Stem Cell 5, 527–539. [DOI] [PMC free article] [PubMed] [Google Scholar]
- Rolando C, and Taylor V (2014). Neural stem cell of the hippocampus: development, physiology regulation, and dysfunction in disease. Current topics in developmental biology 107, 183–206. [DOI] [PubMed] [Google Scholar]
- Salih DA, Rashid AJ, Colas D, de la Torre-Ubieta L, Zhu RP, Morgan AA, Santo EE, Ucar D, Devarajan K, Cole CJ, et al. (2012). FoxO6 regulates memory consolidation and synaptic function. Genes Dev 26, 2780–2801. [DOI] [PMC free article] [PubMed] [Google Scholar]
- Sarkar S, Davies JE, Huang Z, Tunnacliffe A, and Rubinsztein DC (2007). Trehalose, a novel mTOR-independent autophagy enhancer, accelerates the clearance of mutant huntingtin and alpha-synuclein. J Biol Chem 282, 5641–5652. [DOI] [PubMed] [Google Scholar]
- Schindelin J, Arganda-Carreras I, Frise E, Kaynig V, Longair M, Pietzsch T, Preibisch S, Rueden C, Saalfeld S, Schmid B, et al. (2012). Fiji: an open-source platform for biological-image analysis. Nature methods 9, 676–682. [DOI] [PMC free article] [PubMed] [Google Scholar]
- Soriano P (1999). Generalized lacZ expression with the ROSA26 Cre reporter strain. Nat Genet 21, 70–71. [DOI] [PubMed] [Google Scholar]
- Steib K, Schaffner I, Jagasia R, Ebert B, and Lie DC (2014). Mitochondria modify exercise-induced development of stem cell-derived neurons in the adult brain. J Neurosci 34, 6624–6633. [DOI] [PMC free article] [PubMed] [Google Scholar]
- Sultan S, Gebara E, and Toni N (2013). Doxycycline increases neurogenesis and reduces microglia in the adult hippocampus. Frontiers in neuroscience 7, 131. [DOI] [PMC free article] [PubMed] [Google Scholar]
- Switon K, Kotulska K, Janusz-Kaminska A, Zmorzynska J, and Jaworski J (2017). Molecular neurobiology of mTOR. Neuroscience 341, 112–153. [DOI] [PubMed] [Google Scholar]
- Tabancay AP Jr., Gau CL, Machado IM, Uhlmann EJ, Gutmann DH, Guo L, and Tamanoi F (2003). Identification of dominant negative mutants of Rheb GTPase and their use to implicate the involvement of human Rheb in the activation of p70S6K. J Biol Chem 278, 39921–39930. [DOI] [PubMed] [Google Scholar]
- Tang G, Gudsnuk K, Kuo SH, Cotrina ML, Rosoklija G, Sosunov A, Sonders MS, Kanter E, Castagna C, Yamamoto A, et al. (2014). Loss of mTOR-dependent macroautophagy causes autistic-like synaptic pruning deficits. Neuron 83, 1131–1143. [DOI] [PMC free article] [PubMed] [Google Scholar]
- Tanida I, Ueno T, and Kominami E (2004). LC3 conjugation system in mammalian autophagy. Int J Biochem Cell Biol 36, 2503–2518. [DOI] [PMC free article] [PubMed] [Google Scholar]
- Tashiro A, Sandler VM, Toni N, Zhao C, and Gage FH (2006a). NMDA-receptor-mediated, cell-specific integration of new neurons in adult dentate gyrus. Nature 442, 929933. [DOI] [PubMed] [Google Scholar]
- Tashiro A, Zhao C, and Gage FH (2006b). Retrovirus-mediated single-cell gene knockout technique in adult newborn neurons in vivo. Nat Protoc 1, 3049–3055. [DOI] [PubMed] [Google Scholar]
- Tian Y, Voineagu I, Pasca SP, Won H, Chandran V, Horvath S, Dolmetsch RE, and Geschwind DH (2014). Alteration in basal and depolarization induced transcriptional network in iPSC derived neurons from Timothy syndrome. Genome Med 6, 75. [DOI] [PMC free article] [PubMed] [Google Scholar]
- Urbanska M, Gozdz A, Macias M, Cymerman IA, Liszewska E, Kondratiuk I, Devijver H, Lechat B, Van Leuven F, and Jaworski J (2018). GSK3beta Controls mTOR and Prosurvival Signaling in Neurons. Molecular neurobiology 55, 6050–6062. [DOI] [PMC free article] [PubMed] [Google Scholar]
- Vazquez P, Arroba AI, Cecconi F, de la Rosa EJ, Boya P, and de Pablo F (2012). Atg5 and Ambra1 differentially modulate neurogenesis in neural stem cells. Autophagy 8, 187–199. [DOI] [PubMed] [Google Scholar]
- Wang C, Chen S, Yeo S, Karsli-Uzunbas G, White E, Mizushima N, Virgin HW, and Guan JL (2016). Elevated p62/SQSTM1 determines the fate of autophagy-deficient neural stem cells by increasing superoxide. The Journal of cell biology 212, 545–560. [DOI] [PMC free article] [PubMed] [Google Scholar]
- Wang C, Yeo S, Haas MA, and Guan JL (2017). Autophagy gene FIP200 in neural progenitors non-cell autonomously controls differentiation by regulating microglia. The Journal of cell biology 216, 2581–2596. [DOI] [PMC free article] [PubMed] [Google Scholar]
- Watanabe Y, Honda S, Konishi A, Arakawa S, Murohashi M, Yamaguchi H, Torii S, Tanabe M, Tanaka S, Warabi E, et al. (2016). Autophagy controls centrosome number by degrading Cep63. Nature communications 7, 13508. [DOI] [PMC free article] [PubMed] [Google Scholar]
- Webb AE, and Brunet A (2014). FOXO transcription factors: key regulators of cellular quality control. Trends Biochem Sci 39, 159–169. [DOI] [PMC free article] [PubMed] [Google Scholar]
- Webb AE, Kundaje A, and Brunet A (2016). Characterization of the direct targets of FOXO transcription factors throughout evolution. Aging cell 15, 673–685. [DOI] [PMC free article] [PubMed] [Google Scholar]
- Webb AE, Pollina EA, Vierbuchen T, Urban N, Ucar D, Leeman DS, Martynoga B, Sewak M, Rando TA, Guillemot F, et al. (2013). FOXO3 shares common targets with ASCL1 genome-wide and inhibits ASCL1-dependent neurogenesis. Cell reports 4, 477–491. [DOI] [PMC free article] [PubMed] [Google Scholar]
- Wu X, Fleming A, Ricketts T, Pavel M, Virgin H, Menzies FM, and Rubinsztein DC (2016). Autophagy regulates Notch degradation and modulates stem cell development and neurogenesis. Nature communications 7, 10533. [DOI] [PMC free article] [PubMed] [Google Scholar]
- Xi Y, Dhaliwal JS, Ceizar M, Vaculik M, Kumar KL, and Lagace DC (2016). Knockout of Atg5 delays the maturation and reduces the survival of adult-generated neurons in the hippocampus. Cell death & disease 7, e2127. [DOI] [PMC free article] [PubMed] [Google Scholar]
- Yazdankhah M, Farioli-Vecchioli S, Tonchev AB, Stoykova A, and Cecconi F (2014). The autophagy regulators Ambra1 and Beclin 1 are required for adult neurogenesis in the brain subventricular zone. Cell death & disease 5, e1403. [DOI] [PMC free article] [PubMed] [Google Scholar]
- Yeo H, Lyssiotis CA, Zhang Y, Ying H, Asara JM, Cantley LC, and Paik JH (2013). FoxO3 coordinates metabolic pathways to maintain redox balance in neural stem cells. The EMBO journal 32, 2589–2602. [DOI] [PMC free article] [PubMed] [Google Scholar]
- Zhang Y, Liu T, Meyer CA, Eeckhoute J, Johnson DS, Bernstein BE, Nusbaum C, Myers RM, Brown M, Li W, et al. (2008). Model-based analysis of ChIP-Seq (MACS). Genome biology 9, R137. [DOI] [PMC free article] [PubMed] [Google Scholar]
- Zhang ZH, Wu QY, Zheng R, Chen C, Chen Y, Liu Q, Hoffmann PR, Ni JZ, and Song GL (2017). Selenomethionine Mitigates Cognitive Decline by Targeting Both Tau Hyperphosphorylation and Autophagic Clearance in an Alzheimer’s Disease Mouse Model. J Neurosci 37, 2449–2462. [DOI] [PMC free article] [PubMed] [Google Scholar]
- Zhao C, Teng EM, Summers RG Jr., Ming GL, and Gage FH (2006). Distinct morphological stages of dentate granule neuron maturation in the adult mouse hippocampus. J Neurosci 26, 3–11. [DOI] [PMC free article] [PubMed] [Google Scholar]
- Zhao YG, and Zhang H (2018). Formation and maturation of autophagosomes in higher eukaryotes: a social network. Current opinion in cell biology 53, 29–36. [DOI] [PubMed] [Google Scholar]
Associated Data
This section collects any data citations, data availability statements, or supplementary materials included in this article.