Abstract
The small, secreted peptide, insulin-like growth factor 2 (IGF2), is essential for fetal and prenatal growth in humans and other mammals. Human IGF2 and mouse Igf2 genes are located within a conserved linkage group and are regulated by parental imprinting, with IGF2/Igf2 being expressed from the paternally derived chromosome, and H19 from the maternal chromosome. Here, data retrieved from genomic and gene expression repositories were used to examine the Igf2 gene and locus in 8 terrestrial vertebrates, 11 ray-finned fish, and 1 lobe-finned fish representing >500 million years of evolutionary diversification. The analysis revealed that vertebrate Igf2 genes are simpler than their mammalian counterparts, having fewer exons and lacking multiple gene promoters. Igf2 genes are conserved among these species, especially in protein-coding regions, and IGF2 proteins also are conserved, although less so in fish than in terrestrial vertebrates. The Igf2 locus in terrestrial vertebrates shares additional genes with its mammalian counterparts, including tyrosine hydroxylase (Th), insulin (Ins), mitochondrial ribosomal protein L23 (Mrpl23), and troponin T3, fast skeletal type (Tnnt3), and both Th and Mrpl23 are present in the Igf2 locus in fish. Taken together, these observations support the idea that a recognizable Igf2 was present in the earliest vertebrate ancestors, but that other features developed and diversified in the gene and locus with speciation, especially in mammals. This study also highlights the need for correcting inaccuracies in genome databases to maximize our ability to accurately assess contributions of individual genes and multigene families toward evolution, physiology, and disease.
Keywords: insulin-like growth factor (IGF), genomics, gene structure, gene expression, genetics, phylogenetics, gene annotation, gene evolution, gene phylogeny, genetic database, vertebrate speciation
Introduction
The secreted peptide, insulin-like growth factor 2 (IGF2), is produced in many different mammals and nonmammalian vertebrates (1–6) and is part of a small protein family with IGF1 and insulin (5, 7). In mammals, IGF2 plays a central role in fetal development and growth (8) and is involved in a number of other physiological and pathological processes throughout life (9–16). The single-copy gene encoding mammalian IGF2/Igf2 is embedded within a linkage group that includes tyrosine hydroxylase (TH/Th), INS (Ins2 in mice), H19, mitochondrial ribosomal protein L23 (MRPL23/Mrpl23), and troponin T3, fast skeletal type (TNNT3/Tnnt3) (17, 18). IGF2/Igf2 and H19 gene expression patterns in humans, mice, and likely in other mammals are regulated by parental imprinting, in which IGF2/Igf2 is selectively active on the paternally derived chromosome and H19 on the maternal chromosome (19–22). Expression of IGF2/Igf2 and H19 on different allelic chromosomes is controlled by DNA sequences within an imprinting control region (ICR). The ICR resides physically between H19 and IGF2/Igf2 genes, 5′ to H19 (23). The regulatory protein, CCTC-binding factor (CTCF) 2 (23–26), can bind to its recognition sequences in DNA within the ICR in maternal chromatin, where the DNA is unmethylated on cytosine residues in CpG dinucleotides (24–26). Under these conditions, DNA-bound CTCF is able to direct distal enhancers to activate the H19 promoter while simultaneously blocking their access to IGF2/Igf2 promoters (25–27). In contrast, in paternal chromatin, where ICR DNA is methylated, CTCF binding is blocked, and the enhancers are able to interact selectively with IGF2/Igf2 promoters (25–27).
Recent advances in genomics and genetics in multiple species now provide unprecedented opportunities for gaining novel insights into comparative physiology, evolution, and even disease predisposition (28–30) through evaluation of information found in public genomic and gene expression databases (31). As an example, examination of the IGF2/Igf2-H19 locus in different mammals has revealed extensive complexity yet remarkable similarity in individual gene structures, in locus organization, and in gene regulation patterns. Human IGF2 consists of 10 exons and 5 promoters, as do several other primate IGF2 genes (3, 18, 21, 22, 32), whereas in the mouse the Igf2 gene encodes 8 exons and 4 promoters (33–35). H19 also varies among mammals. Human H19 has 6 exons and 2 promoters and uses alternative transcription start sites, exon skipping, and differential RNA splicing within exons to generate multiple transcripts (18). Several other primates also have similar regulatory mechanisms for H19 (18), but these same processes are not present in other mammalian species, in which just a single promoter has been identified (20, 36). Collectively, these results demonstrate that some common components responsible for controlling IGF2/Igf2 gene expression and IGF2 function appear to have been present in the earliest ancestors of extant mammals, but because there is significant variability in H19 gene structure, in the ICR, and in transcriptional enhancers, other regulatory elements appear to have developed during species diversification.
The focus of this study is on the Igf2 gene and locus in nonmammalian vertebrates, where available information is far less extensive than in mammals (37–40). Results based on the combinatorial analysis of public genomic and gene expression databases reveal remarkable conservation of overall locus organization and similarity of Igf2 exons and IGF2 proteins in >500 Myr of evolutionary diversification, and they support the idea that the Igf2 gene and its locus are phylogenetically ancient in vertebrates.
Results
Characterizing the chicken Igf2 gene
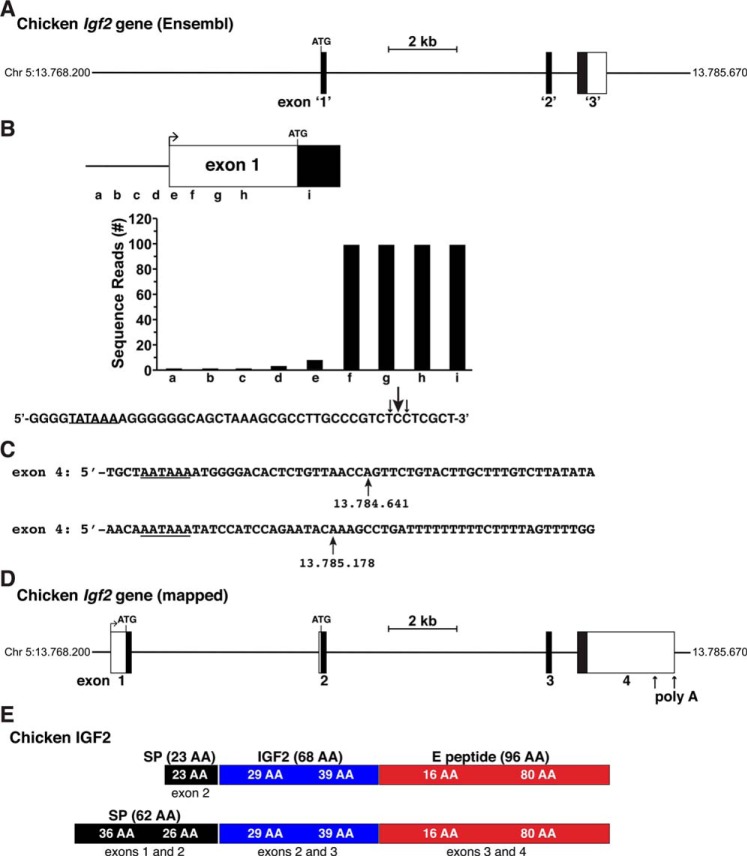
For this analysis, chicken Igf2 was selected as the reference gene for terrestrial vertebrates, primarily because it has been more highly studied than any of the other species found in the Ensembl and UCSC Genome browsers. According to a single peer-reviewed publication (37) and information found in both genome databases as of August 2018, the single-copy chicken Igf2 gene consists of 3 exons and spans 8343 bp of genomic DNA on chromosome 5 (Fig. 1A). The 5′ and 3′ ends of the gene were not defined in any of these resources, and no promoter was characterized. In fact, in contrast to what is normal eukaryotic gene structure (41, 42), presumptive exon 1 (exon 1′ in Fig. 1A) began with the ATG codon of the IGF2 protein precursor and thus lacked an identified 5′ UTR (Fig. 1A). Based on these results, it was clear that the chicken Igf2 gene was incomplete.
Figure 1.
Organization of the chicken Igf2 gene. A, map of the chicken Igf2 gene as presented in the Ensembl genome database. Chromosomal coordinates are listed; exons appear as boxes and are numbered '1', '2', and '3', and introns and flanking DNA as horizontal lines. A scale bar is indicated. B, diagram of newly-characterized chicken Igf2 exon 1 and gene expression data from hepatic RNA-Seq libraries from the SRA NCBI, using 60-bp genomic segments a–i as probes. The DNA sequence below the graph depicts the putative 5′ end of exon 1, with locations of the 5′ ends of the longest RNA-seq clones indicated by arrows (the size is proportional to the number of clones identified). A possible TATA box is underlined. C, DNA sequence of the putative 3′ ends of Igf2 exon 4. Potential polyadenylation signals are underlined and vertical arrows denote possible 3′ ends of Igf2 transcripts. D, structure of the chicken Igf2 gene, after mapping with cDNA XM_015286525 from the NCBI nucleotide data resource and after the other analyses presented in B and C. Labeling is as in A. E, diagram of chicken IGF2 protein precursors, illustrating the derivation of each segment from different Igf2 exons. Mature 68-amino acid (AA) IGF2 is in blue; parts of the signal peptide are in black, and the E peptide is in red.
The NCBI nucleotide database contains two different experimentally determined chicken Igf2 cDNAs. The longer one, XM_015286525, consists of 3369 nucleotides and includes both 5′ and 3′ UTRs, and the shorter one contains primarily coding information. By using the larger cDNA sequence to search the chicken genome, a potential new exon was found within the Igf2 locus 5′ to the presumptive exon 1 noted above. This new exon contained both coding and noncoding DNA. Mapping with the chicken Igf2 cDNA also added 9 bp to the 5′ end of Ensembl-defined exon 1, and it resulted in identification of a potential splice donor region being located adjacent to these extra nucleotides (Fig. S1). Subsequent analyses of Igf2 gene expression by using adjacent 60-bp segments found within the new 5′ exon to query chicken liver RNA-Seq libraries found in the SRA NCBI database identified several potential additional features of the chicken Igf2 gene. Based on these new results, presumptive exon 1 appeared to be ∼568 bp in length and consisted of 108 bp of coding DNA and ∼460 bp of 5′ UTR (Fig. 1B). Moreover, a potential TATA box, which helps position RNA polymerase II at the start of transcription (43, 44), was identified 29–31 bp 5′ to the ends of the longest Igf2 transcripts mapped with RNA-Seq libraries (Fig. 1B), suggesting that the start of chicken Igf2 gene transcription may be at this location. However, examination of the region further 5′ using the Promoter 2.0, CNN Promoter, and the UC Berkeley Neural Network Promoter prediction software did not identify many typical components of vertebrate proximal promoters. Thus, although these data extend general understanding of the architecture of the chicken Igf2 gene, neither the beginning of the gene nor its promoter has been fully established yet.
Genome mapping with the Igf2 cDNA also extended the 3′ end of the last chicken Igf2 exon and identified two potential 3′ ends (Fig. 1, C and D). These two regions, which are separated by ∼535 bp, each have typical characteristics of polyadenylation sites, including a “AATAAA” poly(A) recognition sequence and a putative poly(A) addition site 17 or 21 bp 3′ to this element (Fig. 1C) (45, 46). Taken together, the results described above indicate that the chicken Igf2 gene spans at least 16,499 bp on chromosome 5, contains at least 4 exons and 3 introns, and potentially encodes two protein precursors, but a single mature IGF2 (Fig. 1, D and E, and Table 1).
Table 1.
Organization of terrestrial vertebrate Igf2 genes
Length is given in base pairs.
| Species | Exon 1 | Intron 1 | Exon 2 | Intron 2 | Exon 3 | Intron 3 | Exon 4 | Length |
|---|---|---|---|---|---|---|---|---|
| Chicken (G. gallus) | 568 | 5601 | 166 | 6420 | 167 | 740 | 2840 | 16,499 |
| Turkey (M. gallopavo) | 271a | 166 | 8484 | 167 | 714 | 2379 | 11,908 | |
| Duck (A. platyrhynchos) | 464b | <5519 | 166 | 6127 | 167 | 740 | 2286 | 15,448 |
| Zebra finch (T. guttata) | 481 | 8210 | 166 | 6624 | 167 | 445 | 2660 | 18,660 |
| Flycatcher (F. albicollis) | 474b | 7616 | 511 | 7500 | 167 | 450 | 2557 | 19,207 |
| Ch softshell turtle (P. sinensis) | 126 | 18,026 | 163 | 13425 | 167 | 1027 | 2856 | 35,783 |
| Anole lizard (A. carolinensis) | NDc | 163 | 5959 | 167 | 1099 | 3759 | 11,146 | |
| Frog (X. tropicalis) | 180 or 59 | 15,283 or 27,386 | 163 | 6614 | 167 | 969 | 441 | 25,263 or 36,772 |
a Data were found in cDNA and could not be mapped to genomic DNA.
b This is a poor-quality DNA sequence.
c ND indicates no DNA sequence detected.
Characterizing Igf2 genes in terrestrial vertebrates
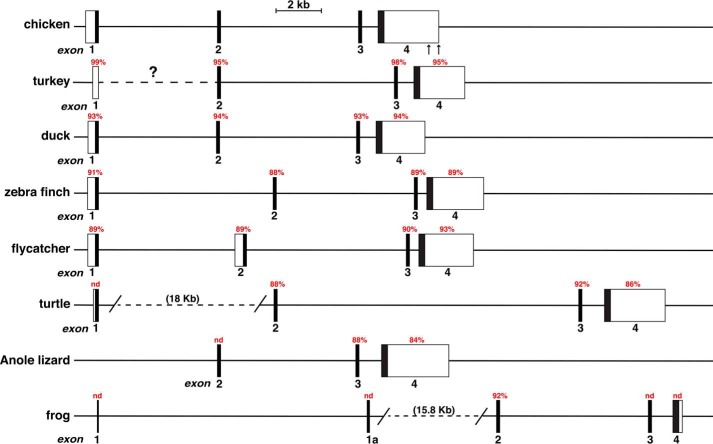
By using as genomic database queries the four chicken Igf2 exons and species-homologous cDNAs found in the NCBI nucleotide database, Igf2 also appeared to be a 4-exon gene in duck, zebra finch, flycatcher, and Chinese softshell turtle, a 3-exon gene in Anole lizard, and a 5-exon gene in frog. It also probably is a 4-exon gene in turkey, although the first exon, which is over 99% identical to the chicken homologue, could not be mapped to the turkey genome, most likely because of poor DNA sequence quality (Fig. 2, Tables 1 and 2). Moreover, in several of the species examined, the annotated genomic data were as incomplete as those for chicken Igf2 (e.g. three exons and no 5′ or 3′ UTRs in turkey and Anole lizard and three exons in flycatcher) or appeared to be unlikely (five proposed exons in duck, including two of 95 and 31 bp separated by a 34-bp intron). When all of the newly identified and mapped information was evaluated, these vertebrate Igf2 genes appeared to be far simpler than their mammalian homologues, which have up to 10 exons, including several noncoding exons, and up to 5 promoters (human and other primate IGF2 genes) (18). A possible exception to this lesser complexity is the frog, Xenopus tropicalis, which appeared to have two 5′ Igf2 exons: one, termed exon 1, was located more than 27 kb 5′ to exon 2 and lacks coding potential; the other, termed exon 1a, was ∼15 kb from exon 2 and contains an ORF (see Fig. 2, Table 1, and below).
Figure 2.
Comparison of terrestrial vertebrate Igf2 genes. Schematics are shown of chicken Igf2 and seven other vertebrate Igf2 genes. Exons are boxes, and introns and flanking DNA as depicted as horizontal lines. A scale bar is indicated, and the two potential 3′ ends of chicken Igf2 are denoted by vertical arrows. The location of turkey Igf2 exon 1 could not be mapped to the genome, as indicated by a ?. Angled parallel lines indicate discontinuities, with the actual distances spanned in parentheses. Percent nucleotide identity with different chicken Igf2 exons is noted for each gene (nd, no identity detected).
Table 2.
Nucleotide identity with chicken Igf2 exons (%)
| Species | Exon 1 (568 bp) | Exon 2 (166 bp) | Exon 3 (167 bp) | Exon 4 (2302 and 2840 bp)a |
|---|---|---|---|---|
| Turkey | 99b (271 bp) | 95 | 98 | 95 (2320 bp) |
| Duck | 93 (336 bp) | 94 | 93 | 94 (1824 bp) |
| Zebra finch | 91 (346 bp) | 88 | 89 | 89 (2167 bp) |
| Flycatcher | 89 (389 bp) | 89 (148 bp) | 90 | 93 (1511 bp) |
| Turtle | No match | 88 (120 bp) | 92 (89 bp) | 86 (1174 bp) |
| Anole lizard | Not detected | 88 (49 bp) | 86 (100 bp) | 84 (375 bp) |
| Frog | No match | 92 (75 bp) | No match | No match |
a Two potential poly(A) addition sites are shown.
b Data are from cDNA and could not be mapped to genomic DNA.
DNA sequence identity with chicken Igf2 was similar for all four exons in all species examined (88–95% for exon 2, 86–98% for exon 3, 84–95% for exon 4, and 89–100% for exon 1, although in the latter case, there was no match in three species; Table 2). Nucleotide similarity among these vertebrates was more variable in the region located 5′ to chicken Igf2 exon 1, and it ranged from 87% in turkey to 97% in duck, was minimal in zebra finch and flycatcher, and was not evident in turtle, lizard, or frog. Collectively, these latter observations support other evidence noted above that this DNA segment may not represent the proximal Igf2 gene promoter in any of these species.
Igf2 gene expression in terrestrial vertebrates
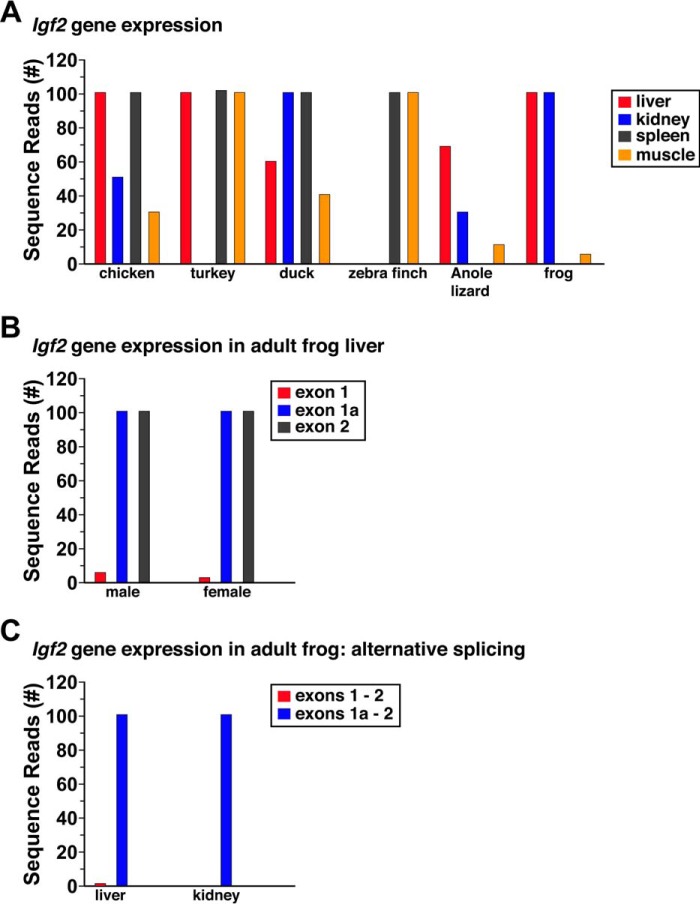
Analysis of information in the SRA NCBI database demonstrated that Igf2 mRNA was expressed in all species in which data were available (Fig. 3). Results from evaluating RNA-Seq experiments for Igf2 transcripts containing exon 2 are depicted for six species from liver, kidney, spleen, and skeletal muscle (Fig. 3A). Further examination of Igf2 gene expression information for frog revealed marked variability in apparent exon usage. Transcripts containing exon 1a predominated when RNA-Seq libraries were interrogated from either male or female liver, as there were 50–100 times more reads than for exon 1 (Fig. 3B). Moreover, no transcripts were identified that contained parts of both exons, and by contrast mRNAs containing exons 1 and 2 or exons 1a and 2 were both found, although the latter predominated (Fig. 3C). Mapping studies using the same RNA-Seq libraries from liver also demonstrated that frog exon 1 extended at least 26 nucleotides further in the 5′ direction, and that exon 1a was at least 93 bp longer than recorded in the Ensembl genome browser. Collectively, these results suggest that alternative RNA splicing leads to several classes of frog Igf2 mRNAs with distinct 5′ ends.
Figure 3.
Igf2 gene expression in terrestrial vertebrates. A, levels of Igf2 transcripts were determined in liver, kidney, spleen, and skeletal muscle by querying RNA-Seq libraries using 60-bp genomic DNA segments from a region equivalent in each species to the same part of chicken Igf2 exon 2. Results are plotted as the number of sequence reads per species (range = 0–100). Data were obtained from chicken, turkey, duck, zebra finch, Anole lizard, and frog but were not available for flycatcher or Chinese softshell turtle. B, comparison of Igf2 gene expression in hepatic RNA-Seq libraries from adult male and female frogs, using as probes 60-bp fragments of exon 1, exon 1a, and exon 2. C, comparison of Igf2 gene expression in hepatic and kidney RNA-Seq libraries from adult male frog, using as probes 60-bp fragments derived from exons 1 and 2 (3′ 30 bp from exon 1 plus 5′ 30 bp from exon 2) or exons 1a and 2 (3′ 30 bp from exon 1a plus 5′ 30 bp from exon 2). A–C, the libraries are listed under “Experimental procedures.”
Characterizing Igf2 genes in fish
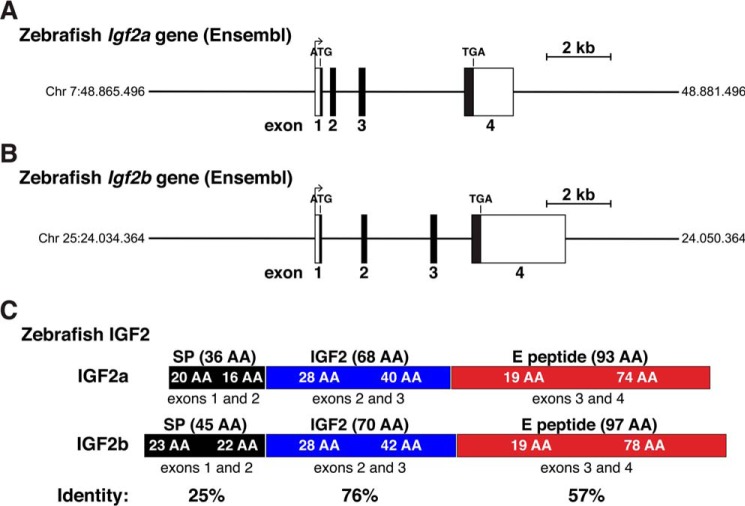
Zebrafish were selected initially as the index species for studying Igf2 genes in fish, as it has been more extensively examined than other fish species found in the Ensembl or UCSC Genome Browsers. Based on the information in these databases as of August 2018, the zebrafish genome has two Igf2 genes, Igf2a on chromosome 7, containing four exons within 5984 bp of genomic DNA (Fig. 4A and Table 3), and Igf2b on chromosome 25, also consisting of four exons and spanning 7506 bp (Fig. 4B and Table 3). Examination of these genes and their corresponding cDNAs obtained from the NCBI nucleotide database showed that the 5′ end of Igf2b exon 1 matched the 5′ end of the longest cDNA (AF250289), and the 3′ end of exon 4 nearly matched its 3′ end (the last 3 bp are TCA in the gene and GCA in the cDNA). A similarly high degree of DNA sequence identity was found for Igf2a and cDNA NM_131433, which differed only within the first four nucleotides at the 5′ end of exon 1. Thus, the annotation of both genes appears to be accurate, unlike the situation with chicken Igf2 (Fig. 1). Moreover, both zebrafish Igf2a and Igf2b are structurally similar to chicken Igf2 (compare Figs. 4, A and B, with 1D). However, even though expression of both genes has been demonstrated during different zebrafish developmental stages, and in adult tissues (47, 48), no gene promoters have been characterized to date, and no studies have been reported on transcriptional control for either Igf2a or Igf2b.
Figure 4.
Organization of zebrafish Igf2 genes. A, map of the zebrafish Igf2a gene from the Ensembl genome database. B, map of the zebrafish Igf2b gene from Ensembl genome database. A and B, chromosomal coordinates are labeled; exons appear as boxes; introns and flanking DNA are horizontal lines; potential transcription start sites, polyadenylation sites, and locations of ATG and TGA codons are marked; and a scale bar is indicated. C, diagram of zebrafish IGF2 protein precursors, illustrating the derivation of each segment from different Igf2a or Igf2b exons. Mature IGF2 is in blue; signal peptides are in black; and E peptides are in red. Percent identities between each part of IGF2a and IGF2b are indicated.
Table 3.
Organization of fish Igf2 genes
Length is given in base pairs.
| Species | Exon 1 | Intron 1 | Exon 2 | Intron 2 | Exon 3 | Intron 3 | Exon 4 | Intron 4 | Exon 5 | Gene length |
|---|---|---|---|---|---|---|---|---|---|---|
| Tetraodon (T. nigroviridis) | 212 | 1217 | 151 | 1352 | 182 | 1294 | 3557 | 7920 | ||
| Fugu (T. rubripes) | 212a | 899 | 151 | 1445 | 182 | 1305 | 3708a | 8043 | ||
| Stickleback (G. aculeatus) | 206a | 920 | 151 | 1473 | 182 | 1378 | 3701a | 8217 | ||
| Medaka (O. latipes) | 306a | NDb | ND | ND | 171 | 1731 | 2929a | 5475 | ||
| Cod (G. morhua) | 195a | 777 | 151 | 3156 | 182 | 1946 | 6119a | 15,139 | ||
| Cave fish a (A. mexicanus) | 455 | 2224 | 139 | 4954 | 176 | 3341 | 2028 | 13,316 | ||
| Cave fish b (A. mexicanus) | 401 | 1035 | 151 | 2899 | 182 | 958 | 3530c | 9168 | ||
| Tilapia (O. niloticus) | 195a | 838 | 151 | 2620 | 182 | 1291 | 3548c | 8986 | ||
| Amazon molly (P. formosa) | 813 | 951 | 151 | 2276 | 184 | 1150 | 4264 | 9789 | ||
| Platyfish (X. maculatus) | 135a | 881 | 76 | 257 | 35 | 2078 | 243 | 1155 | 3409 | 7352 |
| Zebrafish a (D. rerio) | 185 | 318 | 133 | 705 | 176 | 2923 | 1545 | 5984 | ||
| Zebrafish b (D. rerio) | 158 | 1250 | 151 | 1881 | 182 | 991 | 2894 | 7506 | ||
| Spotted gar (L. oculatus) | 195a | 800 | 163 | 2218 | 176 | 1741 | 3934 | 9226 | ||
| Coelecanth (L. chalumnae) | 358 | 28077 | 163 | 18437 | 167 | 1126 | >213 | >48540 |
Searches using Igf2a exons as queries revealed just short segments of similarity in only seven other fish genomes. Slightly longer matches were noted with Igf2b, although these were found primarily within noncoding portions of exon 4 in 10 species. Searches using chicken Igf2 exons were similarly uninformative. Of note, a fairly low level of DNA sequence identity with other fish had been observed for the zebrafish Igf1 gene and prompted using tetraodon Igf1 exons for mapping this gene in other species (49). The same strategy was subsequently employed here (see below).
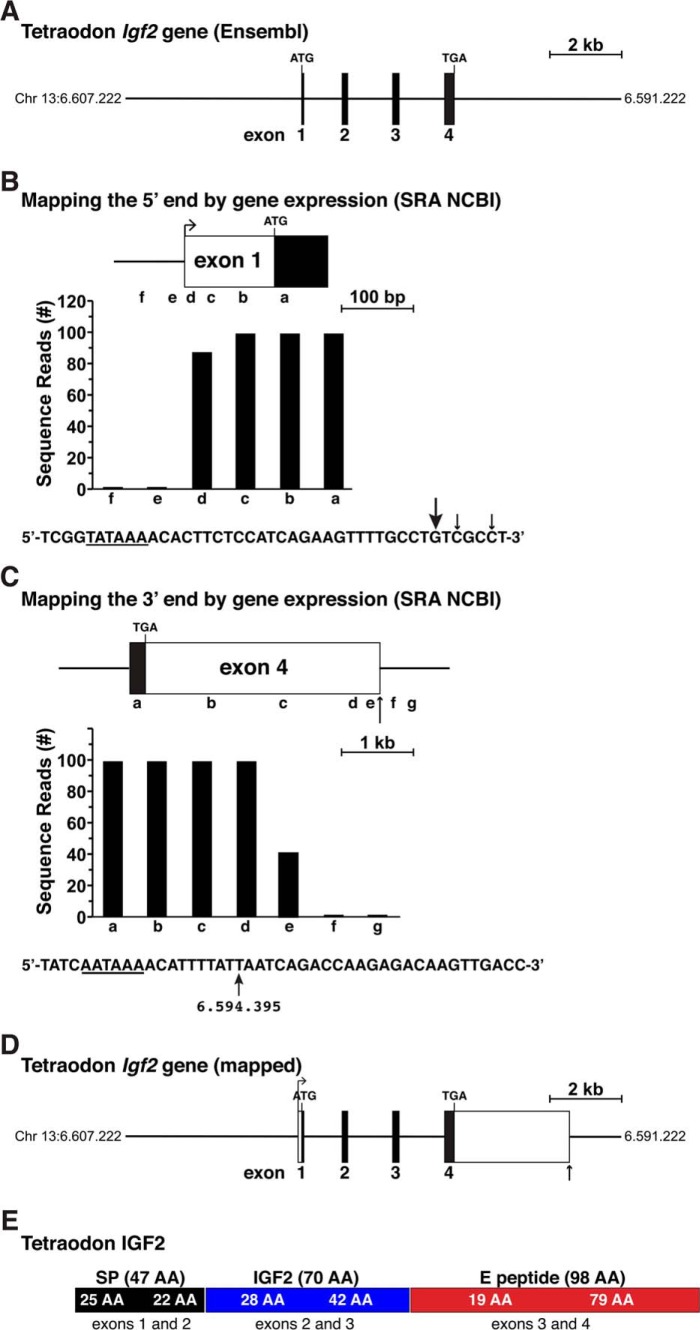
In contrast to the two zebrafish Igf2s, which are well annotated, the single tetraodon Igf2 gene has been poorly characterized in Ensembl and in the UCSC Genome Browser. Like zebrafish Igf2a and Igf2b, tetraodon Igf2 was reported to consist of four exons, but unlike the former, it appeared to lack identifiable 5′ or 3′ UTRs (Fig. 5A). As there were no tetraodon Igf2 cDNAs in the NCBI nucleotide database, the alternative approach used for chicken Igf2 was employed to map the beginning and end of the gene. Adjacent 60-bp DNA segments found within and 5′ to presumptive tetraodon exon 1 were used to query the RNA-Seq library, ERX1054374, which was derived from embryo transcripts at 24 h post-fertilization. Results showed that this exon extended for approximately an additional 126 bp in the 5′ direction (Fig. 5B). Moreover, as seen for chicken Igf2 (Fig. 1B), a potential TATA box, which helps position RNA polymerase II at the start of transcription (43, 44), was identified 26 nucleotides 5′ to the ends of the longest Igf2 transcript found in this RNA-Seq library (Fig. 5B).
Figure 5.
Structure of the tetraodon Igf2 gene. A, map of the tetraodon Igf2 gene as found in the Ensembl genome database. Chromosomal coordinates are labeled, and exons appear as boxes and introns and flanking DNA as horizontal lines. Locations of ATG and TGA codons are marked; and a scale bar is shown. B, mapping the 5′ end of tetraodon Igf2 with gene expression data from RNA-Seq library, ERX1054374, and 60 bp genomic segments a–f as probes. The DNA sequence below the bar graph illustrates the putative 5′ end of exon 1, with locations of the 5′ ends of the longest RNA-seq clones indicated by arrows (arrow size is proportional to the number of clones identified). A possible TATA box is underlined. C, characterizing the putative 3′ end of tetraodon Igf2 exon 4 using data from RNA-Seq library, ERX1054374, and 60-bp genomic segments a–g as probes. A possible polyadenylation signal is underlined in the DNA sequence below the graph, and the vertical arrow denotes a potential 3′ end of Igf2 mRNAs with its chromosomal coordinate. D, structure of the tetraodon Igf2 gene based on the analyses shown in B and C. Labeling is as in A. E, diagram of the tetraodon IGF2 protein precursor, with the derivation of each segment from different Igf2 exons indicated. Mature 70-amino acid IGF2 is in blue; the signal peptide is in black; and the E peptide is in red.
An analogous strategy was used to map the 3′ end of presumptive exon 4, and this led to identification of a 3′ UTR of ∼3317 bp, and a total exon length of 3557 bp, which included near its 3′ end an “AATAAA” presumptive poly(A) recognition sequence and a putative poly(A) addition site (Fig. 5C) (45, 46). Taken together, the results described above, defining both 5′ and 3′ ends of the tetraodon Igf2 gene, indicate that it spans 7920 bp on chromosome 13 and that it encodes a single protein (Fig. 5, D and E, and Table 3).
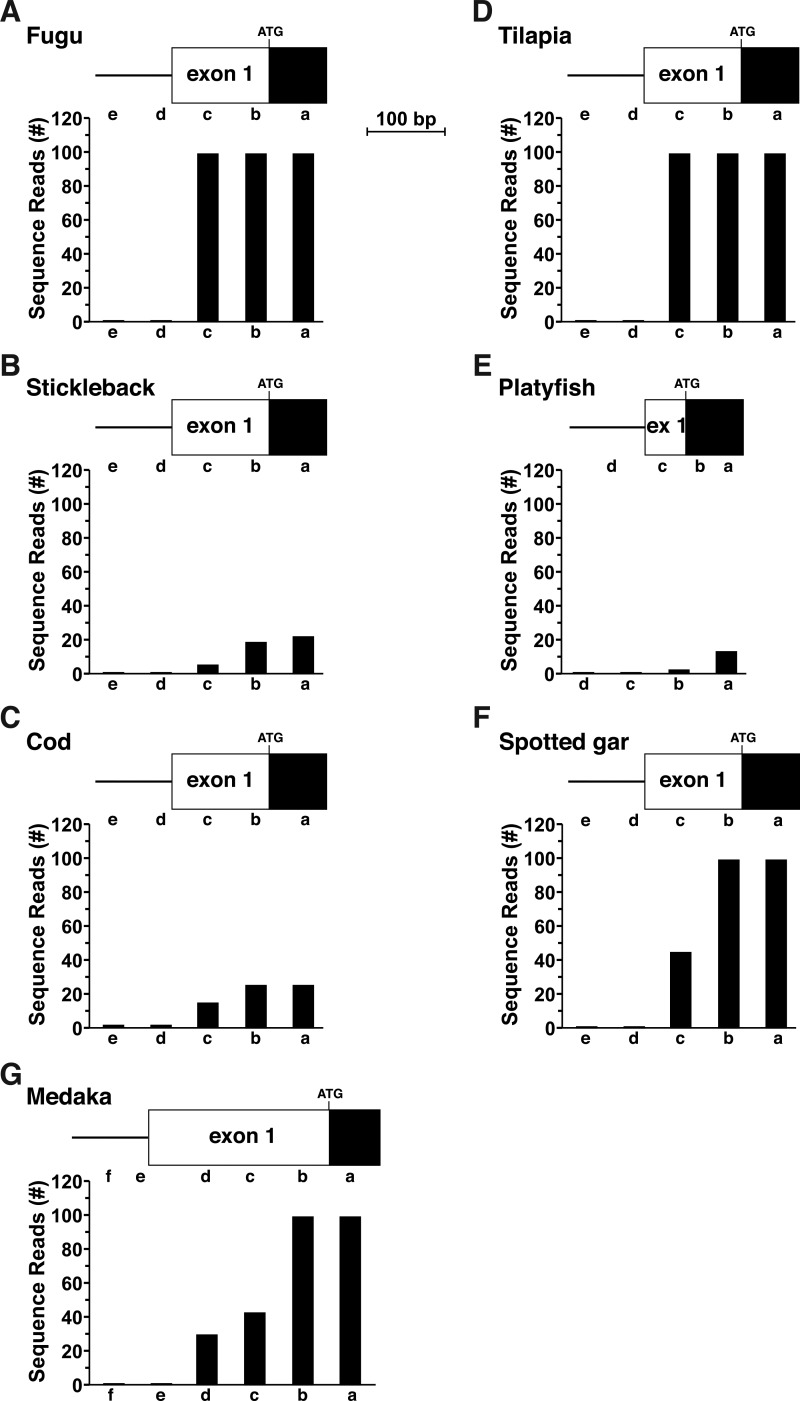
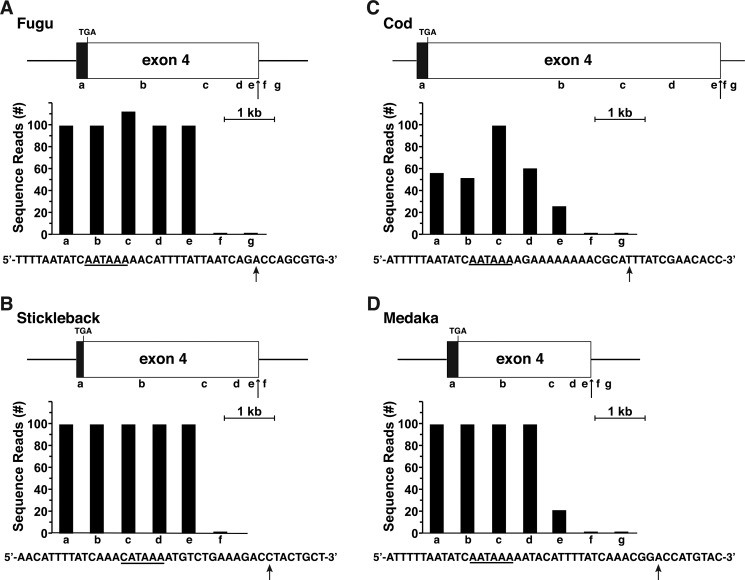
Based on the success of these mapping experiments with chicken and tetraodon Igf2, a similar approach was used in seven other fish in which gene annotation was poor: fugu, stickleback, cod, tilapia, platyfish, spotted gar, and medaka, and in which RNA-Seq libraries were available. In six of these fish, the genomic data were nearly as incomplete as those for tetraodon Igf2 (no 5′ or 3′ UTRs in cod, fugu, and stickleback, and no 5′ UTR in spotted gar, tilapia, and platyfish). Screening of RNA-Seq libraries led to the identification of presumptive beginnings and ends for many of these genes (Figs. 6 and 7). For medaka, in which only two Igf2 exons had been identified in the genome, most likely because of poor DNA sequence quality, a combination of genomic searches with a medaka Igf2 cDNA and mapping experiments using a liver-derived RNA-Seq library identified a presumptive exon 1 (but not an exon 2) and extended both exons 1–4 to their presumptive 5′ and 3′ ends, respectively (Figs. 6 and 7).
Figure 6.
Characterizing 5′ ends of fish Igf2 genes by analysis of RNA-Seq libraries. A–G, mapping putative 5′ ends of fish Igf2 genes by examination of gene expression data from species-specific RNA-Seq libraries, with 60-bp genomic segments a–e or a–f as probes. A, fugu, library SRX4020085 (liver). B, stickleback, library SRX2712198 (liver). C, cod, library SRX1044010 (liver). D, tilapia, library SRX1257756 (liver). E, platyfish, library SRX031881 (whole embryo). F, spotted gar, library SRX661023 (whole embryo). G, Medaka, library SRX661040 (liver).
Figure 7.
Characterizing 3′ ends of fish Igf2 genes by analysis of RNA-Seq libraries. A–D, mapping putative 3′ ends of fish Igf2 genes by examination of gene expression data from species-specific RNA-Seq libraries, with 60-bp genomic segments a–f or a–g as probes. A possible polyadenylation signal is underlined in the DNA sequence below each graph, and vertical arrows denote potential 3′ ends of Igf2 mRNAs. A, fugu, library SRX4020085 (liver). B, stickleback, library SRX2712198 (liver). C, cod, library SRX1044010 (liver). D, Medaka, library SRX661040 (liver).
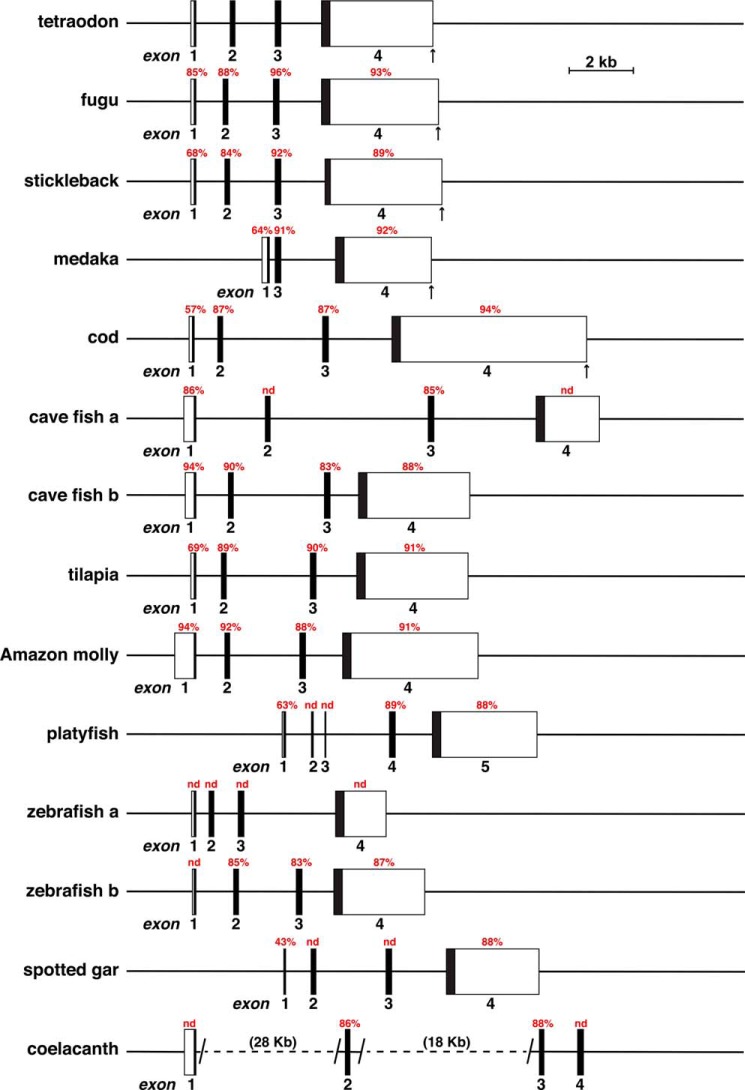
Additional genomic database searches with tetraodon Igf2 exons, coupled with information from Ensembl and UCSC Genome browsers, and the mapping data illustrated in Figs. 6 and 7, led to the conclusion that Igf2 was a 4-exon gene in fugu, cave fish (both Igf2a and Igf2b), tilapia, Amazon molly, spotted gar, and coelacanth, as well as in zebrafish (Igf2a and Igf2b), and a 5-exon gene in platyfish (Fig. 8). In stickleback, five Igf2 exons were predicted in Ensembl, with a 4-nucleotide intron separating the last two exons. As an intron this small is not feasible (50, 51), Ensembl's Igf2 exons 4 and 5 were combined here into a single Igf2 exon 4 (Fig. 8 and Table 4). There also was no identifiable Igf2 gene in lamprey, even though an IGF2 protein has been characterized in this species (see below). When all of this newly characterized information was evaluated, fish Igf2 genes, like those of terrestrial vertebrates, appeared to be organizationally simpler than their mammalian homologues (Fig. 8) (18). In fact, except for platyfish and frog, with 5 exons, and Anole lizard and possibly medaka, with 3 exons, all the other vertebrate Igf2 genes in the Ensembl or UCSC Genome Browsers appear to be composed of 4 exons and 3 introns (Figs. 2 and 8).
Figure 8.
Comparison of fish Igf2 genes. Diagrams are shown for tetraodon Igf2, zebrafish Igf2a and Igfb, and for Igf2 genes from 10 other fish species. No Igf2 gene could be identified in the lamprey genome. Exons are boxes, and introns and flanking DNA are shown as horizontal lines. A scale bar is indicated, and vertical arrows denote the 3′ ends of several Igf2 genes. Angled parallel lines and a horizontal dotted line indicate a change in scale in coelacanth Igf2 between exons 1 and 2, and 2 and 3, with the distances spanned in parentheses. Percent nucleotide identity with different tetraodon Igf2 exons is noted for each fish gene (nd, no identity detected).
Table 4.
Nucleotide identity with tetraodon Igf2 exons (%)
Length of DNA sequence similarity is given in parentheses if less than tetraodon exon length.
| Species | Exon 1 (212 bp) | Exon 2 (151 bp) | Exon 3 (182 bp) | Exon 4 (3557 bp) |
|---|---|---|---|---|
| Fugu | 85 | 88 | 96 | 93 |
| Stickleback | 68 | 84 | 92 (172 bp) | 89 (1843 bp) |
| Medaka | 64 | No exon | 91 (120 bp) | 92 (1235 bp) |
| Cod | 57 | 87 (79 bp) | 87 (100 bp) | 94 (1016 bp) |
| Cave fish a | 86 (80 bp) | No match | 85 (68 bp) | No match |
| Cave fish b | 94 (65 bp) | 90 (70 bp) | 83 (134 bp) | 88 (970 bp) |
| Tilapia | 69 | 89 (75 bp) | 90 (172 bp) | 91 (1938 bp) |
| Amazon molly | 94 (52 bp) | 92 (79 bp) | 88 (156 bp) | 91 (1600 bp) |
| Platyfish | 63 | No match | 89 (126 bp) | 88 (1760 bp) |
| Zebrafish a | No match | No match | No match | No match |
| Zebrafish b | No match | 85 (61 bp) | 83 (77 bp) | 87 (817 bp) |
| Spotted gar | 43 | No match | No match | 88 (759 bp) |
| Coelecanth | No match | 86 (64 bp) | 88 (42 bp) | No match |
In addition to structural similarity, DNA sequence identity with tetraodon Igf2 was relatively high in all fish species examined. This ranged from 84 to 92% for exon 2, 83 to 96% for exon 3, 87 to 94% for exon 4, and 86 to 94% for exon 1, although in three species there was no match for the latter exon (Table 4).
In terrestrial vertebrate Igf2 genes, an intron divides the exons separating the equivalents of chicken exons 2 and 3 after the first nucleotide of codon 29 of mature IGF2. This is the same codon and codon position and the identical encoded amino acid (serine) found for the intron separating homologous human exons 8 and 9 and mouse exons 6 and 7 (3, 4). The identical exon–intron–exon junctions were observed in all terrestrial vertebrates and in all fish Igf2 genes, except for medaka, in which no exon 2 could be identified, and platyfish, with an intron interrupted codon 1 of mature IGF2 (threonine) after the first nucleotide.
Igf2 gene expression in fish
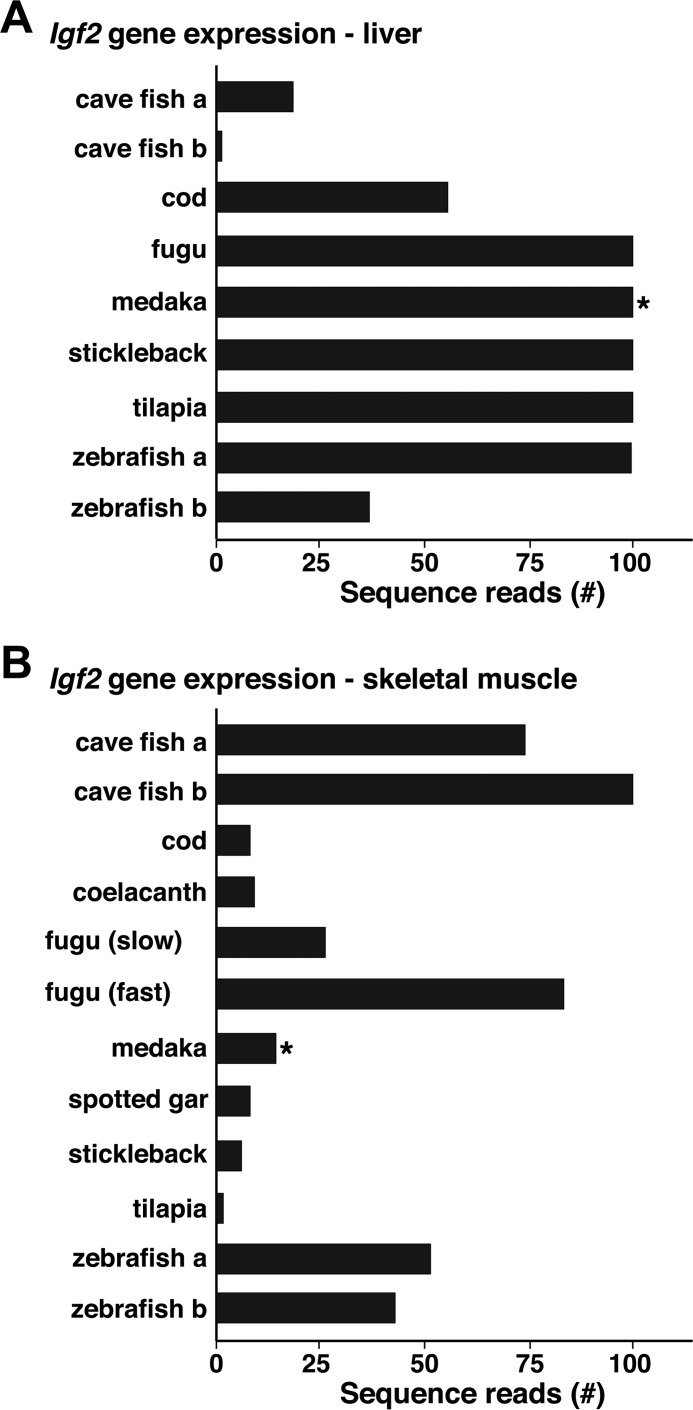
Further analysis of RNA-Seq libraries in the SRA NCBI database demonstrated that Igf2 mRNA accumulated in a variety of different organs, tissues, and developmental stages in different fish (Fig. 9 and data not shown). Results for Igf2 transcripts containing exon 2 (exon 3 in medaka) are pictured for seven species from liver and for nine from skeletal muscle (Fig. 9). Of note, both Igf2a and Igf2b genes are expressed in liver and in muscle in cave fish and in zebrafish, and fugu Igf2 mRNA is detected at different levels in slow versus fast twitch skeletal muscle (Fig. 9B).
Figure 9.
Igf2 gene expression in fish. Igf2 transcript levels were identified in liver (A) and in skeletal muscle (B) by querying RNA-Seq libraries using 60-bp genomic DNA segments from a region equivalent in each species to the same part of tetraodon Igf2 exon 2 (or * exon 3 in medaka). Results are plotted as the number of sequence reads per species (range = 0–100). Information was not available from either liver or muscle for Amazon molly, platyfish, or tetraodon or for liver for coelacanth. A and B, libraries searched are listed under “Experimental procedures.”
IGF2 protein sequences in nonmammalian vertebrates
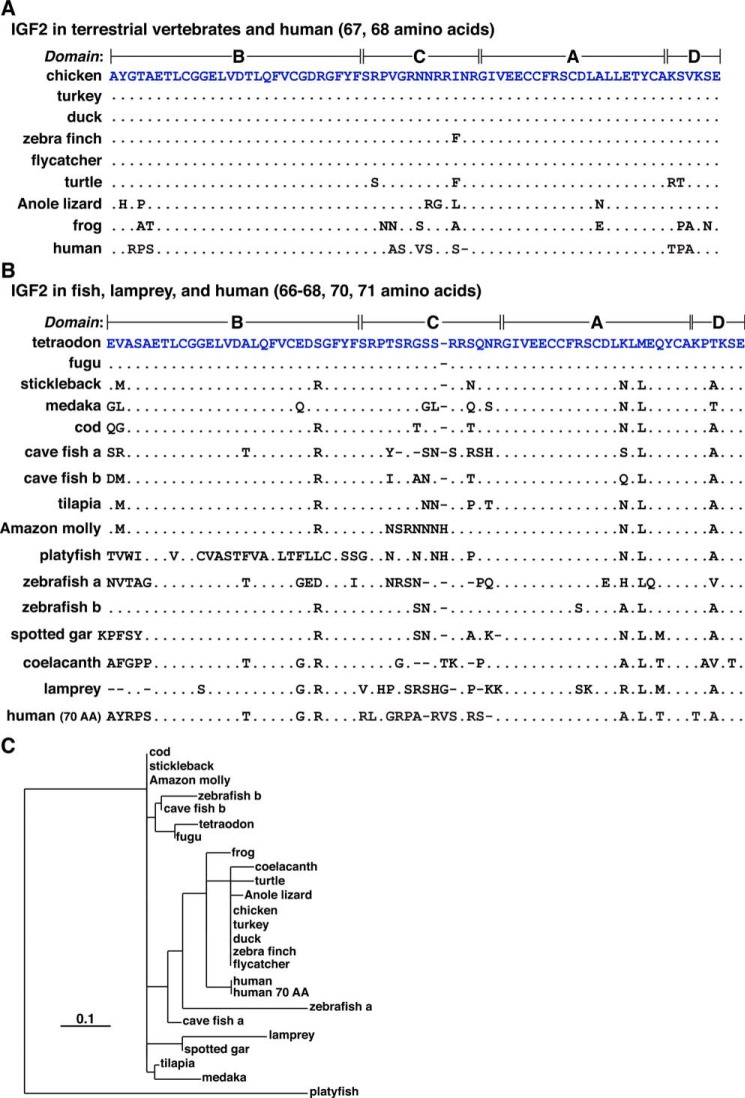
The 68-amino acid chicken IGF2 protein resembles the 67-residue human IGF2, as it consists of four domains, termed B, C, A, and D (Fig. 10A) (7). This protein appears to be found within two types of precursors with different N-terminal signal peptides, depending on whether mRNA translation begins at the first or second AUG codon (Figs. 1E and 10A). Among the other species studied here, mature IGF2 was identical to the chicken protein in turkey, duck, and flycatcher; a single amino acid substitution was seen in zebra finch (Ile39 to Phe), four changes were found in turtle (Arg30 to Ser, Ile39 to Phe, Lys63 to Arg, and Ser64 to Thr), and multiple differences were detected in the other species, including human (Fig. 10A and Table 5).
Figure 10.
Alignments of vertebrate IGF2 proteins. A, amino acid sequences of IGF2 from eight terrestrial vertebrates and humans in single-letter code. Differences among species are shown, with identities being depicted by dots. Dashes indicating no residue have been placed to maximize alignments. B, amino acid sequences of IGF2 from 12 fish species, lamprey, and human (70 amino acid variant) in single-letter code. Differences among species are shown, with identities being depicted by dots. Dashes (indicating no residue) have been placed to maximize alignments. C, phylogenetic tree of mature IGF2 in vertebrates. The scale bar indicates 0.1 substitutions per site, and the length of each branch approximates the evolutionary distance.
Table 5.
Amino acid identities with chicken IGF2 (%)
AA means amino acids.
| Species | Long signal peptide (62 amino acids) | Signal peptide (23 amino acids) | Mature IGF2 (68 amino acids) | E peptide (96 amino acids) |
|---|---|---|---|---|
| Turkey | None | 96 | 100 | 100 |
| Duck | a | 91 | 100 | 56 (97 AA) |
| Zebra finch | None | 87 | 99 | 88 |
| Flycatcher | None | 83 | 100 | 85 (90 AA) |
| Turtle | 56 (59 AA) | 65 | 94 | 71 (95 AA) |
| Anole lizard | None | 61 | 91 | 67 (95 AA) |
| Frog | 26 (55 AA) | 52 | 85 | 43 (94 AA) |
| Human | <10 (80 AA) | 30 (24 AA) | 84 (67 AA) | 34 (89 AA) |
a This is a poor-quality DNA sequence.
The 70-residue tetraodon IGF2 protein also consists of B, C, A, and D domains (Fig. 10B). Among the other fish studied here, only fugu Igf2 encoded a mature IGF2 identical to the tetraodon protein. In contrast, multiple amino acid substitutions, codon insertions, and/or deletions were found in the other species (range of identity: 58–91%, Fig. 10B and Table 6). A phylogenetic comparison demonstrated a greater similarity of mature IGF2 among terrestrial vertebrates and coelacanth than among fish, and it also showed clustering of protein sequences among different groups of fish (e.g. cod, stickleback, Amazon molly, tetraodon, fugu, cave fish IGF2b, and zebrafish IGF2b; Fig. 10C).
Table 6.
Amino acid identities with tetraodon IGF2 (%)
AA means amino acids.
| Species | Signal peptide (47 amino acids) | Mature IGF2 (70 amino acids) | E peptide (98 amino acids) |
|---|---|---|---|
| Fugu | 66 | 100 | 96 |
| Stickleback | 60 | 91 | 90 (97 AA) |
| Medaka | 40 (44 AA) | 86 | 79 |
| Cod | 55a (38 AA) | 89 | 72 (97 AA) |
| Cave fish a | 17 (49 AA) | 79 (68 AA) | 55 (96 AA) |
| Cave fish b | 6 (53 AA) | 86 | 78 (97 AA) |
| Tilapia | 55 | 87 | 88 |
| Amazon molly | 17 (51 AA) | 83 (71 AA) | 85 |
| Platyfish | 38 (50 AA) | 58 (71 AA) | 59 (103 AA) |
| Zebrafish a | 36 (36 AA) | 69 (68 AA) | 62 (93 AA) |
| Zebrafish b | 38 (45 AA) | 90 | 87 (97 AA) |
| Spotted gar | 32 (50 AA) | 80 | 73 (97 AA) |
| Coelecanth | 17 (53 AA) | 74 (68 AA) | 42 (86 AA) |
| Lamprey | 15 (53 AA) | 70 (66 AA) | NDb |
| Chicken | 9 (23 and 62 AA) | 75 (68 AA) | 42 (96 AA) |
| Human | 2 (24 and 80 AA) | 80 (70 AA) | 24 (89 AA) |
a This is a partial sequence.
b ND means not detected.
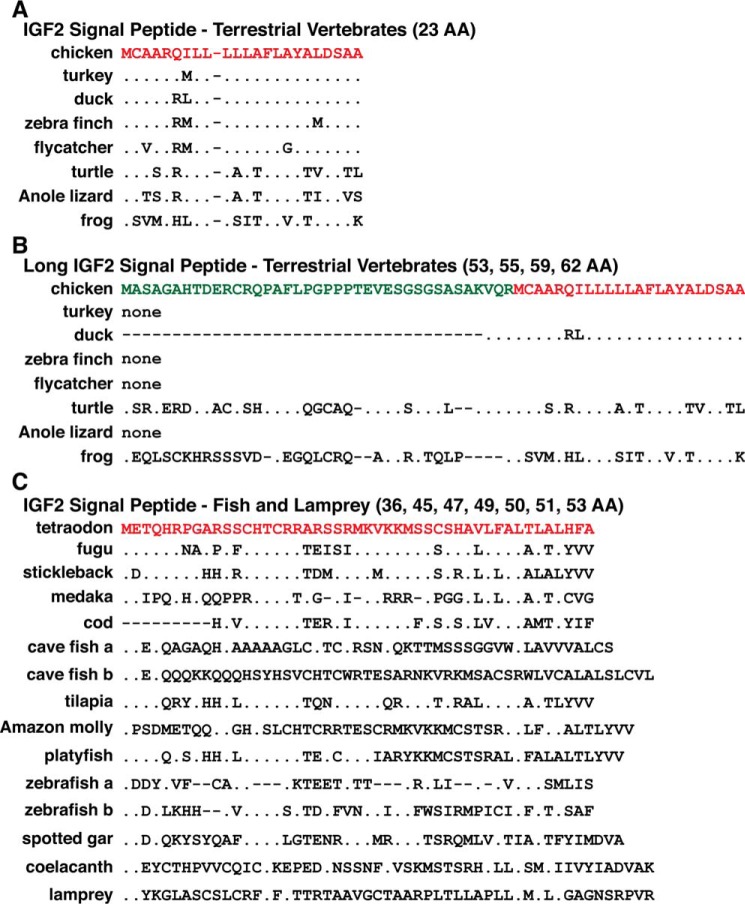
The two potential chicken IGF2 signal peptides either have 23 or 62 residues. The shorter segment starts with the first methionine codon in exon 2. In contrast, the longer signal sequence is encoded by presumptive exons 1 and 2 (36 and 26 codons, respectively; Figs. 1E and 11, A and B, and Table 5). A smaller signal peptide was found in each nonmammalian terrestrial vertebrate analyzed here. It is 23 amino acids in length and varied in all species from the chicken IGF2 signal peptide, with differences ranging from a single amino acid substitution (turkey) to multiple alterations (Fig. 11A and Table 5). A longer signal sequence also could be detected in duck, where it is incomplete, and in turtle and frog, but not in other birds (Fig. 11B and Table 5). An even longer signal sequence of 80 amino acids is predicted for human IGF2 (17), but its similarity with the chicken signal peptide is negligible (Table 5).
Figure 11.
Alignments of vertebrate IGF2 signal sequences. A, amino acid sequences of IGF2 signal peptides from eight terrestrial vertebrates in single-letter code. Differences are shown, and identities are indicated by dots. B, amino acid sequences of longer IGF2 signal peptides. Differences are indicated, and identities are signified by dots. A dash indicates no residue. Bold red text is identical to the short signal sequence shown in A. No longer signal peptides could be detected for turkey, zebra finch, flycatcher, or Anole lizard (= none). C, amino acid sequences of IGF2 signal peptides from 12 fish species and lamprey in single-letter code. Differences are shown, and identities are indicated by dots, and a dash signifies no residue. B and C, dashes have been placed to maximize alignments.
The IGF2 signal peptide in fish is of an intermediate length between short and long chicken signal sequences, ranging from 36 to 53 residues in different species, with amino acid similarity being substantially lower than observed for mature IGF2 (Fig. 11C and Table 6). Of note, nearly all of these signal sequences are predicted to have internal in-frame methionine residues (Fig. 11C). Because there are no data on the biosynthesis of IGF2 precursors in any nonmammalian vertebrate species, it is not known how effectively mature IGF2 could be generated from a protein precursor with either short or long signal peptides nor which methionine is the initiating residue for protein translation (52, 53).
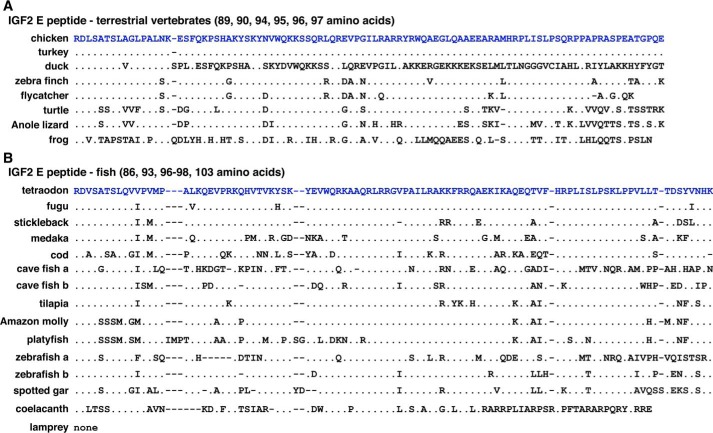
The E peptide at the C-terminal end of the IGF2 protein progenitor consists of 89 amino acids in human and mouse (4, 17, 32, 54) but is 96 residues in chicken (Fig. 12A and Table 5). Except for turkey, in which the IGF2 E region was identical to the chicken segment, it varied in other terrestrial vertebrates in both amino acid sequence and length (e.g. flycatcher, 90 amino acids, 85% identity with chicken; Anole lizard, 95 residues, 67% identity; and frog, 94 amino acids, 43% identity; Fig. 12A and Table 5). The E peptide comprises 98 residues in tetraodon (Fig. 12B and Table 6), and except for fugu, in which there were only 4 amino acid substitutions versus tetraodon (96% identity), it was variable in other fish species in both length and amino acid sequence similarity (e.g. stickleback, 97 amino acids, 90% identity with tetraodon; platyfish, 103 residues, 59% identity; and spotted gar, 97 residues, 73% identity; Fig. 12B and Table 6). The human E peptide shares little similarity with E domains of either terrestrial vertebrates or fish (34% identity with chicken (Table 5) and 24% with tetraodon (Table 6)). The precise functions of this segment of IGF2 have not been established in any species, although it is present in all mammalian and nonmammalian vertebrates that synthesize IGF2 (4, 32, 54).
Figure 12.
Alignments of vertebrate IGF2 E peptides. A, amino acid sequences of the IGF2 C-terminal E peptide in eight terrestrial vertebrates in single-letter code. Differences are shown, and identities are depicted by dots, and a dash indicates no residue. B, amino acid sequences of the C-terminal E peptide in 12 fish species in single-letter code. Differences are shown, and identities are depicted by dots, and a dash indicates no residue. No E peptide has been defined for lamprey (= none). A and B, dashes have been placed to maximize alignments.
Igf2 locus organization in nonmammalian vertebrates
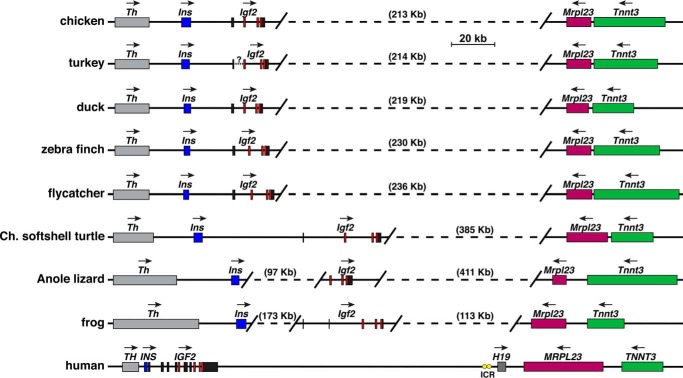
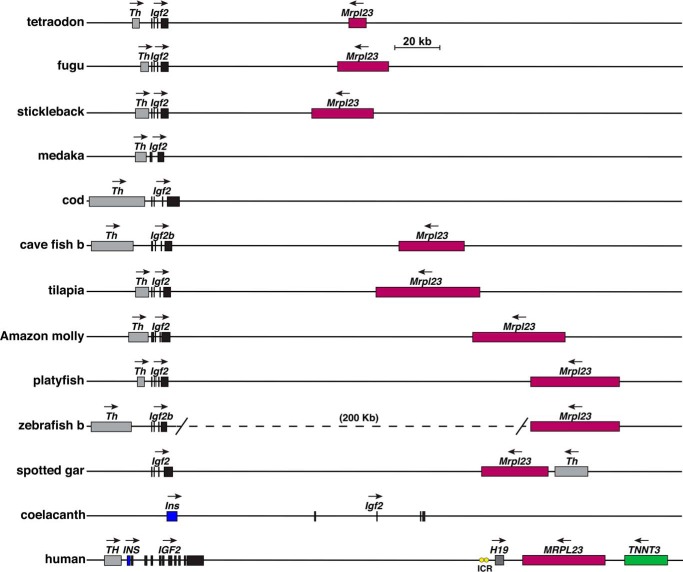
Fig. 13 depicts maps of the Igf2 locus for the terrestrial vertebrates analyzed here. The locus exhibits several similarities in all of these species in the overall topology of the five genes that are present, Th, Ins, Igf2, Mrpl23, and Tnnt3. In birds, the organization of these genes is congruent, with Th, Ins, and Igf2 defining a cluster of three genes in the same transcriptional direction, separated by 213–236 kb from the other two genes, Mrpl23 and Tnnt3, which are in the opposite transcriptional orientation (Fig. 13). In other terrestrial vertebrates, the relative transcriptional orientation is identical with birds, but the distances between individual genes and the two gene clusters are substantially larger, although in frog only 113 kb separates Igf2 from Mrpl3. Of note, the same five genes are found in the same relative orientation within the human IGF2 locus, although intergenic distances are far shorter than in birds, reptiles, or amphibians (Fig. 13). Also, H19, which expresses a long noncoding RNA (20, 55) and is not found here in nonmammalian vertebrates, is present in humans and in other mammals, along with an imprinting control region (ICR), which regulates reciprocal parental chromosome-of-origin–specific expression of IGF2 and HI9 in humans and in other mammalian species (23–26, 36). The Igf2 locus in fish appears to be simpler than in terrestrial vertebrates, as only two other genes, Th and Mrpl23, are present (Fig. 14). The location and orientation of these genes in the locus are highly similar among the 10 teleost fish studied here but are less so in the nonteleost, spotted gar, in which Th is found 5′ to Mrpl23 (Fig. 14), indicating that an apparent chromosomal rearrangement had occurred after the evolutionary separation of teleosts and nonteleosts. These results also support the idea that Igf2b is likely to be the ancestral Igf2 gene, based on it being embedded in a locus with shared features that also are found in birds and mammals (Figs. 13 and 14), and on the fact that cave fish and zebrafish Igf2a loci lack these other genes (data not shown). Moreover, although in medaka and cod Mrpl23 is apparently not found within this locus, this could reflect the more incomplete quality of their genome assemblies, because it is present in both species (data not shown). A similar quality control problem may be true for the coelacanth genome, in which Mrpl23 maps near Tnnt3 (data not shown), as is observed in both terrestrial vertebrates (Fig. 13) and mammals (18), but could not be localized near Igf2 (Fig. 14). Taken together, these observations demonstrate that several features of the Igf2 locus have been retained during more than ∼500 Myr of vertebrate and mammalian speciation, and thus they argue that the Igf2 gene and locus are phylogenetically ancient.
Figure 13.
Igf2 gene and locus in terrestrial vertebrates and human. Diagrams of chicken Igf2, seven other terrestrial vertebrate Igf2 loci, and the human IGF2–H19 locus are shown. For Igf2 and IGF2, individual exons are depicted as boxes (black noncoding, red coding). Other genes are shown as single boxes and include TH/Th, INS/Ins, H19, MRPL23/Mrlp23, and TNNT3/Tnnt3. A horizontal arrow labels the direction of transcription for each gene. Yellow ovals depict the ICR located 5′ to human H19. Scale bar is shown. Angled parallel lines indicate discontinuities, with the distances being spanned in parentheses.
Figure 14.
Igf2 gene and locus in fish and human. Diagrams are shown for the tetraodon Igf2 locus, cave fish, and zebrafish Igf2b loci, nine other fish Igf2 loci, and the human IGF2–H19 locus. For Igf2 and IGF2, individual exons are depicted as boxes. Other genes are indicated as single boxes and include TH/Th, INS/Ins, H19, MRPL23/Mrlp23, and TNNT3/Tnnt3. A horizontal arrow shows the direction of transcription for each gene. Yellow ovals depict the ICR 5′ to human H19. Scale bar is shown.
Discussion
Igf2 genes in vertebrates
The goals of the studies presented here were to understand the organization and patterns of expression of Igf2 genes in nonmammalian vertebrates by mining the resources of public databases and to place these findings in an evolutionary context with mammalian IGF2/Igf2 homologues and the mammalian IGF2/Igf2-H19 locus. In mammals, IGF2 is involved principally in mediating prenatal growth (8), but it also functions in other aspects of physiology and pathophysiology throughout life (9–16). Mammalian IGF2/Igf2 genes are complicated and reside within a complex multigene locus (17, 18, 36, 56). In humans and in mice, multiple gene promoters (5 for human and 4 for mouse) control production of many different types of IGF2/Igf2 mRNAs that are translated and processed into a single mature 67-amino acid IGF2 (4, 32, 54). In both species, IGF2/Igf2 gene promoter activity is regulated by developmental and tissue-specific mechanisms that in turn are controlled by paternal chromosome-of-origin parental imprinting that is reciprocal to the expression of H19 (25, 26, 57, 58). Similar processes are presumably operative in other mammalian species, although they have not been characterized as fully as in mice and humans (36, 56).
The genomic and gene expression data identified and analyzed here show that Igf2 genes are far simpler in nonmammalian vertebrates than in mammals (Figs. 2 and 8) and that the locus also is simpler (Figs. 13 and 14). In most of the species described in this paper, the Igf2 gene is composed of 4 exons and 3 introns and likely has a single gene promoter, although this has not been established experimentally as yet. Exceptions include frog, in which there are 5 exons and evidence for alternative RNA splicing (Figs. 2 and 3 and Table 1), platyfish, which also has 5 exons (Fig. 8 and Table 3), and possibly Anole lizard and medaka, in which a homologue of exon 1 or exon 2, respectively, could not be identified (Figs. 2 and 8 and Tables 1 and 3). Moreover, in terrestrial vertebrates and in mammals, and in most of the fish species studied here, the Igf2/IGF2 gene is present in a single copy in the genome (22). The exceptions are zebrafish and cave fish, in which there are paralogous Igf2 genes termed Igf2a and Igf2b (Fig. 8 and Table 3). This latter finding reflects the fact that in a common ancestor of extant ray-finned fish, the entire genome was duplicated ∼320–350 Myr ago (59) and that this duplication was followed by re-diploidization in progenitors of many modern teleost lineages (59). However, in some species, such as zebrafish, a substantial fraction of duplicated genes has been retained (60). In both zebrafish and cave fish, the paralogous genes have diverged from one another, as amino acid identities between mature IGF2a and IGF2b are 76 and 84%, respectively, in the two species, and thus are less similar to each other than the corresponding IGF2b proteins are to tetraodon IGF2 (90 and 86%, Table 6). By these criteria, and by other similarities within the locus, it is clear that in both zebrafish and cave fish Igf2b represents the descendant of the original Igf2 locus.
Despite less complexity than in mammals, Igf2 genes in vertebrates share some common features with mammalian IGF2/Igf2. In all species studied here, except for platyfish (and medaka, which because of poor genomic sequence quality could not be evaluated), an intron splits the exons that encode the mature IGF2 protein at the identical location (these are the equivalents of exons 2 and 3 in nonmammalian vertebrates, exons 8 and 9 in human, and exons 6 and 7 in mice), interrupting these exons between the first and second nucleotides of serine codon 29 of mature IGF2 (3, 4). Conserved intron positioning also is found in Igf1 genes from mammals and nonmammalian vertebrates, as in all of these species a large intron interrupts exons encoding the mature IGF1 protein between the first and second nucleotides of codon 26 (49).
The Igf2 locus in nonmammalian vertebrates also is simpler than in mammals. There is no equivalent of the H19 gene, and no apparent ICR or distal enhancers, as mapped in mammals (57), although in the absence of a functional promoter, enhancers would be difficult to identify experimentally. However, several of the genes mapped to the locus in mammals also are found in terrestrial nonmammalian vertebrates in the same order and transcriptional orientation, including Th, Ins, Mrpl23, and Tnnt3 in terrestrial species (Fig. 13), and Th and Mrpl23 in most fish (Fig. 14). Collectively, these results suggest that the Igf2 locus is phylogenetically old, as it is found in vertebrates separated by over 500 Myr of evolutionary diversification.
Igf2 gene regulation in vertebrates
There is minimal published information on Igf2 gene expression in nonmammalian vertebrates, with studies being limited to a few analyses of chick embryos (61–64), turkeys (40), ducks (39), zebra finch (38), some observations in zebrafish and medaka embryos (47, 65), and measurements of transcripts in different organs, tissues, and cell types from zebrafish, tilapia (48, 66, 67), and a few other fish species (68, 69). The data presented here using queries of RNA-Seq libraries from the SRA NCBI repository extend previous analyses and show that Igf2 transcripts are produced in different adult tissues in a number of nonmammalian vertebrates (Figs. 3 and 9). However, mechanisms of gene regulation are unknown, and no Igf2 gene promoter has been functionally identified to date in any of these species. The situation is potentially different for Igf1, in which conserved putative transcription factor-binding sites have been mapped to positions analogous to those characterized experimentally in mammals (49)
In mammals, genetic, epigenetic, and environmental factors all contribute to somatic growth (70, 71), and also influence IGF2/Igf2 gene expression and protein production (9–12). For example, in humans, alterations in levels of IGF2 are associated with genetically determined overgrowth and undergrowth disorders, respectively, termed Beckwith-Wiedemann and Silver-Russell syndromes (11, 12). It is not known whether similar growth disorders connected with IGF2 occur in nonmammalian vertebrates. However, DNA polymorphisms have been identified in chickens within the Igf2 locus that sort with somatic growth and carcass weight (72, 73), and experimental selection for body size in zebrafish has been found to be associated with changes in expression of components of the insulin-like growth factor system, including alterations in levels of Igf2 transcripts (74).
IGF2 proteins in vertebrates
Mature IGF2 in most mammals is a 67-amino acid single-chain protein consisting of domains termed B, C, A, and D that are related to the analogous parts of IGF1 (4) and also resemble the B and A chains of mature insulin and the C chain of pro-insulin (7). In all terrestrial vertebrates examined here, mature IGF2 is 68 residues in length (Table 5), and the proteins are more similar to each other than are IGF2 proteins in fish, where IGF2 ranges from 66 residues (lamprey) to 71 residues (platyfish and Amazon molly), although in the majority of species it is 70 amino acids (Fig. 10C, Table 6). In terrestrial vertebrates, the A domains are nearly identical, with only a single amino acid alteration being found in lizard and frog, and B domains also are highly similar (just two differences in lizard and frog), whereas the C region is more divergent in reptiles and amphibians (Fig. 10A). In contrast, in fish, there are several amino acid changes in both A and B domains and more in the C region (Fig. 10B; exceptions are tetraodon and fugu IGF2, which are identical).
Some mammals, including humans, also express a 70-amino acid form of IGF2 that results from use of an alternative splice acceptor site that adds four codons instead of one to the equivalent of the 5′ end of human IGF2 exon 9, leading to an IGF2 with a longer C domain (15 residues instead of 12 (17)). This longer protein binds to the IGF1 receptor with lower affinity than the 67-residue human IGF2 (76). Although there does not appear to be alternative RNA processing in fish Igf2 genes, the IGF2 protein also has a 15-residue C domain (Fig. 10B). It would be of interest to learn whether a longer C region lowers the affinity of IGF2 for the IGF1 receptor in different fish species and to determine whether the modification of a shorter C domain generally enhances this ligand–receptor interaction in mammals.
Other features of IGF2 protein precursors are similar between nonmammalian vertebrates and mammals. In all species studied, the IGF2 progenitor contains a C-terminal extension or E peptide (Fig. 12) that is cleaved by a post-translational proteolytic processing step (4, 54). IGF1 precursors in both mammals and nonmammalian vertebrates also contain E peptides that are more divergent than other parts of the protein (49, 75), as is seen here with IGF2 (Fig. 12 and Tables 5 and 6). In many mammals (54) and in four of the terrestrial vertebrates analyzed here, Igf2 mRNAs encode two alternative signal peptides (Fig. 11C). One is of a typical length for secreted proteins, 23 amino acids in terrestrial vertebrates and 24 residues in many mammals (52–54), whereas the other is substantially longer, 53–62 amino acids in these four vertebrates (Fig. 11B and Table 5), and 80 residues in humans (18). In fish, the lone IGF2 signal sequence is of intermediate length, 36–53 amino acids, and in nearly all species it contains an internal in-frame methionine residue (Fig. 11). As there is no experimental evidence in any nonmammalian vertebrate addressing IGF2 biosynthesis, the methionine or signal peptide responsible for initiating protein translation is unknown.
Improving gene quality in genome databases
Publicly available genomic repositories contain extensive data on different genes from many animal species, yet as shown here, much of the information for Igf2 in vertebrates is incompletely or incorrectly annotated. This problem does not appear to be uncommon, as similar deficiencies have been shown for Igf1 in both mammals and nonmammalian vertebrates (49, 75). It is likely that other genes in these databases also are not described accurately, and it suggests that a concerted effort is needed to improve these data for the general benefit of the scientific community and to accelerate future discoveries. One way to accomplish this goal would be to query different RNA-Seq libraries for transcripts that map to portions of specific genes, as illustrated here for the potential 5′ and 3′ ends of Igf2 genes from a number of species, and for exon 1 and exon 1a in frog (Figs. 1, 3, and 5–7). A similar strategy also could be used to identify intron–exon and exon–intron junctions and to determine the relative prevalence of alternative RNA splicing (Fig. 3C).
Final comments
Conservation of components of the Igf2 gene and locus and the similarity of IGF2 among mammals and nonmammalian vertebrates suggest that an IGF2 was present in a common vertebrate ancestor (77, 78). Aspects of the biology of IGF2 have been maintained for ∼500 Myr of speciation, an idea that with further investigation may lead to new insights into the comparative biology of IGF2 regulation and actions.
Experimental procedures
Database searches and analyses
Vertebrate genomic databases were accessed within the Ensembl Genome Browser (http://www.ensembl.org/) and the UCSC Genome Browser (https://genome.ucsc.edu). 3 Igf2 cDNA sequences were extracted from the NCBI nucleotide data resource (chicken, XM_015286525; turkey, AY829236; duck, JQ819263; zebra finch, NM_001122966; frog, NM_001113672; cod, HQ263172; medaka, XM_023956176; tilapia, NM_001279643; zebrafish, NM_131433, BC085623; and AF194333 for Igf2a, and AF250289 for Igf2b). After the chicken Igf2 gene was fully mapped, genome database queries were performed with chicken Igf2 exons and adjacent DNA segments for terrestrial vertebrates (Gallus gallus, genome assembly Gallus_gallus-5.0), using BlastN under normal sensitivity (maximum e-value of 10; mismatch scores: 1,–3; gap penalties: opening 5, extension, 2; filtered low complexity regions, and repeat sequences masked). Genome assemblies from the following species were examined (Table 1): Anole lizard (Anolis carolinensis, AnoCar2.0); chicken (G. gallus, Gallus_gallus-5.0); Chinese softshell turtle (Pelodiscus sinensis, PelSin_1.0); duck (Anas platyrhynchos, BGI_duck_1.0); flycatcher (Ficedula albicollis, FicAlb_1.4); frog (Xenopus tropicalis, JGI 4.2); turkey (Meleagris gallopavo, Turkey_2.0.1); and zebra finch (Taeniopygia guttata, taeGut3.2.4). Similarly, for aquatic vertebrates, initial genome database queries were performed with chicken Igf2 or with zebrafish Igf2a and Igf2b gene segments (Danio rerio, genome assembly GRCz10) and then with tetraodon Igf2 exons (Tetraodon nigroviridis, genome assembly TETRAODON8), as these latter provided more complete recognition of different fish species. Genome assemblies from the following species were examined (Table 3): Amazon molly (Poecilia formosa, PoeFor_5.1.2); cave fish (Astyanax mexicanus, AstMex102); cod (Gadus morhua, gadMor1); coelacanth (Latimeria chalumnae, LatCha1); fugu (Takifugu rubripes, FUGU 4.0); lamprey (Petromyzon marinus, Pmarinus_7.0); medaka (Oryzias latipes, HdrR); platyfish (Xiphophorus maculatus, Xipmac4.4.2); spotted gar (Lepisosteus oculatus, LepOcu1); stickleback (Gasterosteus aculeatus, BROAD S1); tetraodon (T. nigroviridis, TETRAODON 8.0); tilapia (Oreochromis niloticus, Orenil1.0); and zebrafish (D. rerio, GRCz10). Data from the human IGF2 locus were obtained from GRCh38 (Homo sapiens). In all species, the highest scoring results mapped to components of the respective Igf2 gene. Amino acid sequences of proteins were obtained from GENCODE/Ensemble databases, the NCBI Consensus CDS Protein Set (https://www.ncbi.nlm.nih.gov/CCDS/), and the Uniprot browser (http://www.uniprot.org/); when not available, DNA sequences were translated with assistance of SerialCloner1.3 (e.g. long signal peptide for Chinese softshell turtle). Potential promoter sequences were examined using Promoter 2.0 (http://www.cbs.dtu.dk/services/Promoter/) (79), the UC Berkeley Neural Network Promoter prediction (http://www.fruitfly.org/seq_tools/promoter.html) (80), and CNNPromoter.3 Phylogenetic relationships among IGF2 proteins were defined using the MUSCLE 3.8.31 and PhyML 3.1/3.0 aLRT programs from Phylogeny.fr (http://www.phylogeny.fr/index.cgi) (81).3 In these analyses, the G-blocks program was employed to remove poorly conserved regions from further consideration. As a result, the first 2–5 amino acids from the N terminus of IGF2 and the C-region were eliminated during curation of the multiprotein alignments prior to construction of the phylogenetic tree (Fig. 10C). RNA-Seq information was extracted from the Sequence Read Archive of the National Center for Biotechnology Information (SRA NCBI; www.ncbi.nlm.nih.gov/sra) by querying the following datasets with different 60-bp fragments from the respective Igf2 genes: chicken, SRX3729588 (female liver), SRX2704299 (male kidney), SRX3566521 (male spleen), and SRX4038245 (male skeletal muscle); turkey: SRX570328 (pooled liver), SRX696650 (male spleen), and SRX696577 (male skeletal muscle from thigh); duck: SRX026110 (liver), SRX3475267 (male kidney), SRX849868 (male spleen), and SRX865197 (male skeletal muscle); zebra finch: SRX2334149 (spleen) and SRX1299467 (skeletal muscle); Anole lizard: SRX3436882 (liver), SRX191161 (kidney), and SRX191163 (skeletal muscle); frog: SRX2704323 (male liver), SRX2704322 (female liver), SRX191166 (kidney), and SRX191168 (skeletal muscle); cave fish: SRX2533243 (liver) and SRX1043997 (skeletal muscle); cod: SRX1044010 (liver) and SRX1044009 (skeletal muscle); coelacanth: DRX001730 (skeletal muscle); fugu: SRX4020085 (liver), SRX2413542 (slow skeletal muscle), and SRX2413433 (fast skeletal muscle); medaka: SRX661040 (liver) and SRX661039 (skeletal muscle); platyfish: SRX031881 (whole embryo); spotted gar: SRX661019 (liver), SRX661018 (skeletal muscle), and SRX661023 (whole embryo); stickleback: SRX2712198 (liver) and ERX1322263 (skeletal muscle); tetraodon: ERX1054374 (whole embryo at 30% epibody); tilapia: SRX1257756 (liver) and SRX790855 (skeletal muscle); and zebrafish: SRX3830285 (liver) and SRX2011208 (skeletal muscle). Results in text, tables, and figures are presented as percent identity over entire query regions, unless otherwise specified.
Experimental strategy
Naming conventions adopted here include the abbreviation “Igf2”' for all genes and mRNAs except for human, for which “IGF2” is used, and “IGF2” for all proteins. An initial assessment of nonmammalian vertebrate Igf2 loci, genes, and potential transcripts within Ensembl and UCSC genome browsers revealed that most genes were simpler than human IGF2 or mouse Igf2. However, very few gene assignments appeared to have taken into account available published experimental data. For example, in chicken Igf2, the two genomic databases showed three exons, but a comparison with an Igf2 cDNA from the NCBI nucleotide data resource (XM_015286525) suggested that an additional exon existed. Also, genome databases showed that tetraodon Igf2 consisted of 4 exons, with the first exon beginning with the ATG codon for the IGF2 precursor and the last exon ending with the TGA translational stop codon, clearly demonstrating that the gene had been incompletely defined. Thus, primary goals were to characterize all genes as completely as possible and then to interpret these more extensive datasets. An iterative process was developed that began with the exon assignments for all vertebrate Igf2 genes as defined in Ensembl and UCSC browsers. Depending on the species, these assignments were based on the different analytical approaches that had been used to characterize each specific genome (see Table S1). Next, the chicken Igf2 gene was characterized by a combination of steps that included mapping the gene with its cDNAs and assessing 5′ and 3′ ends by querying RNA-Seq libraries with presumptive exon fragments (Fig. 1). BlastN searches then were conducted against all other terrestrial vertebrate genome assemblies for homologous genomic regions using the chicken Igf2 gene fragments as queries. These latter results were mapped to each vertebrate Igf2 locus and were followed by secondary searches relying on cDNAs, gene components from other species, and RNA-Seq libraries. An analogous approach was used for fish Igf2 genes. BlastN searches were conducted against all 13 genome assemblies for homologous genomic regions using segments of chicken Igf2 and zebrafish Igf2a and Igf2b genes as queries. Because limited information was obtained, subsequent BlastN searches were performed using tetraodon Igf2 exons, after the 5′ and 3′ ends of the gene had been mapped using RNA-Seq files from SRA NCBI. Results of each series of genome searches then were mapped to each fish Igf2 locus and were followed by secondary searches relying on cDNAs or gene fragments from other fish species and tertiary mapping of potential 5′ and 3′ ends by screening RNA-Seq files from SRA NCBI. Through these steps, all vertebrate Igf2 genes were defined more completely in most species than had been annotated in either Ensembl or UCSC genome browsers.
Author contributions
P. R. conceptualization; P. R. resources; P. R. data curation; P. R. formal analysis; P. R. funding acquisition; P. R. validation; P. R. investigation; P. R. visualization; P. R. methodology; P. R. writing-original draft; P. R. writing-review and editing.
Supplementary Material
This work was supported by National Institutes of Health Research Grant R01 DK042748-28 (to P. R.). The author declares that he has no conflicts of interest with the contents of this article. The content is solely the responsibility of the author and does not necessarily represent the official views of the National Institutes of Health.
This article contains Fig. S1 and Table S1.
Please note that the JBC is not responsible for the long-term archiving and maintenance of this site or any other third party hosted site.
- CTCF
- CCTC-binding factor
- UTR
- untranslated region
- NCBI
- National Center for Biotechnology Information
- SRA
- Sequence Read Archive
- ICR
- imprinting control region
- Myr
- million years.
References
- 1. Daughaday W. H., Kapadia M., Yanow C. E., Fabrick K., and Mariz I. K. (1985) Insulin-like growth factors I and II of nonmammalian sera. Gen. Comp. Endocrinol. 59, 316–325 10.1016/0016-6480(85)90384-3 [DOI] [PubMed] [Google Scholar]
- 2. Daughaday W. H., and Rotwein P. (1989) Insulin-like growth factors I and II. Peptide, messenger ribonucleic acid and gene structures, serum, and tissue concentrations. Endocr. Rev. 10, 68–91 10.1210/edrv-10-1-68 [DOI] [PubMed] [Google Scholar]
- 3. Sussenbach J. S., Steenbergh P. H., and Holthuizen P. (1992) Structure and expression of the human insulin-like growth factor genes. Growth Regul. 2, 1–9 [PubMed] [Google Scholar]
- 4. Rotwein P. (1999) in The IGF System (Rosenfeld R. G., and Roberts C. T. Jr., eds) pp. 19–35, Humana Press Inc., Totowa, NJ [Google Scholar]
- 5. Das R., and Dobens L. L. (2015) Conservation of gene and tissue networks regulating insulin signalling in flies and vertebrates. Biochem. Soc. Trans. 43, 1057–1062 10.1042/BST20150078 [DOI] [PubMed] [Google Scholar]
- 6. Schwartz T. S., and Bronikowski A. M. (2016) Evolution and function of the insulin and insulin-like signaling network in ectothermic reptiles: some answers and more questions. Integr. Comp. Biol. 56, 171–184 10.1093/icb/icw046 [DOI] [PubMed] [Google Scholar]
- 7. Blundell T. L., and Humbel R. E. (1980) Hormone families: pancreatic hormones and homologous growth factors. Nature 287, 781–787 10.1038/287781a0 [DOI] [PubMed] [Google Scholar]
- 8. Kadakia R., and Josefson J. (2016) The relationship of insulin-like growth factor 2 to fetal growth and adiposity. Horm. Res. Paediatr. 85, 75–82 10.1159/000443500 [DOI] [PubMed] [Google Scholar]
- 9. Markljung E., Jiang L., Jaffe J. D., Mikkelsen T. S., Wallerman O., Larhammar M., Zhang X., Wang L., Saenz-Vash V., Gnirke A., Lindroth A. M., Barrés R., Yan J., Strömberg S., De S., et al. (2009) ZBED6, a novel transcription factor derived from a domesticated DNA transposon regulates IGF2 expression and muscle growth. PLoS Biol. 7, e1000256 10.1371/journal.pbio.1000256 [DOI] [PMC free article] [PubMed] [Google Scholar]
- 10. Butter F., Kappei D., Buchholz F., Vermeulen M., and Mann M. (2010) A domesticated transposon mediates the effects of a single-nucleotide polymorphism responsible for enhanced muscle growth. EMBO Rep. 11, 305–311 10.1038/embor.2010.6 [DOI] [PMC free article] [PubMed] [Google Scholar]
- 11. Eggermann T., Begemann M., Spengler S., Schröder C., Kordass U., and Binder G. (2010) Genetic and epigenetic findings in Silver-Russell syndrome. Pediatr. Endocrinol. Rev. 8, 86–93 [PubMed] [Google Scholar]
- 12. Azzi S., Abi Habib W., and Netchine I. (2014) Beckwith-Wiedemann and Russell-Silver Syndromes: from new molecular insights to the comprehension of imprinting regulation. Curr. Opin. Endocrinol. Diabetes Obes. 21, 30–38 10.1097/MED.0000000000000037 [DOI] [PubMed] [Google Scholar]
- 13. Pollak M. (2012) The insulin and insulin-like growth factor receptor family in neoplasia: an update. Nat. Rev. Cancer 12, 159–169 10.1038/nrc3215 [DOI] [PubMed] [Google Scholar]
- 14. Gems D., and Partridge L. (2013) Genetics of longevity in model organisms: debates and paradigm shifts. Annu. Rev. Physiol. 75, 621–644 10.1146/annurev-physiol-030212-183712 [DOI] [PubMed] [Google Scholar]
- 15. Livingstone C. (2013) IGF2 and cancer. Endocr. Relat. Cancer 20, R321–R39 10.1530/ERC-13-0231 [DOI] [PubMed] [Google Scholar]
- 16. Livingstone C., and Borai A. (2014) Insulin-like growth factor-II: its role in metabolic and endocrine disease. Clin. Endocrinol. 80, 773–781 10.1111/cen.12446 [DOI] [PubMed] [Google Scholar]
- 17. Rotwein P. (2018) The complex genetics of human insulin-like growth factor 2 are not reflected in public databases. J. Biol. Chem. 293, 4324–4333 10.1074/jbc.RA117.001573 [DOI] [PMC free article] [PubMed] [Google Scholar]
- 18. Rotwein P. (2018) Similarity and variation in the insulin-like growth factor 2–H19 locus in primates. Physiol. Genomics 50, 425–439 10.1152/physiolgenomics.00030.2018 [DOI] [PMC free article] [PubMed] [Google Scholar]
- 19. DeChiara T. M., Robertson E. J., and Efstratiadis A. (1991) Parental imprinting of the mouse insulin-like growth factor II gene. Cell 64, 849–859 10.1016/0092-8674(91)90513-X [DOI] [PubMed] [Google Scholar]
- 20. Leighton P. A., Ingram R. S., Eggenschwiler J., Efstratiadis A., and Tilghman S. M. (1995) Disruption of imprinting caused by deletion of the H19 gene region in mice. Nature 375, 34–39 10.1038/375034a0 [DOI] [PubMed] [Google Scholar]
- 21. Monk D., Sanches R., Arnaud P., Apostolidou S., Hills F. A., Abu-Amero S., Murrell A., Friess H., Reik W., Stanier P., Constância M., and Moore G. E. (2006) Imprinting of IGF2 P0 transcript and novel alternatively spliced INS-IGF2 isoforms show differences between mouse and human. Hum. Mol. Genet. 15, 1259–1269 10.1093/hmg/ddl041 [DOI] [PubMed] [Google Scholar]
- 22. Nordin M., Bergman D., Halje M., Engström W., and Ward A. (2014) Epigenetic regulation of the Igf2/H19 gene cluster. Cell Prolif 47, 189–199 10.1111/cpr.12106 [DOI] [PMC free article] [PubMed] [Google Scholar]
- 23. Hark A. T., Schoenherr C. J., Katz D. J., Ingram R. S., Levorse J. M., and Tilghman S. M. (2000) CTCF mediates methylation-sensitive enhancer-blocking activity at the H19/Igf2 locus. Nature 405, 486–489 10.1038/35013106 [DOI] [PubMed] [Google Scholar]
- 24. Edwards C. A., and Ferguson-Smith A. C. (2007) Mechanisms regulating imprinted genes in clusters. Curr. Opin. Cell Biol. 19, 281–289 10.1016/j.ceb.2007.04.013 [DOI] [PubMed] [Google Scholar]
- 25. Wallace J. A., and Felsenfeld G. (2007) We gather together: insulators and genome organization. Curr. Opin. Genet. Dev. 17, 400–407 10.1016/j.gde.2007.08.005 [DOI] [PMC free article] [PubMed] [Google Scholar]
- 26. Phillips J. E., and Corces V. G. (2009) CTCF: master weaver of the genome. Cell 137, 1194–1211 10.1016/j.cell.2009.06.001 [DOI] [PMC free article] [PubMed] [Google Scholar]
- 27. Giannoukakis N., Deal C., Paquette J., Goodyer C. G., and Polychronakos C. (1993) Parental genomic imprinting of the human IGF2 gene. Nat. Genet. 4, 98–101 10.1038/ng0593-98 [DOI] [PubMed] [Google Scholar]
- 28. Acuna-Hidalgo R., Veltman J. A., and Hoischen A. (2016) New insights into the generation and role of de novo mutations in health and disease. Genome Biol. 17, 241–260 10.1186/s13059-016-1110-1 [DOI] [PMC free article] [PubMed] [Google Scholar]
- 29. Katsanis N. (2016) The continuum of causality in human genetic disorders. Genome Biol. 17, 233–237 10.1186/s13059-016-1107-9 [DOI] [PMC free article] [PubMed] [Google Scholar]
- 30. Quintana-Murci L. (2016) Understanding rare and common diseases in the context of human evolution. Genome Biol. 17, 225–239 10.1186/s13059-016-1093-y [DOI] [PMC free article] [PubMed] [Google Scholar]
- 31. Manolio T. A., Fowler D. M., Starita L. M., Haendel M. A., MacArthur D. G., Biesecker L. G., Worthey E., Chisholm R. L., Green E. D., Jacob H. J., McLeod H. L., Roden D., Rodriguez L. L., Williams M. S., Cooper G. M., et al. (2017) Bedside back to bench: building bridges between basic and clinical genomic research. Cell 169, 6–12 10.1016/j.cell.2017.03.005 [DOI] [PMC free article] [PubMed] [Google Scholar]
- 32. Sussenbach J. S., Rodenburg R. J., Scheper W., and Holthuizen P. (1993) Transcriptional and post-transcriptional regulation of the human IGF-II gene expression. Adv. Exp. Med. Biol. 343, 63–71 [DOI] [PubMed] [Google Scholar]
- 33. Rotwein P., and Hall L. J. (1990) Evolution of insulin-like growth factor II: characterization of the mouse IGF-II gene and identification of two pseudo-exons. DNA Cell Biol. 9, 725–735 10.1089/dna.1990.9.725 [DOI] [PubMed] [Google Scholar]
- 34. Moore T., Constancia M., Zubair M., Bailleul B., Feil R., Sasaki H., and Reik W. (1997) Multiple imprinted sense and antisense transcripts, differential methylation and tandem repeats in a putative imprinting control region upstream of mouse Igf2. Proc. Natl. Acad. Sci. U.S.A. 94, 12509–12514 10.1073/pnas.94.23.12509 [DOI] [PMC free article] [PubMed] [Google Scholar]
- 35. Constância M., Hemberger M., Hughes J., Dean W., Ferguson-Smith A., Fundele R., Stewart F., Kelsey G., Fowden A., Sibley C., and Reik W. (2002) Placental-specific IGF-II is a major modulator of placental and fetal growth. Nature 417, 945–948 10.1038/nature00819 [DOI] [PubMed] [Google Scholar]
- 36. Smits G., Mungall A. J., Griffiths-Jones S., Smith P., Beury D., Matthews L., Rogers J., Pask A. J., Shaw G., VandeBerg J. L., McCarrey J. R., SAVOIR Consortium, Renfree M. B., Reik W., and Dunham I. (2008) Conservation of the H19 noncoding RNA and H19-IGF2 imprinting mechanism in therians. Nat. Genet. 40, 971–976 10.1038/ng.168 [DOI] [PubMed] [Google Scholar]
- 37. Darling D. C., and Brickell P. M. (1996) Nucleotide sequence and genomic structure of the chicken insulin-like growth factor-II (IGF-II) coding region. Gen. Comp. Endocrinol. 102, 283–287 10.1006/gcen.1996.0071 [DOI] [PubMed] [Google Scholar]
- 38. Holzenberger M., Jarvis E. D., Chong C., Grossman M., Nottebohm F., and Scharff C. (1997) Selective expression of insulin-like growth factor II in the songbird brain. J. Neurosci. 17, 6974–6987 10.1523/JNEUROSCI.17-18-06974.1997 [DOI] [PMC free article] [PubMed] [Google Scholar]
- 39. Song C. L., Liu H. H., Kou J., Lv L., Li L., Wang W. X., and Wang J. W. (2013) Expression profile of insulin-like growth factor system genes in muscle tissues during the postnatal development growth stage in ducks. Genet. Mol. Res. 12, 4500–4514 10.4238/2013.May.6.3 [DOI] [PubMed] [Google Scholar]
- 40. Richards M. P., Poch S. M., and McMurtry J. P. (2005) Expression of insulin-like growth factor system genes in liver and brain tissue during embryonic and post-hatch development of the turkey. Comp. Biochem. Physiol. A Mol. Integr. Physiol. 141, 76–86 10.1016/j.cbpb.2005.04.006 [DOI] [PubMed] [Google Scholar]
- 41. Cazzola M., and Skoda R. C. (2000) Translational pathophysiology: a novel molecular mechanism of human disease. Blood 95, 3280–3288 [PubMed] [Google Scholar]
- 42. Kozak M. (2000) Do the 5′untranslated domains of human cDNAs challenge the rules for initiation of translation (or is it vice versa). Genomics 70, 396–406 10.1006/geno.2000.6412 [DOI] [PubMed] [Google Scholar]
- 43. Gill G. (1994) Transcriptional initiation. Taking the initiative. Curr. Biol. 4, 374–376 10.1016/S0960-9822(00)00084-1 [DOI] [PubMed] [Google Scholar]
- 44. Albright S. R., and Tjian R. (2000) TAFs revisited: more data reveal new twists and confirm old ideas. Gene 242, 1–13 10.1016/S0378-1119(99)00495-3 [DOI] [PubMed] [Google Scholar]
- 45. Sheets M. D., Ogg S. C., and Wickens M. P. (1990) Point mutations in AAUAAA and the poly(A) addition site: effects on the accuracy and efficiency of cleavage and polyadenylation in vitro. Nucleic Acids Res. 18, 5799–5805 10.1093/nar/18.19.5799 [DOI] [PMC free article] [PubMed] [Google Scholar]
- 46. Proudfoot N. J. (2011) Ending the message: poly(A) signals then and now. Genes Dev. 25, 1770–1782 10.1101/gad.17268411 [DOI] [PMC free article] [PubMed] [Google Scholar]
- 47. White Y. A., Kyle J. T., and Wood A. W. (2009) Targeted gene knockdown in zebrafish reveals distinct intraembryonic functions for insulin-like growth factor II signaling. Endocrinology 150, 4366–4375 10.1210/en.2009-0356 [DOI] [PubMed] [Google Scholar]
- 48. Nornberg B. F., Figueiredo M. A., and Marins L. F. (2016) Expression profile of IGF paralog genes in liver and muscle of a GH-transgenic zebrafish. Gen. Comp. Endocrinol. 226, 36–41 10.1016/j.ygcen.2015.12.017 [DOI] [PubMed] [Google Scholar]
- 49. Rotwein P. (2018) Insulin-like growth factor 1 gene variation in vertebrates. Endocrinology 159, 2288–2305 10.1210/en.2018-00259 [DOI] [PMC free article] [PubMed] [Google Scholar]
- 50. Hawkins J. D. (1988) A survey on intron and exon lengths. Nucleic Acids Res. 16, 9893–9908 10.1093/nar/16.21.9893 [DOI] [PMC free article] [PubMed] [Google Scholar]
- 51. Fedorova L., and Fedorov A. (2003) Introns in gene evolution. Genetica 118, 123–131 10.1023/A:1024145407467 [DOI] [PubMed] [Google Scholar]
- 52. von Heijne G. (1985) Signal sequences. The limits of variation. J. Mol. Biol. 184, 99–105 10.1016/0022-2836(85)90046-4 [DOI] [PubMed] [Google Scholar]
- 53. von Heijne G. (1990) The signal peptide. J. Membr. Biol. 115, 195–201 10.1007/BF01868635 [DOI] [PubMed] [Google Scholar]
- 54. Wallis M. (2009) New insulin-like growth factor (IGF)-precursor sequences from mammalian genomes: the molecular evolution of IGFs and associated peptides in primates. Growth Horm. IGF Res. 19, 12–23 10.1016/j.ghir.2008.05.001 [DOI] [PubMed] [Google Scholar]
- 55. Yoo-Warren H., Pachnis V., Ingram R. S., and Tilghman S. M. (1988) Two regulatory domains flank the mouse H19 gene. Mol. Cell. Biol. 8, 4707–4715 10.1128/MCB.8.11.4707 [DOI] [PMC free article] [PubMed] [Google Scholar]
- 56. Bartolomei M. S., Vigneau S., and O'Neill M. J. (2008) H19 in the pouch. Nat. Genet. 40, 932–933 10.1038/ng0808-932 [DOI] [PubMed] [Google Scholar]
- 57. Ishihara K., Hatano N., Furuumi H., Kato R., Iwaki T., Miura K., Jinno Y., and Sasaki H. (2000) Comparative genomic sequencing identifies novel tissue-specific enhancers and sequence elements for methylation-sensitive factors implicated in Igf2/H19 imprinting. Genome Res. 10, 664–671 10.1101/gr.10.5.664 [DOI] [PMC free article] [PubMed] [Google Scholar]
- 58. Sparago A., Cerrato F., Vernucci M., Ferrero G. B., Silengo M. C., and Riccio A. (2004) Microdeletions in the human H19 DMR result in loss of IGF2 imprinting and Beckwith-Wiedemann syndrome. Nat. Genet. 36, 958–960 10.1038/ng1410 [DOI] [PubMed] [Google Scholar]
- 59. Glasauer S. M., and Neuhauss S. C. (2014) Whole-genome duplication in teleost fishes and its evolutionary consequences. Mol. Genet. Genomics 289, 1045–1060 10.1007/s00438-014-0889-2 [DOI] [PubMed] [Google Scholar]
- 60. Woods I. G., Wilson C., Friedlander B., Chang P., Reyes D. K., Nix R., Kelly P. D., Chu F., Postlethwait J. H., and Talbot W. S. (2005) The zebrafish gene map defines ancestral vertebrate chromosomes. Genome Res. 15, 1307–1314 10.1101/gr.4134305 [DOI] [PMC free article] [PubMed] [Google Scholar]
- 61. Koski L. B., Sasaki E., Roberts R. D., Gibson J., and Etches R. J. (2000) Monoalleleic transcription of the insulin-like growth factor-II gene (Igf2) in chick embryos. Mol. Reprod. Dev. 56, 345–352 10.1002/1098-2795(200007)56:3%3C345::AID-MRD3%3E3.0.CO%3B2-1 [DOI] [PubMed] [Google Scholar]
- 62. O'Neill M. J., Ingram R. S., Vrana P. B., and Tilghman S. M. (2000) Allelic expression of IGF2 in marsupials and birds. Dev. Genes Evol. 210, 18–20 10.1007/PL00008182 [DOI] [PubMed] [Google Scholar]
- 63. Yokomine T., Kuroiwa A., Tanaka K., Tsudzuki M., Matsuda Y., and Sasaki H. (2001) Sequence polymorphisms, allelic expression status and chromosome locations of the chicken IGF2 and MPR1 genes. Cytogenet. Cell Genet. 93, 109–113 10.1159/000056960 [DOI] [PubMed] [Google Scholar]
- 64. Nolan C. M., Killian J. K., Petitte J. N., and Jirtle R. L. (2001) Imprint status of M6P/IGF2R and IGF2 in chickens. Dev. Genes Evol. 211, 179–183 10.1007/s004270000132 [DOI] [PubMed] [Google Scholar]
- 65. Yuan Y., and Hong Y. (2017) Medaka insulin-like growth factor-2 supports self-renewal of the embryonic stem cell line and blastomeres in vitro. Sci. Rep. 7, 78 10.1038/s41598-017-00094-y [DOI] [PMC free article] [PubMed] [Google Scholar]
- 66. Huang Y., Harrison M. R., Osorio A., Kim J., Baugh A., Duan C., Sucov H. M., and Lien C. L. (2013) Igf signaling is required for cardiomyocyte proliferation during zebrafish heart development and regeneration. PLoS ONE 8, e67266 10.1371/journal.pone.0067266 [DOI] [PMC free article] [PubMed] [Google Scholar]
- 67. Pierce A. L., Breves J. P., Moriyama S., Hirano T., and Grau E. G. (2011) Differential regulation of Igf1 and Igf2 mRNA levels in tilapia hepatocytes: effects of insulin and cortisol on GH sensitivity. J. Endocrinol. 211, 201–210 10.1530/JOE-10-0456 [DOI] [PubMed] [Google Scholar]
- 68. Schrader M., and Travis J. (2012) Embryonic IGF2 expression is not associated with offspring size among populations of a placental fish. PLoS ONE 7, e45463 10.1371/journal.pone.0045463 [DOI] [PMC free article] [PubMed] [Google Scholar]
- 69. Pierce A. L., Dickey J. T., Felli L., Swanson P., and Dickhoff W. W. (2010) Metabolic hormones regulate basal and growth hormone-dependent igf2 mRNA level in primary cultured coho salmon hepatocytes: effects of insulin, glucagon, dexamethasone, and triiodothyronine. J. Endocrinol. 204, 331–339 [DOI] [PubMed] [Google Scholar]
- 70. Baron J., Sävendahl L., De Luca F., Dauber A., Phillip M., Wit J. M., and Nilsson O. (2015) Short and tall stature: a new paradigm emerges. Nat. Rev. Endocrinol. 11, 735–746 10.1038/nrendo.2015.165 [DOI] [PMC free article] [PubMed] [Google Scholar]
- 71. Marouli E., Graff M., Medina-Gomez C., Lo K. S., Wood A. R., Kjaer T. R., Fine R. S., Lu Y., Schurmann C., Highland H. M., Rüeger S., Thorleifsson G., Justice A. E., Lamparter D., Stirrups K. E., et al. (2017) Rare and low-frequency coding variants alter human adult height. Nature 542, 186–190 10.1038/nature21039 [DOI] [PMC free article] [PubMed] [Google Scholar]
- 72. Tang S., Sun D., Ou J., Zhang Y., Xu G., and Zhang Y. (2010) Evaluation of the IGFs (IGF1 and IGF2) genes as candidates for growth, body measurement, carcass, and reproduction traits in Beijing You and Silkie chickens. Anim. Biotechnol. 21, 104–113 10.1080/10495390903328090 [DOI] [PubMed] [Google Scholar]
- 73. Gholami M., Erbe M., Gärke C., Preisinger R., Weigend A., Weigend S., and Simianer H. (2014) Population genomic analyses based on 1 million SNPs in commercial egg layers. PLoS ONE 9, e94509 10.1371/journal.pone.0094509 [DOI] [PMC free article] [PubMed] [Google Scholar]
- 74. Amaral I. P., and Johnston I. A. (2012) Experimental selection for body size at age modifies early life-history traits and muscle gene expression in adult zebrafish. J. Exp. Biol. 215, 3895–3904 10.1242/jeb.068908 [DOI] [PubMed] [Google Scholar]
- 75. Rotwein P. (2017) Diversification of the insulin-like growth factor 1 gene in mammals. PLoS ONE 12, e0189642 10.1371/journal.pone.0189642 [DOI] [PMC free article] [PubMed] [Google Scholar]
- 76. Hampton B., Burgess W. H., Marshak D. R., Cullen K. J., and Perdue J. F. (1989) Purification and characterization of an insulin-like growth factor II variant from human plasma. J. Biol. Chem. 264, 19155–19160 [PubMed] [Google Scholar]
- 77. Venditti C., and Pagel M. (2010) Speciation as an active force in promoting genetic evolution. Trends Ecol. Evol. 25, 14–20 10.1016/j.tree.2009.06.010 [DOI] [PubMed] [Google Scholar]
- 78. Venditti C., Meade A., and Pagel M. (2011) Multiple routes to mammalian diversity. Nature 479, 393–396 10.1038/nature10516 [DOI] [PubMed] [Google Scholar]
- 79. Knudsen S. (1999) Promoter 2.0: For the recognition of PolII promoter sequences. Bioinformatics 15, 356–361 [DOI] [PubMed] [Google Scholar]
- 80. Reese M. G. (2001) Application of a time-delay neural network to promoter annotation in the Drosophila melanogaster genome. Comput. Chem. 26, 51–56 [DOI] [PubMed] [Google Scholar]
- 81. Dereeper A., Guignon V., Blanc G., Audic S., Buffet S., Chevenet F., Dufayard J. F., Guindon S., Lefort V., Lescot M., Claverie J. M., and Gascuel O. (2008) Phylogeny.fr: robust phylogenetic analysis for the non-specialist. Nucleic Acids Res. 36, W465–W469 10.1093/nar/gkn180 [DOI] [PMC free article] [PubMed] [Google Scholar]
Associated Data
This section collects any data citations, data availability statements, or supplementary materials included in this article.


