

Abstract
T cells generate adaptive immune responses mediated by the T cell receptor (TCR)–CD3 complex comprising an αβ TCR heterodimer noncovalently associated with three CD3 dimers. In early T cell activation, αβ TCR engagement by peptide–major histocompatibility complex (pMHC) is first communicated to the CD3 signaling apparatus of the TCR–CD3 complex, but the underlying mechanism is incompletely understood. It is possible that pMHC binding induces allosteric changes in TCR conformation or dynamics that are then relayed to CD3. Here, we carried out NMR analysis and molecular dynamics (MD) simulations of both the α and β chains of a human antiviral TCR (A6) that recognizes the Tax antigen from human T cell lymphotropic virus-1 bound to the MHC class I molecule HLA-A2. We observed pMHC-induced NMR signal perturbations in the TCR variable (V) domains that propagated to three distinct sites in the constant (C) domains: 1) the Cβ FG loop projecting from the Vβ/Cβ interface; 2) a cluster of Cβ residues near the Cβ αA helix, a region involved in interactions with CD3; and 3) the Cα AB loop at the membrane-proximal base of the TCR. A biological role for each of these allosteric sites is supported by previous mutational and functional studies of TCR signaling. Moreover, the pattern of long-range, ligand-induced changes in TCR A6 revealed by NMR was broadly similar to that predicted by the MD simulations. We propose that the unique structure of the TCR β chain enables allosteric communication between the TCR-binding sites for pMHC and CD3.
Keywords: T cell receptor (TCR), major histocompatibility complex (MHC), allosteric regulation, nuclear magnetic resonance (NMR), molecular dynamics, adaptive immunity, conformational change, T cell activation, signaling
Introduction
T cells play a major role in generating adaptive immune responses to microbes and cancers. This process is mediated by the T cell receptor (TCR) 4–CD3 complex, which is composed of a genetically diverse αβ (or γδ) TCR heterodimer in noncovalent association with three invariant CD3 dimers: CD3ϵγ, CD3ϵδ, and CD3ζζ (1, 2). The TCR mediates recognition of peptide fragments bound to major histocompatibility complex (MHC) molecules on antigen-presenting cells (APCs). These peptides are generated by proteolytic degradation of foreign or self-proteins within cells expressing MHC class I or II molecules (3). Following TCR binding to peptide–MHC (pMHC) ligands, the CD3 molecules transmit activation signals to the T cell. X-ray crystallographic studies of TCR–pMHC complexes have revealed the molecular basis for TCR recognition of foreign and self-antigens (4–8). In addition, much is known about the downstream T cell–signaling cascade, following phosphorylation of immunoreceptor tyrosine-based activation motifs (ITAMs) of CD3 subunits by the Src kinase Lck associated with CD4 or CD8 (9). These ITAMs, which are located at the cytoplasmic face of the TCR–CD3 complex, undergo dissociation from the lipid bilayer upon TCR engagement of pMHC, rendering them accessible to Lck (10–12). However, the mechanism(s) by which TCR ligation is first communicated to the CD3 signaling apparatus, a process termed early T cell activation, remains largely a mystery (13–15).
A variety of models have been proposed to explain early T cell activation. However, all these models invoke one or more of the following four basic mechanisms: aggregation, segregation, mechanotransduction, and/or conformational change (13, 15). Aggregation of TCR–CD3 complexes following TCR engagement could lead to enhanced phosphorylation of CD3 ITAMs by increasing the proximity of associated Lck (13). Binding-induced segregation of TCR–CD3 complexes away from the inhibitory phosphatase CD45 has also been proposed to explain TCR triggering (16). According to the mechanotransduction model, the TCR converts mechanical energy derived from T cell scanning of APCs into a biochemical signal upon specific pMHC ligation (17).
Other models invoke ligand-induced conformational changes at sites distant from the pMHC-binding site (allostery) as a mechanism for TCR triggering (12, 14). A special attraction of allosteric models is that they can account for triggering at low densities of pMHC agonists on APCs. In particular, findings that T cell signaling begins before formation of the immunological synapse (14, 18) and that a single pMHC suffices for early T cell activation (19–21) suggest that triggering must be intrinsic to the interaction of TCR–CD3 with pMHC. However, X-ray crystallographic studies of TCRs in free and pMHC-bound forms have so far failed to identify consistent conformational changes in the TCR Cα or Cβ domains that could be unambiguously attributed to antigen binding (8). One possibility is that such ligand-induced, long-range conformational changes simply do not occur and that TCR triggering is mediated by other mechanisms. However, another possibility is that the relevant changes may be in protein dynamics, a parameter that cannot be accessed via the static snapshots provided by crystallography. Indeed, recent studies in several systems have demonstrated that ligand binding can alter protein flexibility at distant sites, resulting in long-range transmission of biological signals, even in the absence of crystallographically observed structural changes (22–27). This process, known as dynamic allostery, provides a unifying mechanism for the general phenomenon of allostery (23, 24, 27).
Initial evidence for dynamically driven TCR signaling was obtained by hydrogen/deuterium (H/D) exchange, which showed that pMHC binding globally rigidified the TCR (28). More recently, NMR characterization of the β chain of a mouse TCR (B4.2.3) specific for an HIV-1 gp120-derived peptide bound to a mouse MHC class I molecule (H2-Dd) revealed amide resonance changes in Cβ upon pMHC ligation (29). Some of these changes were near constant β domain (Cβ) residues previously implicated by NMR to interact with CD3 (30, 31). Here, we report NMR characterization and molecular dynamics (MD) simulations of both the α and β chains of a human antiviral TCR (A6) that recognizes the Tax antigen (LLFGYPVYV) from human T cell lymphotropic virus-1 (HTLV-1) bound to the human MHC class I molecule HLA-A2 (32).
Results
NMR assignment of TCR A6[α-2H/13C/15N]β and A6α[β-2H/13C/15N]
We utilized the antiviral TCR A6 as a representative example of a human MHC class I-restricted TCR. Crystal structures for both the unbound and pMHC-bound states of the A6 ectodomain are known (32–34), and therefore the binding epitope is well-established and can be reliably compared with results from solution NMR experiments. Moreover, A6 binds Tax–HLA-A2 relatively tightly with a dissociation constant (KD) of ∼1 μm (33). The TCR A6 ectodomain is an ∼50-kDa heterodimer consisting of a 204-residue α chain and a 245-residue β chain. We prepared samples with the following labeling patterns, A6[α-2H/13C/15N]β and A6α[β-2H/13C/15N], and we used transverse relaxation optimized (TROSY)-based triple resonance experiments to assign HN, N, Cα, Cβ, and CO NMR signals in each chain. Backbone amide assignments were obtained for 78% of the nonproline residues in the β chain, accounting for 91% (178/196) of detectable amide peaks (Fig. 1, A and B). For the α chain, backbone amide assignments were determined for 63% of the nonproline residues, corresponding to 74% (122/165) of the detected amide signals (Fig. 2, A and B). In both the α and β chains, unassigned amides were mostly due to either missing amide signals in the 2D 1H-15N TROSY–HSQC spectrum or present amide signals but with weak or nonexistent carbon correlations in triple resonance data. In a small number of cases, amide peaks had isolated carbon correlations that could not be linked to assigned regions unambiguously. The TCR A6 assignments for the α and β chains have been deposited in the Biological Magnetic Resonance Bank (BMRB accession codes 27440 and 27441, respectively).
Figure 1.

NMR assignment of the TCR ectodomain A6α[β-2H,13C,15N]. A, extent of backbone assignments for the TCR A6 β chain mapped onto the A6 X-ray structure (PDB accession code 3QH3) (34). Assigned regions of the β chain are shown in wheat; unassigned regions including prolines are shown in gray; and the α chain is in green ribbon format. B, two-dimensional 1H-15N TROSY–HSQC spectrum of A6α[β-2H,13C,15N] with backbone amide assignments. C, TCR A6 β chain secondary structure and dynamics from chemical shift data. Hypervariable regions are highlighted (light red). Top panel, secondary structure elements from chemical shift analysis. Confidence levels from TALOS-N (35) are plotted versus residue number for β-strands (black) and α-helices (gray). Center panel, chemical shift derived order parameters (S2) from TALOS-N. Bottom panel, crystallographic temperature (B) factors for the Cα atoms in the TCR A6 β chain, obtained using PDB 3QH3.
Figure 2.

NMR assignment of the TCR ectodomain A6[α-2H,13C,15N]β. A, extent of backbone assignments for the TCR A6 α chain mapped onto the A6 X-ray structure (3QH3) (34). Assigned regions of the α chain are shown in green; unassigned regions including prolines are shown in gray; and the β chain is in wheat ribbon format. B, two-dimensional 1H-15N TROSY–HSQC spectrum of A6[α-2H,13C,15N]β with backbone amide assignments. C, TCR A6 α chain secondary structure and dynamics from chemical shift data. Hypervariable regions are highlighted (light red). Top panel, secondary structure elements from chemical shift analysis. Confidence levels from TALOS-N (35) are plotted versus residue number for β-strands (black). Center panel, chemical shift derived order parameters (S2) from TALOS-N. Bottom panel, crystallographic temperature (B) factors for Cα atoms in the TCR A6 α chain, obtained using PDB 3QH3.
TCR A6 conformation and dynamics in solution
Assigned backbone carbon chemical shifts (Cα, Cβ, and CO) were used to determine the secondary structure elements in solution for TCR A6 α and β chains (Figs. 1C and 2C, upper panel) (35), and these were compared with the structural features obtained from X-ray crystallography (34). In the A6 β chain, 16 of the 18 β-strands observed in the crystal structure and the two α helices in Cβ, αA and αB, are identified by chemical shift analysis. Two β-strands in the crystal structure, strand C′ in the variable β domain (Vβ) and strand D in Cβ, are not recognized as β-strands by NMR. This is most likely due to the absence of sufficient unambiguous assignments, although strand D is also not identified by NMR in another human TCR (MS2-3C8) where more assignments were made in this region (30). Furthermore, the two short αA and αB helical regions in Cβ are not recognized as helices by NMR. For the A6 α chain, 14 of the 16 β-strands in the crystal structure are also recognized as β-strands by NMR chemical shift analysis. Two secondary structural elements in particular, strand E and helix αA near the C terminus of the Cα domain, were not identified by NMR due to the relatively large number of unassigned residues in this region. Interestingly, this part of the Cα domain is poorly resolved with missing electron density in a number of TCR crystal structures suggesting increased dynamics (8). Nevertheless, most of the NMR-derived secondary structure elements in TCR A6 corresponded well with the X-ray structure in both the α and β chains, indicating that the conformations in the crystal and solution forms are similar.
In addition to giving important structural information, backbone chemical shifts also provide useful insights into the flexibility of polypeptide chains in the form of order parameters, S2 (36). For the β chain of A6, secondary structure elements correspond well with high order parameters (S2 ∼0.9), consistent with more rigid parts of the TCR structure (Fig. 1C, center panel). In contrast, loops linking secondary structures generally have lower order parameters (S2 ∼0.6–0.8), indicating increased flexibility. Notably, all three complementarity-determining region (CDR) loops (CDR1β, CDR2β, and CDR3β) have relatively low-order parameters, signifying that they are flexible in solution. The exception is the fourth hypervariable loop in Vβ, designated HV4β, which is relatively rigid based on chemical shift derived order parameters. Similar patterns are observed for the α chain. High S2 values correlate well with secondary structure, and lower S2 values align with loop regions. As for the β chain, the HV4α loop is the least flexible of the hypervariable loops based on chemical shift data. The C-terminal region of the Cα domain (residues 175–204) appears to be quite dynamic with order parameters in the 0.2–0.7 range, although this section also has assignment gaps as mentioned above. Chemical shift–based order parameters were further compared with the crystallographic temperature (B) factors (Figs. 1C and 2C, lower panel). Generally, lower S2 values coincide with higher B-factors for both the α and β chains, although differences between secondary structure and loop regions are more evident in the NMR data. The elevated B-factors in the C-terminal part of the Cα domain further support the notion of increased chain flexibility in this region. Overall, the chemical shift assignments provided a set of highly self-consistent data on the solution conformation and dynamics of both chains in the TCR A6 heterodimer.
TCR A6 interactions with Tax–HLA-A2 in solution
Two TCR heterodimers, A6[α-2H/15N]β and A6α[β-2H/15N], were prepared for binding experiments with unlabeled Tax–HLA-A2 so that interactions with both the TCR α and β chains could be assessed. Two-dimensional 1H-15N-TROSY–HSQC spectra were acquired for the unbound and pMHC-bound states of TCR A6, monitoring chemical shift perturbations (CSPs) and peak intensity changes upon binding. Spectra of the pMHC complexes with A6[α-2H/15N]β and A6α[β-2H/15N] indicated that the unbound and bound states were in slow exchange, consistent with the relatively tight binding (KD ∼1 μm) between TCR A6 and Tax–HLA-A2 (33). Addition of unlabeled Tax–HLA-A2 to A6α[β-2H/15N] produced large CSPs for certain residues in the TCR A6 β chain (Fig. 3, A and B), indicating perturbations in local structure. Moreover, whereas all TCR A6 β chain backbone amide resonances broadened upon complex formation with Tax–HLA-A2, some resonances had a disproportionate loss of peak intensity (Fig. 3, A and C), suggesting changes in their main-chain dynamics on the NMR time scale (microseconds to milliseconds).
Figure 3.

Summary of changes to the NMR spectrum of A6α[β-2H,15N] upon addition of the pMHC ligand, Tax–HLA-A2. A, regions from the overlaid 2D 1H-15N TROSY–HSQC spectra of free A6α[β-2H,15N] (black) and Tax–HLA-A2-bound A6α[β-2H,15N] (red). For visual comparison purposes only, the bound-state spectrum is scaled so that peak intensities of most signals match those of the unbound state, highlighting the differential loss of peak intensity. B, combined 1H and 15N chemical shift perturbations, Δδtotal (ppm), in the TCR A6 β chain as a function of residue number. The dotted line indicates the mean value of Δδtotal plus 1 S.D. Gray histogram bars indicate prolines and unassigned residues. Pink columns indicate residue boundaries of CDR1β, CDR2β, HV4β, CDR3β, αA and αBβ. C, plot of percent loss of peak intensity versus residue number. The dotted line represents the mean percent loss of peak intensity plus 1 S.D. Hypervariable regions and the αA and αB helices in the Cβ domain are highlighted.
Spectra of labeled TCR A6/unlabeled Tax–HLA-A2 were recorded over a range of TCR A6 concentrations from 60 to 200 μm using 1.2–2.0 eq of pMHC. In all cases, the CSPs and peak intensity changes observed had a similar pattern, showing no indication of a secondary binding site. Consistent with our observations, a previous study on the TCR A6 interaction with Tax–HLA-A2 using analytical ultracentrifugation, dynamic light scattering, and surface plasmon resonance demonstrated that only 1:1 TCR–pMHC complexes were detectable in solution (37).
Experimentally significant changes in chemical shifts were ascribed to values of Δδtotal greater than or equal to the mean plus 1 S.D., corresponding to values of ∼0.06 ppm for the β chain and ∼0.02 ppm for the α chain. By comparison, in control experiments where TROSY–HSQC spectra were recorded on unbound TCR A6 at different concentrations and with different samples, the Δδtotal for any given amide signal was less than 0.005 ppm for nearly all residues and in the range of 0.005–0.01 ppm for a few others. This is similar to what was observed for the TCR MS2-3C8 β chain in a previous study (30).
As expected, many of the experimentally significant CSPs and differential peak intensity decreases in the TCR A6 β chain are for residues at or near the crystallographic binding interface with Tax–HLA-A2 (Fig. 3, B and C). This includes changes in CDR1β (Gln-25, Met-27, and Asn-28), CDR2β (Ala-52, Gly-53, Ile-54, Thr-55, and Asp-56), CDR3β (Gly-96, Leu-97, Gly-99, Gly-100, and Arg-101), and HV4β (Arg-68, Thr-70, Thr-71, and Glu-72). Thus, all of the hypervariable loops experience perturbations, even though nearly all the direct contacts between the β chain and Tax–HLA-A2 are through CDR3β in the crystal structure of the complex (32, 33). Notably, numerous significant CSPs and differential losses of peak intensity were also observed for residues in Vβ and Cβ that are not near the binding interface with pMHC. The largest of these changes in the β chain are clustered in three locations: 1) the Vα/Vβ interface (Ser-33, Gly-40, Gly-42, Gln-104, and Gly-107); 2) the Vβ/Cβ interface (Thr-115, Leu-118, Lys-119, Phe-122, Phe-151, Tyr-152, Tyr-216, Glu-220, Gln-226, and Asp-227); and 3) the Cα/Cβ interface (Phe-129, Ser-132, Glu-135, Thr-143, Val-145, Ser-192, Ser-193, Leu-195, and Arg-196) (Fig. 4). Residues Ser-132, Glu-135, Thr-143, Leu-195, and Arg-196 in the Cα/Cβ interface are distant from the antigen-binding site of A6 but close to the αA and αB helices of Cβ (Fig. 7B), which have been identified as docking sites for CD3 subunits (30, 31).
Figure 4.

Effect of Tax–HLA-A2 binding on TCR A6 β chain residues. A, TCR A6 β chain residues with experimentally significant changes (≥ mean plus 1 S.D.) upon addition of Tax–HLA-A2 are highlighted. The A6 color scheme is as follows: β chain (wheat); unassigned β chain residues, including prolines (gray); significant CSPs (cyan); significant peak intensity changes (red); and α chain (green). The portion of the Tax–HLA-A2 at the interface with TCR A6 is shown as a gray ribbon for the MHC and pink for the peptide (PDB code 1QRN) (33). B, surface representation of the TCR A6 β chain in two orientations with the same color scheme as in A.
Figure 7.

Residues in interfacial regions of TCR A6 with NMR signals perturbed by Tax–HLA-A2 binding. A, Vβ/Vα interface with the following color scheme: β chain (wheat); α chain (green); unassigned/proline residues (gray); experimentally significant CSPs (β chain/cyan and α chain/purple); experimentally significant loss of peak intensities (β chain/red and α chain/orange). B, Cβ/Cα interface. C, Vβ/Cβ interface. Color schemes in B and C are as in A.
Similar binding experiments were carried out using unlabeled Tax–HLA-A2 and A6[α-2H/15N]β to determine the effects on the α chain. Although assignments are not as complete as for the β chain, a comparable pattern of spectroscopic changes was readily apparent (Fig. 5). Experimentally significant CSPs and/or differential peak intensity losses were observed in CDR1α (Gly-28 and Ser-29), CDR2α (Gly-53 and Asp-54), CDR3α (Asp-93 and Ser-94), and HV4α (Asn-65, Ala-67, and Ser-68). There were also noteworthy changes outside the crystallographic interface with pMHC (32, 33), as was the case for the β chain. The majority of these perturbations are clustered in the Vα/Vβ interface (Phe-33, Trp-34, Tyr-35, Arg-36, Thr-85, Leu-87, Ala-89, Phe-100, Ala-102, Gly-103, and Gln-105) and the Cα/Cβ interface (Ser-128, Asp-129, Lys-130, Cys-133, Leu-134, Phe-135, Thr-136, Asp-137, Asp-161, and Ala-172) (Fig. 6). In marked contrast to the A6 β chain, few perturbations were observed in the Vα/Cα interface, which is considerably smaller than the Vβ/Cβ interface (see below).
Figure 5.

Summary of changes to the NMR spectrum of A6[α-2H,13C,15N]β upon addition of the pMHC ligand, Tax–HLA-A2. A, regions from the overlaid 2D 1H-15N TROSY–HSQC spectra of free A6[α-2H,15N]β (black) and Tax–HLA-A2-bound A6[α-2H,15N]β (red). The bound state spectrum is scaled as in Fig. 3A. B, combined 1H and 15N chemical shift perturbations, Δδtotal (ppm), in the TCR A6 α chain as a function of residue number. The dotted line indicates the mean value of Δδtotal plus 1 S.D. Gray histogram bars indicate prolines and unassigned residues. Pink columns indicate residue boundaries of CDR1β, CDR2β, HV4β, CDR3β, αA and αBβ. C, plot of percent loss of peak intensity versus residue. The dotted line represents the mean percent loss of peak intensity plus 1 S.D. Hypervariable regions are highlighted.
Figure 6.

Effect of Tax–HLA-A2 binding on TCR A6 α residues. A, TCR A6 α chain residues with experimentally significant changes (≥ mean plus 1 S.D.) upon addition of Tax–HLA-A2 are highlighted. The color scheme is as follows: α chain (green); unassigned α chain residues including prolines (gray); significant CSPs (purple); significant peak intensity changes (orange); and β chain (wheat). The portion of Tax–HLA-A2 at the interface with TCR A6 is shown as a gray ribbon for the MHC and pink for the peptide (PDB code 1QRN) (33). B, surface representation of the A6 α chain in two orientations with the same color scheme as in A.
In summary, the NMR binding results indicate that many residues in both the α and β chains of TCR A6 are perturbed upon binding to Tax–HLA-A2. This includes not only amino acids at the crystallographic binding interface but also numerous long-range effects, many of which are located at the interfacial regions between domains. Outside the binding interface with Tax–HLA-A2, a significant number of TCR A6 residues with perturbations in one chain are therefore in close contact with affected residues in the other. Thus, the independent Tax–HLA-A2 binding experiments on labeled α and β chains provide complementary information about changes at the A6 heterodimer interface that are self-consistent. For example, perturbed residues Ser-33, Gly-42, Gly-107, and Gln-104 in the A6 β chain are in proximity to perturbed residues Phe-33, Tyr-35, Ser-42, Leu-87, Ala-89, and Phe-100 from the α chain at the Vα/Vβ interface (Fig. 7A). Similar observations were made at the Cα/Cβ interface: residues Phe-129, Ser-132, Glu-135, Thr-143, Val-145, Ser-192, and Arg-196 in the β chain undergo changes upon pMHC binding and are near perturbed residues Lys-130, Leu-134, Thr-136, and Asp-137 in the α chain (Fig. 7B). Connecting these Vα/Vβ and Cα/Cβ regions, a number of residues at the interface between the Vβ and Cβ domains of A6 show changes upon engaging Tax–HLA-A2 (Fig. 7C). Together, these chemical shift and peak intensity perturbations indicate that binding of pMHC to A6 causes a series of structural and possibly dynamic changes in the TCR ectodomain. These changes in conformation and dynamics are likely small amplitude but are nonetheless transmitted from the Tax–HLA-A2–binding site in the Vα and Vβ domains at one end of the molecule to the Cα and Cβ domains at the other end. Residues in the αA and αB helices of Cβ have been previously shown to form at least part of the docking site for CD3 signaling molecules (30, 31). Perturbations in NMR signals detected in this study propagate all the way to the CD3-docking site and neighboring residues, indicating a linkage between the pMHC and CD3 sites and suggesting a possible allosteric mechanism for the initiation of T cell signaling. Further support for this hypothesis was obtained from MD simulations.
Molecular dynamics simulations of TCR A6 in unbound and pMHC-bound states
Separate MD simulations were carried out for 1200 ns using unbound and pMHC-bound structures of TCR A6 as starting points. Comparison between unbound and Tax–HLA-A2–bound states provided an in silico picture of how pMHC binding affects A6 main-chain flexibility, as measured by the root mean square deviation (RMSD) and the root mean square fluctuation (RMSF) for the Cα atom of each residue from the 200-ns time point to the end of the simulations. As seen from plots of RMSD trajectories (Fig. S1), the simulation stabilized around 150 ns and TCR conformations sampled around the crystal structures during the rest of the simulation. Accordingly, we selected the conformations after 200 ns for RMSF analysis. The four domains of TCR A6 behaved differently, with fewer RMSF changes in V domains than C domains upon pMHC binding. Unbound Cα and Cβ domains display similar fluctuations. However, upon pMHC binding, the Cβ domain is stabilized, whereas the Cα domain is destabilized. Binding of pMHC to TCR A6 decreased the flexibility of most residues in CDR1β, CDR3β, CDR1α, CDR3α, and most Cβ domain loops. However, CDR2β and the Cα domain became more flexible.
The rigidification effects therefore tend to be larger for CDR loops in the β chain than in the α chain (Fig. 8, A and B). Moreover, the general decrease in flexibility propagates well into the TCR A6 β chain structure, extending through the Vβ domain to the adjacent FG, BC, and DE loops in Cβ, and into the Cβ domain itself, including perturbations to αA and αB at the CD3-docking site (Fig. 8C) (30, 31). In contrast, the MD simulations predict that pMHC binding causes a combination of both increased and decreased flexibility in the TCR A6 α chain. Thus, although there is rigidification of CDR1α and CDR3α and other parts of the Vα and Cα domains upon pMHC ligation, there is also increased flexibility in CDR2α and the Vα–Cα linker. Overall, the most notable feature from the MD simulations is that pMHC binding induces extensive long-range effects on TCR A6 flexibility in both chains but particularly the β chain. Indeed, the largest and most extensive RMSF differences observed (1–2 Å) correspond to increased rigidity and are located in the FG loop of the Cβ domain, far from the pMHC-binding site (Fig. 8C). In a similar case, a recent MD simulation of single-chain Fv antibodies found that the linker between the VH and VL domains exhibited the dominant dynamical response by being coupled to nearly the entire protein (38). Our MD simulations are consistent with previous H/D exchange experiments showing that pMHC binding induced a global reduction in TCR A6 flexibility that included the Cβ FG loop (28).
Figure 8.

Molecular dynamics simulations of TCR A6 in unbound and pMHC-bound states. A, ΔRMSF (unbound − bound) values for the TCR A6 α chain. Positive values indicate A6 α chain regions that become more rigid upon binding to Tax–HLA-A2, whereas negative values indicate increased TCR α chain flexibility. Hypervariable regions are highlighted. B, ΔRMSF values for the A6 β chain. C, ΔRMSF values mapped onto the X-ray structure of TCR A6 in complex with Tax–HLA-A2 (1QRN) (33). The individual structural components of the complex are color-coded as follows: HLA-A2 (gray); Tax peptide (magenta); TCR A6 α chain (green); TCR A6 β chain (wheat). The ΔRMSF values are mapped onto the TCR in the following way: ΔRMSF >0.2 Å (blue); 0.1 < ΔRMSF<0.2 Å (light blue); −0.2 < ΔRMSF < −0.1 Å (orange); and ΔRMSF < −0.2 Å (red).
To compare chemical shift changes from MD simulation and NMR, we used ShiftX2 (39) to predict chemical shifts of unbound (5000 conformations) and pMHC-bound TCR A6 (5000 conformations) using the conformations obtained from the last 500 ns of the 1.2-μs simulations. There are excellent correlations between calculated and experimentally assigned chemical shifts for unbound TCR: R2 = 0.89 and 0.93 for α-carbon atoms in the α and β chains, respectively; the corresponding correlations for carbonyl carbon atoms are R2 = 0.43 and 0.45. We compared the chemical shift change of amide nitrogen atoms, which are only assigned for pMHC-bound TCR. Although there were no quantitative correlations between simulations and NMR, we could reproduce the largest chemical shift perturbation of Gly-40 in the TCR β chain (Fig. S2).
Comparison between the MD and NMR results indicates that the pattern of long-range effects on TCR A6 is broadly similar, despite differences in the time scales over which observations were made. Thus, changes in RMSFs out to 1.2 μs in the MD simulations exhibit comparable effects propagating into the C domain to those detected by NMR on the longer microseconds–milliseconds time scale. It should be noted that the motions seen on the MD time scale employed here will not lead to line broadening. In analogy with the MD simulations, NMR perturbations in the A6 TCR β chain extend from Vβ to Cβ and include changes in residues from the FG loop and adjacent regions (Fig. 4A). NMR shift perturbation effects are smaller for CDR loops in the α chain (Fig. 5B) than the β chain (Fig. 3B), in parallel with the reduced ΔRMSF values seen for the α chain CDR loops in MD simulations, suggesting that the TCR β chain is the major source of propagating long-range effects (see “Discussion”).
In summary, pMHC binding leads to long-range changes in TCR A6 conformation and/or flexibility. The patterns of perturbations indicated experimentally by NMR and predicted computationally by MD simulations overlap to a significant degree. Changes induced by pMHC ligation extend from the binding site at one end of the TCR molecule to a region near the transmembrane helices and the docking site for CD3 molecules (30, 31), suggesting a plausible pathway for allosteric control of T cell signaling. We propose that signals are relayed from the TCR V domains to three key allosteric sites in the C domains: 1) the unique 16-residue Cβ FG loop that projects from the Vβ/Cβ interface; 2) a cluster of Cβ residues in or near the Cβ αA helix, a region that interacts with CD3 (30, 31); and 3) the Cα AB loop located at the membrane-proximal base of the TCR. The biological relevance of each of these allosteric sites to signal transduction is supported by previous mutagenesis and functional studies using transfected or transgenic T cells (29, 40–42), as discussed below.
Analysis of domain interface residue conservation and energetics
To identify conserved interdomain contacts that may mediate allosteric communication between TCR V and C domains, we collected and analyzed sets of nonredundant α and β chain structures from the Protein Data Bank (PDB) (Tables S1 and S2) (43). To avoid over-representation of V domain residues due to biased Vα and Vβ gene usage in X-ray structures, these sets are nonredundant by TRAV or TRBV gene used. These were analyzed for residues frequently observed at Vα/Cα or Vβ/Cβ domain interfaces (present in >90% of structures), and computational alanine scanning was used to assess relative impact of side chains on interdomain assembly (Table S3). In Vα/Cα interfaces (Fig. 9A), a glutamate residue (Glu-14 in TCR A6) is present in 93 and 94% of human and mouse germline genes, respectively (Fig. S3), and is proximal to a lysine residue at position 168 in Cα. Lys-168 is present in human and mouse TCRs, suggesting the possibility of a conserved salt bridge interaction. However, the average energetic impact of these residues on domain interactions is not predicted to be high in the Rosetta scoring function used (44). In contrast with Vα/Cα interfaces, a larger set of residues was observed in Vβ/Cβ interfaces (Table S3), several of which have major calculated effects on interdomain interface energy. These include a cluster of five co-located hydrophobic residues (Fig. 9B), of which two are near the N terminus of the Vβ domain. Although these Vβ residues, located at positions 10 and 12, are not fully conserved among TRBV germline genes (Fig. S2), they are predominantly (position 10) or always (position 12) hydrophobic. This cluster of hydrophobic residues in the β chain overlaps with positions associated with pMHC binding perturbation in NMR, specifically Leu-118 and Tyr-216 (Fig. 7C), and is proximal to residues Thr-115 and Tyr-152, which likewise showed NMR perturbations upon pMHC binding and exhibited some calculated impact on domain interface energetics (Table S3).
Figure 9.
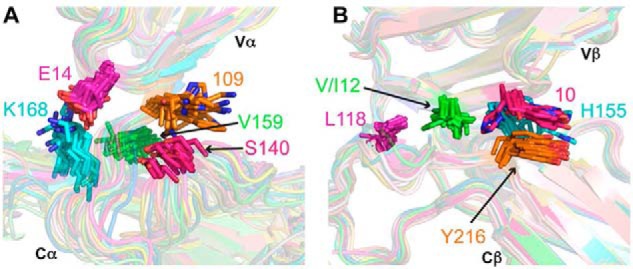
Vα/Cα and Vβ/Cβ domain interfaces in human and mouse TCR structures. A, structures shown are 28 TCR α chain X-ray structures (Table S1). B, structures shown are 27 β chain X-ray structures (Table S2). The structures are nonredundant by TRAV or TRBV gene usage and are superposed by Vα or Vβ domains. The orientation between Vα and Cα domains displays greater variability than that between Vβ and Cβ domains. Selected frequently observed V/C interface residues are shown as sticks and labeled by residue number (based on A6 TCR numbering). Highly conserved residues are labeled by predominant or sole amino acid(s) observed at that position in structurally characterized TCRs and human and mouse germline genes.
An analysis of Vα/Vβ interface residues based on all functional germline TRAV, TRAJ, TRBV, and TRBJ gene sequences (human and mouse) downloaded from the IMGT database (45) revealed additional highly conserved positions that potentially contribute to interdomain communication. Vα residues in the Vα/Vβ interface that undergo signal perturbations include the following: Tyr-35 (94% identical in human TRAV sequences; 80% identical in mouse TRAV sequences); Ala-89 (80 and 92%); Phe-100 (96% identical in human TRAJ sequences; 95% identical in mouse TRAJ sequences); and Gly-103 (100 and 100%). Perturbed Vβ residues in the interface with Vα include: Gly-40 (76% identical in human TRBV sequences; 44% identical in mouse TRBV sequences); Gly-42 (76 and 39%); Gln-104 (50% identical in human TRBJ sequences; 33% identical in mouse TRBJ sequences); and Gly-107 (100 and 100%). Additionally conserved Vα/Vβ interface residues include Gln-37 on the α chain (91% conserved in human and 92% conserved in mouse), which interacts with Gln-37 on the β chain (98 and 96%), in addition to residues Tyr-35 and Phe-106 on the β chain, which are both fully conserved in human and mouse. Of note, the interaction between residues at position 37 was previously noted by others as a key mediator of Vα/Vβ positioning (46).
Discussion
The NMR and MD results presented here indicate that pMHC binding has long-range effects on TCR conformation and dynamics. Similar long-range stabilization effects on TCR upon pMHC ligation have been observed using H/D exchange measurements (28). Taken together, the NMR, MD, and H/D exchange results illustrate that comparable changes in TCR chain flexibility have been predicted or detected experimentally over a range of time scales from hundreds of nanoseconds to seconds or longer. Importantly, similar observations have been made in other protein systems displaying dynamic allostery (e.g. catabolite activator protein, 20S core particle proteasome, and PDZ proteins), in which long-range transmission of biological signals was shown to occur via alterations in protein flexibility at distant sites upon ligand binding (22–27). Dynamic allostery could also explain the exceptional ability of a single pMHC molecule binding to an exclusively monomeric TCR to activate T cells, without any requirement for ligand-induced receptor dimerization or oligomerization (21).
We propose that the unique structure of the TCR β chain enables allosteric communication between the TCR-binding sites for pMHC and CD3. In sharp contrast to Vα and Cα domains (and to antibody VL and CL or VH and CH1 domains), Vβ and Cβ domains are in intimate contact in all TCR structures determined to date (8). The average total buried surface area between Vβ and Cβ is 1007 ± 105 Å2 for 27 nonredundant β chains analyzed here (1123 Å2 for A6), compared with 539 ± 71 Å2 for Vα and Cα for 28 nonredundant α chains (522 Å2 for A6). Corresponding buried surfaces between antibody VH and CH1 domains, or between VL and CL domains, vary from about 200 to 450 Å2, depending on the elbow angle. Extensive and highly conserved interactions between Vβ and Cβ (see above) impose on the TCR αβ heterodimer an overall rigid structure that is largely devoid of flexibility in the region homologous to the elbow of an antibody Fab fragment. This may have important implications for signal transduction, because a rigid conformation could facilitate transmission of any allosteric changes that may occur in the TCR upon binding pMHC to associated CD3 molecules in the TCR–CD3 complex (47).
In support of this idea, we observed experimentally significant CSPs or losses of peak intensity for numerous residues in the tightly packed Vβ/Cβ interface, including Thr-115, Leu-118, Lys-119, Phe-122, Phe-151, Tyr-152, Tyr-216, and Glu-220, which would provide an obvious path for allosteric signal transmission from Vβ to Cβ. By contrast, considerably fewer NMR signal perturbations were detected for residues in the much smaller and loosely packed Vα/Cα interface, making allosteric signaling across this interface less likely. Accordingly, we propose that spectroscopic changes in Vα upon Tax–HLA-A2 binding are relayed to Cα primarily through the β chain rather than across the Vα/Cα interface.
In addition to the close juxtaposition of Vβ and Cβ, another distinctive structural feature of TCR β chains is a unique 16-residue FG loop in Cβ (residues 216–231 in TCR A6) that protrudes between the Vβ and Cβ domains (Fig. 4A). This elongated FG loop, which is not present in Cα or in antibody CL or CH1 domains, has been implicated in TCR signaling (48). In particular, deletion of the Cβ FG loop in TCR transgenic mice, while maintaining TCR–CD3 expression and copy number on the surface of T cells, dramatically reduced their sensitivity to activation by cognate peptide (40, 41). MD simulations of TCR A6 in unbound versus pMHC-bound states revealed that the Cβ FG loop is sensitive to ligand binding (Fig. 8A). Consistent with MD results, NMR analysis revealed significant signal perturbations for Cβ FG loop residues Tyr-216, Glu-220, Gln-226, and Asp-227 upon TCR engagement of Tax–HLA-A2 (Fig. 7C).
Unlike the TCR, which comprises variable α and β chains, the pre-TCR consists of a variable TCR β chain paired with an invariant pre-TCR α chain (pre-Tα). Signaling through the pre-TCR during early T cell development terminates TCRβ rearrangements and triggers TCRα rearrangements, leading to assembly of αβ TCR heterodimers (49). Ligands for the pre-TCR are believed to be self-antigens on thymic stroma, possibly pMHC (50). The pre-Tα chain consists of a single immunoglobulin-like domain that interacts exclusively with the Cβ domain, leaving the Vβ domain unpaired (51). Despite the absence of Vα, the overall conformation of the TCR β chain in the pre-Tα/TCRβ heterodimer is essentially identical to that in the TCR. Most notably, the intimate association between Vβ and Cβ described above, including specific contacts across the Vβ/Cβ interface, is maintained, suggesting that allosteric signals may traverse similar pathways in TCR and pre-TCR β chains.
In a previous study, site-directed fluorescence labeling of a human TCR (LC13) specific for an Epstein-Barr virus peptide presented by HLA-B8 identified a discrete conformational change in the AB loop of the Cα domain (residues 123–130 in TCR A6) upon pMHC ligation (42). Mutagenesis of residues within the Cα AB loop, which is located at the base of the TCR proximal to the membrane (Fig. 6A), impaired antigen-specific triggering of LC13, suggesting a functional role for this loop in early T cell activation. Unlike fluorescence-based methods, NMR does not require the introduction of bulky fluoroprobes that may perturb protein conformation or dynamics. It is therefore noteworthy that NMR analysis of TCR A6 revealed signal perturbations for Cα AB loop residues Ser-128, Asp-129, and Lys-130 upon engagement of Tax–HLA-A2 (Fig. 6A), in agreement with fluorescence-based results for LC13 (42). Moreover, the fact that pMHC binding induces a conformational and/or dynamic change at the same Cα site in LC13 and A6 implies a conserved allosteric mechanism, given that these TCRs recognize different ligands using unrelated Vα/Vβ gene combinations.
Conserved long-range structural and/or dynamic changes are also apparent in a comparison of ligand-induced NMR signal perturbations in the β chains of human TCR A6 and mouse TCR B4.2.3 (NMR characterization of the B4.2.3 α chain was not reported) (29). Among the specific residues affected by pMHC binding in both TCRs are Cβ Ser-132, Glu-135, Thr-143, Ser-192, and Arg-196 (Ser-127, Glu-130, Thr-138, Ser-183, and Arg-187 in B4.2.3). These residues cluster near the αA (H3) helix of Cβ at the interface with Cα (Fig. 7B). Mutagenesis of several residues within this cluster reduced antigen-dependent activation of B.4.2.3 without affecting cell-surface expression, pMHC affinity, or thermal stability of the TCR, suggesting a functional role for this allosteric site in TCR signaling (29). Importantly, the Cβ αA helix has been identified by NMR as a docking site for CD3 subunits (30, 31). On the Cα side of the Cα/Cβ interface, Leu-134, Phe-135, Thr-136, and Asp-137, which are in proximity to perturbed Cβ residues near the Cβ αA helix, also undergo amide resonance changes in the bound state (Fig. 7B).
Although allosteric propagation of biological signals over long distances has been demonstrated for many proteins, including cell-surface receptors such as the EphA2 receptor (52, 53), the enormous diversity of TCRs poses a major conceptual challenge for allosteric models of T cell activation. How can conserved structural or dynamic changes in the TCR Cα and Cβ domains, such as those in the Cα AB loop and Cβ αA helix discussed above, be generated, given the diversity of TCR–pMHC binding interfaces and of Vα and Vβ sequences? At least part of the answer appears to be that perturbations in the highly variable CDR loops caused by pMHC ligation are relayed to the C domains through the Vα/Vβ and Vβ/Cβ interfaces, whose structures are relatively conserved across different TCRs (8), as described above. Indeed, this pathway is supported by NMR results for both TCRs A6 and B4.2.3 (29), in which numerous residues in the Vα/Vβ and Vβ/Cβ interfaces experience CSPs and peak intensity changes. Additionally, an analysis of TCR binding conformational changes through comparison of 20 unbound and pMHC-bound TCR crystallographic structure pairs found notable conformational changes centered at β chain residue Gly-40 (54), a Vα/Vβ interface residue with significant NMR signal perturbation in this study.
Although it may be intellectually appealing to search for a single molecular mechanism to explain early T cell activation, the long evolution of the TCR–CD3 complex may have led to the emergence of several distinct, yet interdependent, mechanisms (15). For example, our complementary NMR and MD analyses of TCR A6 have demonstrated that the Cβ FG loop is sensitive to allosteric perturbation upon pMHC binding. In the mechanotransduction model of TCR triggering, mechanical force arising from movement of the T cell relative to the APC is thought to be transferred to CD3ϵγ via the Cβ FG loop (55). Conformational selection related to the dynamics of this loop could potentiate interactions with CD3ϵγ, which NMR has shown to interact only weakly with unbound TCR (30, 31), thereby linking dynamic allostery with mechanotransduction. Indeed, several cooperative TCR triggering mechanisms may be required to activate different T lymphocyte subsets (CD4+ and CD8+ T cells, NKT cells, and regulatory T cells) at different anatomical sites (thymus and secondary lymphoid organs) and different stages of differentiation (naive, mature, and memory).
Experimental procedures
Production of TCR A6 with isotope-labeled α and β chains
For backbone assignment, the β chain of TCR A6 (residues 1–245) with U-2H,13C,15N labeling was obtained by inclusion body expression in Escherichia coli BL21(DE3) cells (Agilent) transformed with the vector pET-26b (Novagen). Transformed cells were grown in 25 ml of LB medium containing 30% D2O (Isotec) at 37 °C until A600 ≥1.0 and then transferred in a 1:50 dilution to 25 ml of M9 medium containing 70% D2O, 1 g/liter [15N] NH4Cl (Cambridge Isotope) as the sole source of nitrogen, and 4 g/liter [2H,13C]glucose (Cambridge Isotope) as the sole source of carbon. The culture was grown until A600 = 0.5–1.0 and was transferred in a 1:100 dilution to 100 ml of M9 containing 100% D2O and grown overnight. The overnight cultures were used to inoculate 1 liter of M9/D2O to a starting of A600 = 0.10. Induction with isopropyl β-d-thiogalactoside to a final concentration of 1 mm was performed at A600 ≥0.6, and growth was continued for 3–4 h at 37 °C. The bacteria were disrupted by sonication. Inclusion bodies were washed with and without 5% (v/v) Triton X-100, then solubilized in 8 m urea, 50 mm Tris-HCl (pH 8.0), and 10 mm DTT. The unlabeled TCR A6 α chain (residues 1–204) was expressed as inclusion bodies in E. coli BL21(DE3) cells transformed with pET-26b as described for the β chain. For in vitro folding, the TCR α and β chains were mixed in a 1.2:1 molar ratio and diluted into a folding mixture containing 5 m urea, 0.4 m l-arginine-HCl, 100 mm Tris-Cl (pH 8), 5 mm EDTA, 3.7 cystamine dihydrochloride, and 6.6 mm cysteamine to a final concentration of 50 mg/liter. The folding mixture was dialyzed against H2O for 72 h at 4 °C and then dialyzed against 10 mm Tris-HCl (pH 8.0) for 48 h at 4 °C. After removal from dialysis, the folding mixture was concentrated and dialyzed against 50 mm MES (pH 6.0) at 4 °C overnight. Disulfide-linked TCR A6 heterodimer was purified using sequential Mono Q and Superdex S-200 columns. For backbone assignment of the α chain of TCR A6, the α chain was labeled with U-2H,13C,15N and expressed as inclusion bodies for in vitro folding with unlabeled β chain as described above. For titration experiments with Tax–HLA-A2, U-2H,15N-labeled A6 α (or β) chain was produced similarly, except for the use of [2H,12C]glucose (Sigma) as the sole carbon source.
Production of Tax–HLA-A2
Soluble HLA-A2 loaded with Tax peptide (LLFGYPVYV) (GenScript) was prepared by in vitro folding. The HLA-A*0201 heavy chain (residues 1–275) and β2-microglobulin (residues 1–99) were produced separately as inclusion bodies in BL21(DE3) E. coli cells transformed by pET26b containing the corresponding genes. Inclusion bodies, prepared as described above, were dissolved in 8 m urea, 50 mm Tris-HCl (pH 8.0), 10 mm EDTA, and 10 mm DTT. For in vitro folding, the HLA-A*0201 heavy chain (30 mg), β2-microglobulin (30 mg), and Tax peptide (20 mg) were mixed and added dropwise to 1 liter of a folding solution containing 5 m urea, 0.4 m l-arginine-HCl, 100 mm Tris-HCl (pH 8.0), 5 mm EDTA, 3.7 mm cystamine, and 6.6 mm cysteamine. The folding solution was dialyzed against distilled H2O for 24 h and then against 10 mm Tris-HCl (pH 8.0) for 48 h at 4 °C. After 20-fold concentration and further dialysis against 20 mm Tris-HCl (pH 8.0) and 20 mm NaCl, correctly folded Tax–HLA-A2 was purified using a Mono Q FPLC column.
NMR spectroscopy
NMR spectra were acquired on Bruker AVANCE III 600 and 900 MHz spectrometers using Z-gradient 1H/13C/15N cryoprobes. Assignment of main-chain resonances for A6α[β-2H/13C/15N] and A6[α-2H/13C/15N]β was carried out using TROSY versions of the following three-dimensional triple resonance experiments with deuterium decoupling: HNCACB, HN(CO)CACB, HNCA, HN(CO)CA, HNCO, and HN(CA)CO. Spectra were acquired in nonuniform sampling mode and reconstructed as described (56). Both A6α[β-2H/13C/15N] and A6[α-2H/13C/15N]β samples were at concentrations of 200–250 μm in 50 mm sodium phosphate, 100 mm sodium chloride (pH 7.0), with 1% v/v Halt protein inhibitor mixture (Roche Applied Science). Spectra were recorded at 30 °C, processed in NMRPipe (57), and analyzed with SPARKY (58). Analysis of secondary structured regions using chemical shift data were obtained from TALOS-N (35). Protein structures were displayed and analyzed using PyMOL (Schrodinger).
Binding experiments were performed at 30 °C utilizing 80 μm TCR A6 samples, labeled at either the α chain or β chain, and unlabeled Tax–HLA-A2. Prior to mixing, a two-dimensional 1H-15N TROSY–HSQC spectrum was acquired for each A6-labeled sample as a control. Tax–HLA-A2 was exchanged into buffer conditions matching those of the A6 samples. Unlabeled Tax–HLA-A2 (1.2–2.0 molar eq) was added to 200 μl of 80 μm labeled A6 and concentrated back to 200 μl using membrane filtration. A 2D 1H-15N TROSY–HSQC spectrum was then recorded for pMHC-bound A6α[β-2H/13C/15N] and pMHC-bound A6[α-2H/13C/15N]β. Bound state peaks were assigned conservatively by inspection utilizing the assignments for the unbound state. Chemical shift perturbations between free and pMHC-bound states of TCR A6 were determined from Δδtotal =((WHΔδH)2 + (WNΔδN)2)1/2, where ΔδH and ΔδN represent 1H and 15N chemical shift changes, respectively, between free and pMHC-bound states of A6. Weighting factors of WH = 1 and WN = 0.2 were used. Values of Δδtotal greater than or equal to the mean plus 1 S.D. were considered to be experimentally significant. This is a conservative estimate based on errors in TROSY–HSQC chemical shift measurements in multiple identical A6 samples and also in previous TCR samples (30). The loss of peak intensity for TCR A6 resonances upon Tax–HLA-A2 binding was measured using SPARKY (58). Experimentally significant changes were given by values greater than or equal to the mean percent loss in intensity value plus 1 S.D.
Molecular dynamics simulations and analysis
The experimental X-ray crystal structures of the complex between Tax–HLA-A2 and TCR A6 were employed as starting points for the MD simulations. The D/E chains of A6 from the A6 X-ray structure in complex with Tax–HLA-A2 (PDB code 1QRN) (33) was used for the simulation of unbound TCR. The complex between a high-affinity version of A6 (A6c134) and Tax–HLA-A2 (PDB code 4FTV) was used as a homology template to prepare the TCR–pMHC structure by mutating in silico the corresponding β chain residues back to TCR A6 (A6c134/A6: Ala/Met-98, Gly/Ser-99, Gly/Ala-100, Arg/Gln-101, Ala/Glu-133, Glu/Ala-133, and Asn/Asp-204). MD simulations verified that TCRs A6 and A6c134 have almost identical dynamics (data not shown). The starting structures were then solvated by TIP3P water molecules, and sodium and chloride ions were added to neutralize the system and to achieve a total concentration of ∼150 mm. Box sizes for the TCR–pMHC complex were 156 × 156 × 152 Å3 with 307,057 atoms and 80 × 93 × 84 Å3 with 59,085 atoms. The resulting solvated systems were energy-minimized for 5000 conjugate gradient steps, with the protein fixed, whereas water molecules and counterions were allowed to move. This was followed by an additional 5000 conjugate gradient steps, where all atoms were allowed to move. In the equilibration stage, each system was gradually relaxed by performing a series of dynamic cycles. In the production stage, all simulations were performed using the NPT ensemble at 300 K for 300 ns. All MD simulations were performed using the NAMD program (60) with CHARMM27 force field with CMAP correction (61, 62). This force field is known to substantially overstabilize helical structures, and the effect on these simulations is unknown (63). The short-range van der Waals interactions were calculated using the switching function, with a twin range cutoff of 10.0 and 12.0 Å. The long-range electrostatic interactions were calculated with the Particle Mesh Ewald method with a cutoff of 12.0 Å. To minimize the effects caused by crystal packing, the initial 200-ns simulations were not used in RMSF calculations. Thus, the conformations generated from the last 1000 ns of 1200-ns MD simulation trajectories (10000 frames for each simulation) were used for RMSF analysis. To project out the effect of interdomain motion on RMSF values, each domain (Vα, Vβ, Cα, and Cβ) was superimposed separately. The averaged structures from the last 1000 ns were used as reference. The conformers generated from 500-ns simulations (5000 frames) were used for NMR chemical shift calculation using the ShiftX2 algorithm (39).
Collection and analysis of TCR structures
TCR α and β X-ray structures were obtained from the RCSB PDB (43). Structures were retained based on X-ray structure resolution (<3.0 Å), the presence of both V and C domains, and the lack of missing residues near V/C domain interfaces. Human and mouse TRAV and TRBV germline amino acid reference sequences were obtained from the IMGT database (45) and were used to assign TRAV and TRBV genes to each structure and remove redundancies. Furthermore, chimeric human–mouse TCR chains were removed. Structures were renumbered based on the TCR A6 structure (PDB code 3QH3) (34), and interdomain interface residues were identified based on a 5 Å distance cutoff to any atom in the other domain. For this analysis, the Vα C terminus was defined as residue 111, and the Vβ C terminus was residue 117. To account for Vα/Cα and Vβ/Cβ interface residues, only positions >2 residues apart in sequence were used for interface residue determination. Computational alanine scanning was performed using the “interface” protocol in Rosetta version 2.3 (44), which was used to model alanine point mutations in each structure and calculate the interdomain binding energy changes (ΔΔG).
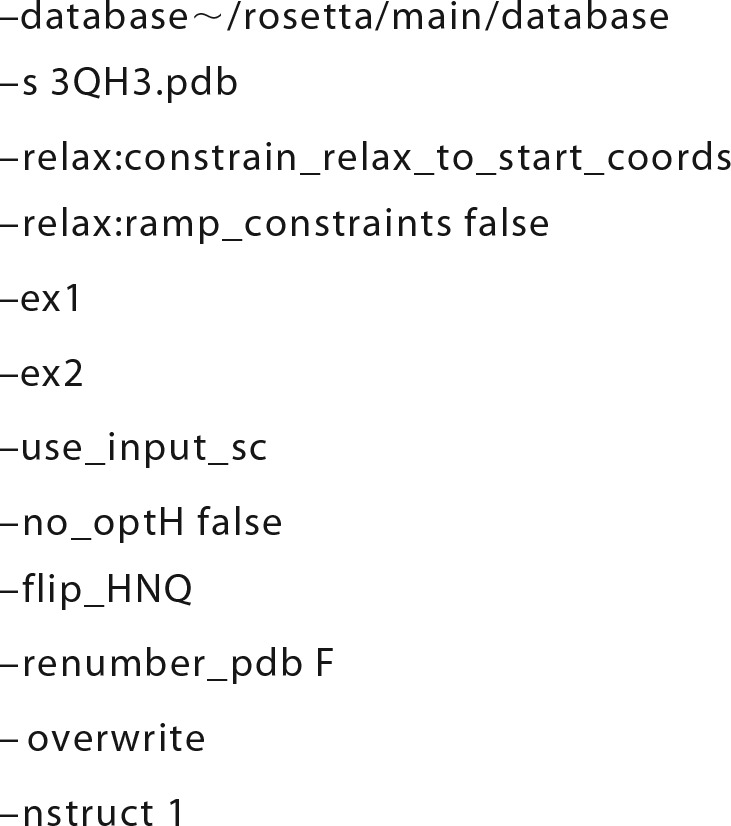
Prior to computational alanine scanning, all structures were subjected to constrained minimization using the FastRelax protocol (64) in Rosetta version 3 (weekly release 2017.29), to alleviate any minor structural defects from the X-ray structures that would potentially bias energetic calculations. Example command line flags used for FastRelax are as follows:
 |
Example command line flags used for alanine scanning simulation are as follows:
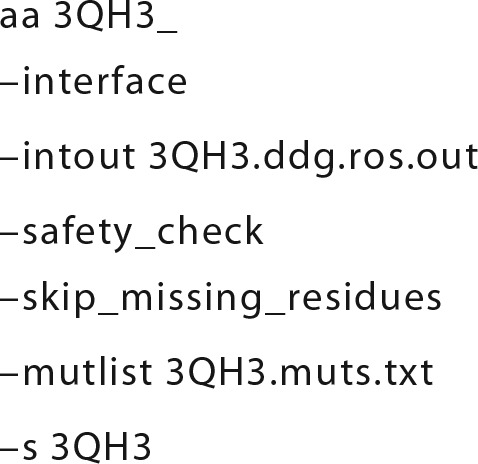 |
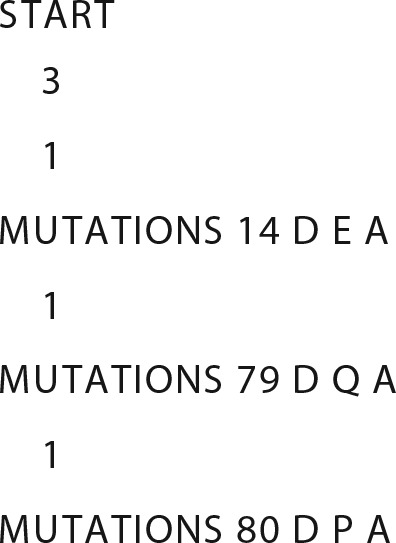
This performs computational alanine scanning on an input TCR structure, 3QH3.pdb, with the set of mutations specified in the file “3QH3.muts.txt”. The format of that file is shown in the following example, which specifies three alanine point mutations in the D chain (positions 14, 79, 80):
 |
TCR germline sequence analysis
TRAV, TRBV, TRAJ, and TRBJ germline amino acid reference sequences were obtained from the IMGT database (45). Only functional TRAV and TRBV genes based on IMGT annotation were used, and only the first allele for each gene was included, to avoid over-representation of genes with multiple alleles. This resulted in 45 human and 108 mouse TRAV sequences, 48 human and 22 mouse TRBV sequences, 50 human and 39 mouse TRAJ sequences, and 13 human and 11 mouse TRBJ sequences. TRAV and TRBV sequences were aligned by IMGT, and TRAJ and TRBJ sequences were aligned using CLUSTAL (65). Graphical representation of TRAV and TRBV sequence propensities was performed using the WebLogo tool (59).
Author contributions
S. R., Y. H., Y. C., B. M., R. G., B. G. P., R. N., R. A. M., and J. O. conceptualization; S. R., B. G. P., R. N., R. A. M., and J. O. supervision; S. R., Y. H., Y. C., M. C. K., B. M., R. G., B. G. P., and R. N. investigation; S. R., Y. H., Y. C., B. M., R. G., B. G. P., R. N., R. A. M., and J. O. writing-original draft.
Supplementary Material
Acknowledgments
We thank Daniel R. Scott (National Institute of Standards and Technology) for the gift of TCR A6 expression plasmids. The NMR facility is jointly supported by the University of Maryland, the National Institute of Standards and Technology, and a grant from the W.M. Keck Foundation. All simulations were performed using the high-performance computational facilities of the Biowulf PC/Linux cluster at the National Institutes of Health, Bethesda, Maryland (https://hpc.nih.gov/systems/).
This work was supported by National Institutes of Health Grant AI129893 (to R. A. M. and J. O.), and startup funds from the University of Maryland (to B. G. P.). This project has been funded in whole or in part with Federal funds from the Frederick National Laboratory for Cancer Research, National Institutes of Health, under contract HHSN261200800001E. This research was supported (in part) by the Intramural Research Program of NIH, Frederick National Laboratory, Center for Cancer Research. The authors declare that they have no conflicts of interest with the contents of this article. The content of this publication does not necessarily reflect the views or policies of the Department of Health and Human Services, nor does mention of trade names, commercial products or organizations imply endorsement by the U.S. Government.
This article contains Figs. S1–S3 and Tables S1–S3.
BMRB accession codes 27440 and 27441 have been deposited in the Biological Magnetic Resonance Bank.
- TCR
- T cell receptor
- MHC
- major histocompatibility complex
- APC
- antigen-presenting cell
- pMHC
- peptide–MHC
- ITAM
- immunoreceptor tyrosine-based activation motif
- H/D exchange
- hydrogen/deuterium exchange
- MD
- molecular dynamics
- TROSY
- transverse relaxation optimized
- V
- variable
- C
- constant
- CDR
- complementarity-determining region
- HV4
- fourth hypervariable loop
- CSP
- chemical shift perturbation
- HSQC
- heteronuclear single quantum coherence
- RMSF
- the root mean square fluctuation
- RMSD
- root mean square deviation
- PDB
- Protein Data Bank.
References
- 1. Wucherpfennig K. W., Gagnon E., Call M. J., Huseby E. S., and Call M. E. (2010) Structural biology of the T-cell receptor: insights into receptor assembly, ligand recognition, and initiation of signaling. Cold Spring Harb. Perspect. Biol. 2, a005140 [DOI] [PMC free article] [PubMed] [Google Scholar]
- 2. Kuhns M. S., and Badgandi H. B. (2012) Piecing together the family portrait of TCR–CD3 complexes. Immunol. Rev. 250, 120–143 10.1111/imr.12000 [DOI] [PubMed] [Google Scholar]
- 3. Blum J. S., Wearsch P. A., and Cresswell P. (2013) Pathways of antigen processing. Annu. Rev. Immunol. 31, 443–473 10.1146/annurev-immunol-032712-095910 [DOI] [PMC free article] [PubMed] [Google Scholar]
- 4. Rudolph M. G., Stanfield R. L., and Wilson I. A. (2006) How TCRs bind MHCs, peptides, and coreceptors. Annu. Rev. Immunol. 24, 419–466 10.1146/annurev.immunol.23.021704.115658 [DOI] [PubMed] [Google Scholar]
- 5. Marrack P., Scott-Browne J. P., Dai S., Gapin L., and Kappler J. W. (2008) Evolutionarily conserved amino acids that control TCR-MHC interaction. Annu. Rev. Immunol. 26, 171–203 10.1146/annurev.immunol.26.021607.090421 [DOI] [PMC free article] [PubMed] [Google Scholar]
- 6. Yin Y., Li Y., and Mariuzza R. A. (2012) Structural basis for self-recognition by autoimmune T-cell receptors. Immunol. Rev. 250, 32–48 10.1111/imr.12002 [DOI] [PubMed] [Google Scholar]
- 7. Birnbaum M. E., Dong S., and Garcia K. C. (2012) Diversity-oriented approaches for interrogating T-cell receptor repertoire, ligand recognition, and function. Immunol. Rev. 250, 82–101 10.1111/imr.12006 [DOI] [PMC free article] [PubMed] [Google Scholar]
- 8. Rossjohn J., Gras S., Miles J. J., Turner S. J., Godfrey D. I., and McCluskey J. (2015) T cell antigen receptor recognition of antigen-presenting molecules. Annu. Rev. Immunol. 33, 169–200 10.1146/annurev-immunol-032414-112334 [DOI] [PubMed] [Google Scholar]
- 9. Samelson L. E. (2002) Signal transduction mediated by the T cell antigen receptor: the role of adapter proteins. Annu. Rev. Immunol. 20, 371–394 10.1146/annurev.immunol.20.092601.111357 [DOI] [PubMed] [Google Scholar]
- 10. Aivazian D., and Stern L. J. (2000) Phosphorylation of T cell receptor ζ is regulated by a lipid dependent folding transition. Nat. Struct. Biol. 7, 1023–1026 10.1038/80930 [DOI] [PubMed] [Google Scholar]
- 11. Gil D., Schrum A. G., Alarcón B., and Palmer E. (2005) T cell receptor engagement by peptide–MHC ligands induces a conformational change in the CD3 complex in thymocytes. J. Exp. Med. 201, 517–522 10.1084/jem.20042036 [DOI] [PMC free article] [PubMed] [Google Scholar]
- 12. Xu C., Gagnon E., Call M. E., Schnell J. R., Schwieters C. D., Carman C. V., Chou J. J., and Wucherpfennig K. W. (2008) Regulation of T cell receptor activation by dynamic membrane binding of the CD3ϵ cytoplasmic tyrosine-based motif. Cell 135, 702–713 10.1016/j.cell.2008.09.044 [DOI] [PMC free article] [PubMed] [Google Scholar]
- 13. van der Merwe P. A., and Dushek O. (2011) Mechanisms for T cell receptor triggering. Nat. Rev. Immunol. 11, 47–55 10.1038/nri2887 [DOI] [PubMed] [Google Scholar]
- 14. Kuhns M. S., and Davis M. M. (2012) TCR signaling emerges from the sum of many parts. Front. Immunol. 3, 159 [DOI] [PMC free article] [PubMed] [Google Scholar]
- 15. Malissen B., and Bongrand P. (2015) Early T cell activation: integrating biochemical, structural, and biophysical cues. Annu. Rev. Immunol. 33, 539–561 10.1146/annurev-immunol-032414-112158 [DOI] [PubMed] [Google Scholar]
- 16. Davis S. J., and van der Merwe P. A. (2006) The kinetic-segregation model: TCR triggering and beyond. Nat. Immunol. 7, 803–809 10.1038/ni1369 [DOI] [PubMed] [Google Scholar]
- 17. Kim S. T., Takeuchi K., Sun Z. Y., Touma M., Castro C. E., Fahmy A., Lang M. J., Wagner G., and Reinherz E. L. (2009) The αβ T cell receptor is an anisotropic mechanosensor. J. Biol. Chem. 284, 31028–31037 10.1074/jbc.M109.052712 [DOI] [PMC free article] [PubMed] [Google Scholar]
- 18. Fooksman D. R., Vardhana S., Vasiliver-Shamis G., Liese J., Blair D. A., Waite J., Sacristán C., Victora G. D., Zanin-Zhorov A., and Dustin M. L. (2010) Functional anatomy of T cell activation and synapse formation. Annu. Rev. Immunol. 28, 79–105 10.1146/annurev-immunol-030409-101308 [DOI] [PMC free article] [PubMed] [Google Scholar]
- 19. Huang J., Brameshuber M., Zeng X., Xie J., Li Q. J., Chien Y. H., Valitutti S., and Davis M. M. (2013) A single peptide–MHC complex ligand triggers digital cytokine secretion in CD4+ T cells. Immunity 39, 846–857 10.1016/j.immuni.2013.08.036 [DOI] [PMC free article] [PubMed] [Google Scholar]
- 20. O'Donoghue G. P., Pielak R. M., Smoligovets A. A., Lin J. J., and Groves J. T. (2013) Direct single molecule measurement of TCR triggering by agonist pMHC in living primary cells. eLIFE 2, e00778 10.7554/eLife.00778 [DOI] [PMC free article] [PubMed] [Google Scholar]
- 21. Brameshuber M., Kellner F., Rossboth B. K., Ta H., Alge K., Sevcsik E., Göhring J., Axmann M., Baumgart F., Gascoigne N. R. J., Davis S. J., Stockinger H., Schütz G. J., and Huppa J. B. (2018) Monomeric TCRs drive T cell antigen recognition. Nat. Immunol. 19, 487–496 10.1038/s41590-018-0092-4 [DOI] [PMC free article] [PubMed] [Google Scholar]
- 22. Tzeng S. R., and Kalodimos C. G. (2009) Dynamic activation of an allosteric regulatory protein. Nature 462, 368–372 10.1038/nature08560 [DOI] [PubMed] [Google Scholar]
- 23. Smock R. G., and Gierasch L. M. (2009) Sending signals dynamically. Science 324, 198–203 10.1126/science.1169377 [DOI] [PMC free article] [PubMed] [Google Scholar]
- 24. Motlagh H. N., Wrabl J. O., Li J., and Hilser V. J. (2014) The ensemble nature of allostery. Nature 508, 331–339 10.1038/nature13001 [DOI] [PMC free article] [PubMed] [Google Scholar]
- 25. McLeish T. C., Cann M. J., and Rodgers T. L. (2015) Dynamic transmission of protein allostery without structural change: spatial pathways or global modes? Biophys. J. 109, 1240–1250 10.1016/j.bpj.2015.08.009 [DOI] [PMC free article] [PubMed] [Google Scholar]
- 26. Tzeng S. R., and Kalodimos C. G. (2012) Protein activity regulation by conformational entropy. Nature 488, 236–240 10.1038/nature11271 [DOI] [PubMed] [Google Scholar]
- 27. Wand A. J. (2013) The dark energy of proteins comes to light: conformational entropy and its role in protein function revealed by NMR relaxation. Curr. Opin. Struct. Biol. 23, 75–81 10.1016/j.sbi.2012.11.005 [DOI] [PMC free article] [PubMed] [Google Scholar]
- 28. Hawse W. F., Champion M. M., Joyce M. V., Hellman L. M., Hossain M., Ryan V., Pierce B. G., Weng Z., and Baker B. M. (2012) Cutting edge: evidence for a dynamically driven T cell signaling mechanism. J. Immunol. 188, 5819–5823 10.4049/jimmunol.1200952 [DOI] [PMC free article] [PubMed] [Google Scholar]
- 29. Natarajan K., McShan A. C., Jiang J., Kumirov V. K., Wang R., Zhao H., Schuck P., Tilahun M. E., Boyd L. F., Ying J., Bax A., Margulies D. H., and Sgourakis N. G. (2017) An allosteric site in the T-cell receptor Cβ domain plays a critical signaling role. Nat. Commun. 8, 15260 10.1038/ncomms15260 [DOI] [PMC free article] [PubMed] [Google Scholar]
- 30. He Y., Rangarajan S., Kerzic M., Luo M., Chen Y., Wang Q., Yin Y., Workman C. J., Vignali K. M., Vignali D. A., Mariuzza R. A., and Orban J. (2015) Identification of the docking site for CD3 on the T cell receptor β chain by solution NMR. J. Biol. Chem. 290, 19796–19805 10.1074/jbc.M115.663799 [DOI] [PMC free article] [PubMed] [Google Scholar]
- 31. Natarajan A., Nadarajah V., Felsovalyi K., Wang W., Jeyachandran V. R., Wasson R. A., Cardozo T., Bracken C., and Krogsgaard M. (2016) Structural model of the extracellular assembly of the TCR–CD3 complex. Cell Rep. 14, 2833–2845 10.1016/j.celrep.2016.02.081 [DOI] [PMC free article] [PubMed] [Google Scholar]
- 32. Garboczi D. N., Ghosh P., Utz U., Fan Q. R., Biddison W. E., and Wiley D. C. (1996) Structure of the complex between human T cell receptor, viral peptide, and HLA-A2. Nature 384, 134–141 10.1038/384134a0 [DOI] [PubMed] [Google Scholar]
- 33. Ding Y. H., Baker B. M., Garboczi D. N., Biddison W. E., and Wiley D. C. (1999) Four A6-TCR/peptide/HLA-A2 structures that generate very different T cell signals are nearly identical. Immunity 11, 45–56 10.1016/S1074-7613(00)80080-1 [DOI] [PubMed] [Google Scholar]
- 34. Scott D. R., Borbulevych O. Y., Piepenbrink K. H., Corcelli S. A., and Baker B. M. (2011) Disparate degrees of hypervariable loop flexibility control T-cell receptor cross-reactivity, specificity, and binding mechanism. J. Mol. Biol. 414, 385–400 10.1016/j.jmb.2011.10.006 [DOI] [PMC free article] [PubMed] [Google Scholar]
- 35. Shen Y., and Bax A. (2013) Protein backbone and sidechain torsion angles predicted from NMR chemical shifts using artificial neural networks. J. Biomol. NMR 56, 227–241 10.1007/s10858-013-9741-y [DOI] [PMC free article] [PubMed] [Google Scholar]
- 36. Berjanskii M. V., and Wishart D. S. (2008) Application of the random coil index to studying protein flexibility. J. Biomol. NMR 40, 31–48 10.1007/s10858-007-9208-0 [DOI] [PubMed] [Google Scholar]
- 37. Baker B. M., and Wiley D. C. (2001) αβ T cell receptor ligand-specific oligomerization revisited. Immunity 14, 681–692 10.1016/S1074-7613(01)00160-1 [DOI] [PubMed] [Google Scholar]
- 38. Ettayapuram Ramaprasad A. S., Uddin S., Casas-Finet J., and Jacobs D. J. (2017) Decomposing dynamical couplings in mutated scFv antibody fragments into stabilizing and destabilizing effects. J. Am. Chem. Soc. 139, 17508–17517 10.1021/jacs.7b09268 [DOI] [PMC free article] [PubMed] [Google Scholar]
- 39. Han B., Liu Y., Ginzinger S. W., and Wishart D. S. (2011) SHIFTX2: significantly improved protein chemical shift prediction. J. Biomol. NMR 50, 43–57 10.1007/s10858-011-9478-4 [DOI] [PMC free article] [PubMed] [Google Scholar]
- 40. Sasada T., Touma M., Chang H. C., Clayton L. K., Wang J. H., and Reinherz E. L. (2002) Involvement of the TCR Cβ FG loop in thymic selection and T cell function. J. Exp. Med. 195, 1419–1431 10.1084/jem.20020119 [DOI] [PMC free article] [PubMed] [Google Scholar]
- 41. Touma M., Chang H. C., Sasada T., Handley M., Clayton L. K., and Reinherz E. L. (2006) The TCR Cβ FG loop regulates αβ T cell development. J. Immunol. 176, 6812–6823 10.4049/jimmunol.176.11.6812 [DOI] [PubMed] [Google Scholar]
- 42. Beddoe T., Chen Z., Clements C. S., Ely L. K., Bushell S. R., Vivian J. P., Kjer-Nielsen L., Pang S. S., Dunstone M. A., Liu Y. C., Macdonald W. A., Perugini M. A., Wilce M. C., Burrows S. R., Purcell A. W., Tiganis T., et al. (2009) Antigen ligation triggers a conformational change within the constant domain of the αβ T cell receptor. Immunity 30, 777–788 10.1016/j.immuni.2009.03.018 [DOI] [PubMed] [Google Scholar]
- 43. Rose P. W., Beran B., Bi C., Bluhm W. F., Dimitropoulos D., Goodsell D. S., Prlic A., Quesada M., Quinn G. B., Westbrook J. D., Young J., Yukich B., Zardecki C., Berman H. M., and Bourne P. E. (2011) The RCSB Protein Data Bank: redesigned web site and web services. Nucleic Acids Res. 39, D392–D401 10.1093/nar/gkq1021 [DOI] [PMC free article] [PubMed] [Google Scholar]
- 44. Kortemme T., and Baker D. (2002) A simple physical model for binding energy hot spots in protein-protein complexes. Proc. Natl. Acad. Sci. U.S.A. 99, 14116–14121 10.1073/pnas.202485799 [DOI] [PMC free article] [PubMed] [Google Scholar]
- 45. Lefranc M. P., Giudicelli V., Ginestoux C., Jabado-Michaloud J., Folch G., Bellahcene F., Wu Y., Gemrot E., Brochet X., Lane J., Regnier L., Ehrenmann F., Lefranc G., and Duroux P. (2009) IMGT, the international ImMunoGeneTics information system. Nucleic Acids Res. 37, D1006–D1012 10.1093/nar/gkn838 [DOI] [PMC free article] [PubMed] [Google Scholar]
- 46. Hoffmann T., Krackhardt A. M., and Antes I. (2015) Quantitative analysis of the association angle between T-cell receptor Vα/Vβ domains reveals important features for epitope recognition. PLoS Comput. Biol. 11, e1004244 10.1371/journal.pcbi.1004244 [DOI] [PMC free article] [PubMed] [Google Scholar]
- 47. Bentley G. A., Boulot G., Karjalainen K., and Mariuzza R. A. (1995) Crystal structure of the β chain of a T cell antigen receptor. Science 267, 1984–1987 10.1126/science.7701320 [DOI] [PubMed] [Google Scholar]
- 48. Wang J.-H., and Reinherz E. L. (2012) The structural basis of αβ T-lineage immune recognition: TCR docking topologies, mechanotransduction, and co-receptor function. Immunol. Rev. 250, 102–119 10.1111/j.1600-065X.2012.01161.x [DOI] [PMC free article] [PubMed] [Google Scholar]
- 49. von Boehmer H. (2014) The thymus in immunity and in malignancy. Cancer Immunol. Res. 2, 592–597 10.1158/2326-6066.CIR-14-0070 [DOI] [PubMed] [Google Scholar]
- 50. Mallis R. J., Bai K., Arthanari H., Hussey R. E., Handley M., Li Z., Chingozha L., Duke-Cohan J. S., Lu H., Wang J. H., Zhu C., Wagner G., and Reinherz E. L. (2015) Pre-TCR ligand binding impacts thymocyte development before αβ TCR expression. Proc. Natl. Acad. Sci. U.S.A. 112, 8373–8378 10.1073/pnas.1504971112 [DOI] [PMC free article] [PubMed] [Google Scholar]
- 51. Pang S. S., Berry R., Chen Z., Kjer-Nielsen L., Perugini M. A., King G. F., Wang C., Chew S. H., La Gruta N. L., Williams N. K., Beddoe T., Tiganis T., Cowieson N. P., Godfrey D. I., Purcell A. W., et al. (2010) The structural basis for autonomous dimerization of the pre-T-cell antigen receptor. Nature 467, 844–848 10.1038/nature09448 [DOI] [PubMed] [Google Scholar]
- 52. Nussinov R., Tsai C.-J., and Ma B. (2013) The underappreciated role of allostery in the cellular network. Annu. Rev. Biophys. 42, 169–189 10.1146/annurev-biophys-083012-130257 [DOI] [PMC free article] [PubMed] [Google Scholar]
- 53. Chavent M., Seiradake E., Jones E. Y., and Sansom M. S. (2016) Structures of the EphA2 receptor at the membrane: role of lipid interactions. Structure 24, 337–347 10.1016/j.str.2015.11.008 [DOI] [PMC free article] [PubMed] [Google Scholar]
- 54. Pierce B. G., and Weng Z. (2013) A flexible docking approach for prediction of T cell receptor-peptide–MHC complexes. Protein Sci. 22, 35–46 10.1002/pro.2181 [DOI] [PMC free article] [PubMed] [Google Scholar]
- 55. Brazin K. N., Mallis R. J., Das D. K., Feng Y., Hwang W., Wang J. H., Wagner G., Lang M. J., and Reinherz E. L. (2015) Structural features of the ab TCR mechanotransduction apparatus that promote pMHC discrimination. Front. Immunol. 6, 441 [DOI] [PMC free article] [PubMed] [Google Scholar]
- 56. Hyberts S. G., Milbradt A. G., Wagner A. B., Arthanari H., and Wagner G. (2012) Application of iterative soft thresholding for fast reconstruction of NMR data non-uniformly sampled with multidimensional Poisson Gap scheduling. J. Biomol. NMR 52, 315–327 10.1007/s10858-012-9611-z [DOI] [PMC free article] [PubMed] [Google Scholar]
- 57. Delaglio F., Grzesiek S., Vuister G. W., Zhu G., Pfeifer J., and Bax A. (1995) NMRPipe: a multidimensional spectral processing system based on UNIX pipes. J. Biomol. NMR 6, 277–293 [DOI] [PubMed] [Google Scholar]
- 58. Goddard T. D., and Kneller D. G. (2004) SPARKY 3, University of California San Francisco, CA [Google Scholar]
- 59. Crooks G. E., Hon G., Chandonia J. M., and Brenner S. E. (2004) WebLogo: a sequence logo generator. Genome Res. 14, 1188–1190 10.1101/gr.849004 [DOI] [PMC free article] [PubMed] [Google Scholar]
- 60. Kale L., Skeel R., Bhandarkar M., Brunner R., Gursoy A., Krawetz N., Phillips J., Shinozaki A., Varadarajan K., and Schulten K. (1999) NAMD-2: greater scalability for parallel molecular dynamics. J. Comp. Phys. 151, 283–312 10.1006/jcph.1999.6201 [DOI] [Google Scholar]
- 61. MacKerell A. D., Bashford D., Bellott M., Dunbrack R. L., Evanseck J. D., Field M. J., Fischer S., Gao J., Guo H., Ha S., Joseph-McCarthy D., Kuchnir L., Kuczera K., Lau F. T., Mattos C., et al. (1998) All-atom empirical potential for molecular modeling and dynamics studies of proteins. J. Phys. Chem. B 102, 3586–3616 10.1021/jp973084f [DOI] [PubMed] [Google Scholar]
- 62. Mackerell A. D. Jr., Feig M., and Brooks C. L. 3rd. (2004) Extending the treatment of backbone energetics in protein force fields: limitations of gas-phase quantum mechanics in reproducing protein conformational distributions in molecular dynamics simulations. J. Comput. Chem. 25, 1400–1415 10.1002/jcc.20065 [DOI] [PubMed] [Google Scholar]
- 63. Lindorff-Larsen K., Maragakis P., Piana S., Eastwood M. P., Dror R. O., and Shaw D. E. (2012) Systematic validation of protein force fields against experimental data. PLoS ONE 7, e32131 10.1371/journal.pone.0032131 [DOI] [PMC free article] [PubMed] [Google Scholar]
- 64. Conway P., Tyka M. D., DiMaio F., Konerding D. E., and Baker D. (2014) Relaxation of backbone bond geometry improves protein energy landscape modeling. Protein Sci. 23, 47–55 10.1002/pro.2389 [DOI] [PMC free article] [PubMed] [Google Scholar]
- 65. Thompson J. D., Gibson T. J., and Higgins D. G. (2002) Multiple sequence alignment using ClustalW and ClustalX. Curr. Protoc. Bioinformatics 2002 Chapter 2, Unit 2.3 10.1002/0471250953.bi0203s00 [DOI] [PubMed] [Google Scholar]
Associated Data
This section collects any data citations, data availability statements, or supplementary materials included in this article.