

Abstract
Increased glucose consumption distinguishes cancer cells from normal cells and is known as the “Warburg effect” because of increased glycolysis. Lactate dehydrogenase A (LDHA) is a key glycolytic enzyme, a hallmark of aggressive cancers, and believed to be the major enzyme responsible for pyruvate-to-lactate conversion. To elucidate its role in tumor growth, we disrupted both the LDHA and LDHB genes in two cancer cell lines (human colon adenocarcinoma and murine melanoma cells). Surprisingly, neither LDHA nor LDHB knockout strongly reduced lactate secretion. In contrast, double knockout (LDHA/B-DKO) fully suppressed LDH activity and lactate secretion. Furthermore, under normoxia, LDHA/B-DKO cells survived the genetic block by shifting their metabolism to oxidative phosphorylation (OXPHOS), entailing a 2-fold reduction in proliferation rates in vitro and in vivo compared with their WT counterparts. Under hypoxia (1% oxygen), however, LDHA/B suppression completely abolished in vitro growth, consistent with the reliance on OXPHOS. Interestingly, activation of the respiratory capacity operated by the LDHA/B-DKO genetic block as well as the resilient growth were not consequences of long-term adaptation. They could be reproduced pharmacologically by treating WT cells with an LDHA/B-specific inhibitor (GNE-140). These findings demonstrate that the Warburg effect is not only based on high LDHA expression, as both LDHA and LDHB need to be deleted to suppress fermentative glycolysis. Finally, we demonstrate that the Warburg effect is dispensable even in aggressive tumors and that the metabolic shift to OXPHOS caused by LDHA/B genetic disruptions is responsible for the tumors' escape and growth.
Keywords: Warburg effect, glycolysis, glucose metabolism, pentose phosphate pathway (PPP), lactic acid, cancer biology, tumor metabolism, CRISPR/Cas, genetic disruption, lactate dehydrogenase, LDHA, LDHB, metabolic plasticity, OXPHOS, tumor growth
Introduction
Increased glucose consumption distinguishes cancer cells from normal cells and is exploited to detect and image tumors in vivo. This phenomenon is known as the “Warburg effect” (1–4) and results from the conjunction of uncontrolled growth signaling, deregulated c-Myc and hypoxia-induced factor 1 (HIF-1) activity leading to induction of glycolytic enzymes (5–7), and inhibition of pyruvate oxidation in mitochondria (8, 9).
Lactate dehydrogenase A (LDHA) 10 is the predominantly expressed LDH enzymatic form in cancer cells and the key player of the Warburg effect. Enhanced LDHA activity and lactate production correlate with poor prognosis and resistance to chemo- and radiotherapy (10, 11). A poor prognosis may be at least in part due to lactic acid, which acts as an immunosuppressant that inhibits the function of a variety of immune cells, such as T cells and natural killer (NK) cells (12, 13). In line with this, LDHA silencing increases melanoma immunosurveillance as a direct consequence of blunting lactic acid release (12). Furthermore, LDHA has proven to be a valid therapeutic target, as pharmacological inhibition or LDHA knockdown decreased tumorigenicity in breast, lung, liver, lymphoma, and pancreas cancers (14–18), accompanied by reactivation of mitochondrial function in vitro. To date, the majority of studies have focused on the role of LDHA in tumor progression. A few studies, however, demonstrated that not only LDHA but also LDHB are up-regulated in triple-negative breast cancer (19) and lung adenocarcinomas (20). LDHB has also been related to response to chemotherapy in oral squamous cell carcinoma (21).
Lactate dehydrogenase ((S)-lactate:NAD+ oxidoreductase, EC 1.1.1.27) belongs to a family of NAD+-dependent enzymes and catalyzes the reversible conversion of pyruvate to lactate, coupled with oxidation/reduction of the cofactor (NADH/NAD+). Active LDH is a homo- or heterotetramer assembled by association of two different subunits, M and H, encoded by two separate genes, LDHA (M) and LDHB (H), respectively. These subunits were named based on their original detection in muscle (M) and heart (H) tissue. LDH tetramers form five isoenzymes that differ in their proportions of LDHA and LDHB subunits and in their tissue distribution (22). Whether the ratio of the two subunits determines the activity of the enzyme and the Km for pyruvate and lactate has been debated for many years (23). Most publications state that LDHA mainly reduces pyruvate to lactate, whereas LDHB catalyzes the reverse reaction, lactate oxidation to pyruvate, coupled with NADH formation. However, this assumption was already challenged by Vesell (24), who showed that the enzymatic activity of purified LDH-5 (four LDHA subunits) resembled that of LDH-1 (four LDHB subunits) at physiologic temperature. Furthermore, in zymography, which combines electrophoresis with activity staining to separate and detect the five LDH isoenzymes, both pyruvate and lactate have proven to be suitable substrates (25), further supporting the notion that both LDHA and LDHB are capable of catalyzing the conversion of pyruvate to lactate (22, 26).
Here we report that only the combined genetic disruption of LDHA and LDHB will fully suppress lactate secretion with a concomitant reduction in glucose consumption by the human colon adenocarcinoma cell line LS174T and the murine melanoma cell line B16-F10. The resulting metabolic shift to oxidative phosphorylation was sufficient to maintain viability and in vivo tumor growth.
Results
Genetic disruption of LDHA and LDHB is required to suppress lactate secretion in cancer cell lines
To elucidate the role of LDHA in tumors, we knocked out the LDHA gene in two glycolytic cancer cell lines, human colon adenocarcinoma (LS174T) and mouse melanoma (B16-F10) cells (Fig. 1, A and C), using the CRISPR-Cas9 technique (densitometric quantification of the corresponding Western blots is presented in Fig. 1, B and D). Complete allelic knockout (KO) was confirmed by LDHA proteomic analysis, RT-PCR analysis of LDHA gene expression, and sequencing of reisolated subclones (data not shown). For the B16 KOs, two independent subclones were analyzed, but we chose to present the results of only one of the clones for simplicity. To our surprise, LDHA-KOs for both LS174T and B16 cells were still able to secrete large amounts of lactate under both normoxic and hypoxic conditions, amounting to about 70% of the lactate secreted by WT cells (Fig. 1, E and F). This rather unexpected finding raised the question whether LDHB could catalyze pyruvate reduction to lactate. Therefore, we generated single LDHB-KO and double LDHA/B-DKO cells for both LS174T and B16 cells (Fig. 1 A and C). We initially obtained an LDHA−/−LDHB+/− heterozygote exhibiting an intermediary phenotype in LS174T cells (Fig. 1 A), but for reasons of direct comparability with B16 cells, we did not include any further data for this cell line. Sole LDHB deletion did not influence lactate secretion (Fig. 1, E and F). Only complete disruption of both LDH enzymatic subunits (Fig. 1, A and C) led to complete abolishment of lactate secretion in LS174T and B16 cells under both normoxia and hypoxia (Fig. 1, E and F). In addition, we monitored the ability of LS174T and B16 WT and LDHA/B-DKO cells to reduce pyruvate and oxidize lactate by measuring the spectrophotometric decrease or increase in NADH absorbance, respectively, and expressed reaction rates as the slope of the initial part of the concentration versus time curve (Fig. 2, A–H). It is obvious that the LDHA/B-KOs have lost their ability to catalyze both the forward and the reverse reaction.
Figure 1.

CRISPR/Cas9-induced disruption of LDHA and LDHB protein expression and its effect on lactate secretion in LS174T and B16 cells. A–D, immunoblots of HIF-1α, LDHA, and LDHB and densitometric analysis of the protein expression of LDHA and LDHB 24 h after seeding under normoxia (Nx) and hypoxia (Hx) in LDHA-KO, LDHB-KO, LDHA−/−LDHB+/− (heterozygote, lanes 4 and 9), and LDHA/B-DKO cells compared with WT controls for the human LS174T (A and B) and the murine B16 cell lines (C and D), respectively. HSP60 and tubulin served as loading controls. E and F, concentrations of lactate secreted by WT and single and double LDH-KOs of LS174T (E) and B16 (F) cells grown for 24 h under Nx or 1% Hx. Data were normalized by protein content, and the mean ± S.E. is representative of four independent experiments. *, p < 0.03; **, p < 0.003; ****, p < 0.0001.
Figure 2.

LDHA and LDHB enzymatic activities in LS174T and B16 cells. A–H, enzymatic assays of LDHA (A, B, E, and F) and LDHB (C, D, G, and H) activities in WT and LDHA/B-DKO cells were performed by continuous spectrophotometric rate determination. The decrease in UV absorbance at 340 nm corresponds to NADH + H+ oxidation coupled to pyruvate reduction to lactate, whereas the increase in A340 nm corresponds to NAD+ reduction coupled to lactate oxidation, as shown in the reactions. The numbers next to the absorbance versus time curves represent initial rates of reaction, corresponding to the tangent line slope at time = 1 min. The results depicted are normalized by protein content and are representative of four independent experiments.
LDHA/B-DKO cells shift their metabolism to OXPHOS
To gain further insight into the metabolic status of LDH-KO cells, we measured extracellular acidification rates (ECARs) by means of the Seahorse XF24 extracellular flux analyzer. Upon addition of glucose, both LS174T and B16 single KOs of LDHA and LDHB yielded ECARs comparable with those of WT cells (Fig. 3, A and C). In contrast, LDHA/B-DKO showed a pronounced decrease in ECAR. Subsequent addition of oligomycin, an inhibitor of complex V of the respiratory chain, gave us an estimate of the maximum glycolytic capacity. The ECAR values following oligomycin addition increased in both WT and single KO clones of LS174T and B16 cells. In contrast, addition of oligomycin to LDHA/B-DKO cells reduced the ECAR values to those observed before glucose addition, indicating that oxidative metabolism of glucose substantially contributed to the ECAR of LDHA/B-DKO cells. In the same experiment, oxygen consumption rates (OCRs) were measured, showing that, in LDHA/B-DKO cells, basic respiration and glucose oxidation were more pronounced (Fig. 3, B and D). Also, maximal respiration following FCCP or DNP addition was significantly higher in LDHA-KO cells and, more importantly, in LDHA/B-DKO cells (Fig. 3, B and D).
Figure 3.

Fermentative glycolysis is significantly disrupted, whereas oxidative metabolism of glucose is activated, in LDHA/B-DKO cells. A and C, ECARs of LS174T (A) and B16 (C) WT and LDH-KOs cells under Nx, as analyzed by the Seahorse XF24 bioanalyzer. The mean ± S.E. is representative of three independent experiments performed in quadruplicate. B and D, OCRs of LS174T (B) and B16 (D) WT and LDH-KO cells measured by the Seahorse XF24 bioanalyzer. The mean ± S.E. is representative of four independent experiments performed in quadruplicate. rot, rotenone; antA, antimycin A.
In a complementary series of experiments using respirometry, we analyzed mitochondrial function in intact cells in the presence of cell culture medium (Fig. S1, A–F) as well as in permeabilized cells (Fig. 4, A–E). Analysis of respiration in culture medium revealed higher basal respiration (Fig. S1, A and D) in LDHA-KO and LDHA/B-DKO cells as well as higher oxygen consumption related to ATP production in these cells compared with WT cells (Fig. S1, C and F). Electron transport system (ETS) capacity after uncoupling with FCCP or DNP was also elevated in B16 LDHA-KO and LDHA/B-DKO cells but was difficult to determine in LS174T cells. Moreover, we analyzed maximum OXPHOS and ETS capacity in permeabilized cells in the presence of saturating substrate concentrations for complex I and II (Fig. 4, A–D). Again, in both LDHA-KO and LDHA/B-DKO cells, maximum OXPHOS and ETS capacities were increased compared with WT cells (Fig. 4, A and D). These results, together with the lactate secretion data (Fig. 1, E and F), suggested that the ECAR of LDHA/B-DKO cells following glucose addition was due to carbonic acid rather than lactic acid secretion as a result of increased OXPHOS activity. LDHA-KO cells also showed increased OXPHOS activity, whereas LDHB-KO cells behaved essentially like WT cells.
Figure 4.

Maximal OXPHOS and ETS capacity are increased in LDHA/B-DKO cells. Mitochondrial respiration was determined by high-resolution respirometry. Cells were suspended at a concentration of ∼0.5 × 10⁶ cells/ml in MiR05, and a total of 2.1 ml was added to the Oxygraph chamber. A and C, maximum oxidative phosphorylation capacity was determined in permeabilized cells in the presence of malate (2 mm), glutamate (10 mm), pyruvate (5 mm), succinate (10 mm), and ADP (20 mm). B and D, maximum capacity of the ETS was measured in the decoupled state after stepwise titration of FCCP. Shown are single values and the median of at least three independent experiments. **, p < 0.004; ***, p < 0.0008; ****, p < 0.0001.
Next we investigated whether the increased mitochondrial function was due to increased mitochondrial content. Mitochondrial content was estimated by MitoTracker staining, by determining the mitochondrial-to-nuclear DNA ratio, and the expression of complex IV (COX) and cytochrome c protein. Compared with their respective WT cells, LS174T LDHA/B-DKO cells showed a tentative but insignificant increase in mitochondrial content (Fig. S2, A–C). In contrast, B16 LDHA/B-DKO showed a clear and significant increase in mitochondrial content compared with both WT and single LDH-KO cells (Fig. S2, D–F).
Glucose and glutamine tracing experiments in the WT and LDHA/B-DKO cell lines
We performed 13C tracer experiments in both WT and LDHA/B-DKO cells. The cells were fed with either uniformly d-[U-13C6]glucose or l-[U-13C5]glutamine for 24 h under normoxia. Mean isotope enrichment of 13C-labeled pyruvate, lactate, TCA cycle intermediates, and various amino acids was analyzed by GC/MS and HPLC-MS/MS (Fig. 5, A–H). As expected, the majority of pyruvate and lactate (∼70–80%) in WT cells was labeled upon addition of [U-13C6]glucose. The LDHA/B-DKO cells, on the other hand, showed significant depression of isotopic enrichment of lactate (Fig. 5, A and B). Among the other metabolites, only glycine and proline were less enriched, albeit solely in the B16 LDHA/B-DKO cells, compared with the respective WT cells (Fig. 5, C and D).
Figure 5.

Mean isotopic enrichment of metabolites in WT and LDHA/B-DKO cells. A–H, LS174T and B16 WT and LDHA/B-DKO cells were grown for 24 h with [13C6]glucose (LS174T, A and C; B16, B and D) and [13C5]glutamine (LS174T, E and G, B16, F and H). Intermediates of glycolysis and the TCA cycle (A, B, E, and F) were analyzed by GC/MS and amino acids by HPLC-MS/MS (C, D, G, and H). Three independent experiments were performed. *, p < 0.03; ***, p < 0.001; ****, p < 0.0001.
In the presence of [U-13C5]l-glutamine, both LS174T and B16 WT and LDHA/B-DKO cells showed the expected increase in 13C-labeled TCA cycle intermediates (Fig. 5, E and F). With regard to the other metabolites analyzed, there were distinct differences between the LS174T and B16 cells. LS174T LDHA/B-DKO cells showed significantly greater enrichment of 13C-labeled pyruvate, alanine, glycine, and serine compared with their WT cells (Fig. 5, E and G), whereas, in B16 LDHA/B-DKO cells, only alanine showed significant enrichment, and 13C-labeled proline was less enriched in DKO than in WT cells (Fig. 5, F and H). Both in LS174T and B16 LDHA/B-DKO cells, there was an increase in m+1, m+2, and m+3 isotopologs of alanine, which indicates a higher flux through the citrate or malate shuttle to regenerate NAD+ in the cytosol to compensate for loss of NAD+ production by LDH (Fig. S3, A and B). Interestingly, LS174T and B16 cells differed greatly in the enrichment of 13C-labeled proline regardless of whether LDHA and LDHB had been knocked out (Fig. 5, G and H). In the LS174T cells, enrichment was about 60%, whereas it amounted to only about 10–20% in B16 cells.
LDHA/B-DKO halts cell proliferation in hypoxia and sensitizes tumor cells to phenformin
We compared the rates of proliferation, viability, clonogenicity, and sensitivity to OXPHOS inhibition in both WT and LDHA/B-DKO cells under normoxic and hypoxic (1% O2) conditions. Under normoxia, LS174T KO of either LDHA or LDHB did not differ in proliferation and viability from the WT, whereas LDHA/B-DKO cell proliferation was reduced about 2-fold with no loss of viability (Fig. 6A). Under hypoxia, however, the proliferation rate of LDHA/B-DKO cells was about 20-fold lower than under normoxia (Fig. 6B). The results for B16 cell lines were comparable (Fig. 6, C and D); only the LDHA/B-DKO cells had about a 2-fold reduced rate of proliferation under normoxia, whereas, under hypoxia, no growth of LDHA/B-DKO cells was observed (Fig. 6D). Interestingly, the reduced or restricted growth of LDHA/B-DKO cells under hypoxia was not due to loss of cell viability, as revealed by the percentage of viable cells (Fig. 6, A–D, bars, right scale).
Figure 6.

Cell growth and cell viability of WT and LDH-KO cells under normoxia and 1% hypoxia. A–D, cell proliferation and viability of LS174T (A and B) and B16 (C and D) WT and LDH-KO cells under Nx (A and C) or Hx (B and D) for up to 6 days. The mean ± S.E. is representative of four independent experiments performed in triplicate. **, p < 0.003; ***, p < 0.0003.
The ability to form colonies was analyzed in all LS174T and B16 cell lines, both under normoxia and hypoxia. As shown in Fig. 7A, LS174T LDHA/B-DKO cells formed significantly smaller and fewer colonies compared with the other cell types tested, both under normoxia and hypoxia, in accordance with the proliferation data presented in Fig. 6. In addition, KO of LDHA and, particularly, DKO of LDHA/B made LS174T cells extremely sensitive to 100 μm phenformin, a mitochondrial complex I inhibitor (Fig. 7A). In line with the ECAR and OCR data presented in Fig. 3, metabolic reprogramming of both LS174T and B16 LDHA-KO and LDHA/B-DKO cells toward OXPHOS explains their higher sensitivity to the mitochondrial respiratory chain inhibitors.
Figure 7.
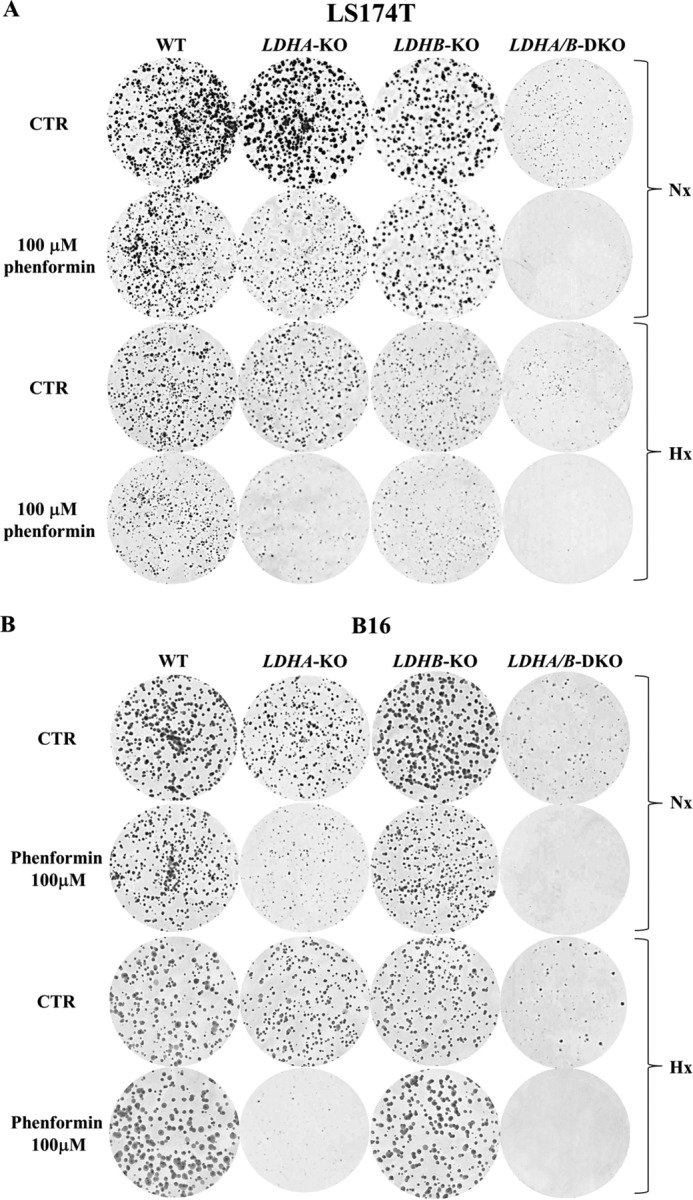
LDHA/B disruption sensitizes tumor cells to phenformin under both normoxia and hypoxia. A and B, clonal growth of LS174T (A) and B16 (B) WT and LDH-KO cells under Nx and Hx, untreated or treated with 100 μm phenformin. The results are representative of three independent experiments. CTR, control.
Treatment with GNE-140 phenocopies LDHA/B double genetic disruption in both the LS174T and B16 cell lines
Recently, Boudreau et al. (27) demonstrated the ability of GNE-140, a specific LDHA and LDHB inhibitor, to cause growth arrest in highly glycolytic pancreatic cancer cell lines such as MiaPaca2. Hence, we were curious to see whether this inhibitor could reactivate OXPHOS without delay and maintain the viability and growth of the WT LS174T and B16 cell lines. We treated WT and LDHA/B-DKO cells with different concentrations of GNE-140 and showed that a concentration of 10 μm, known to collapse LDHA and B activity (27), reduced the growth of the WT but not of the two LDHA/B-DKO cell lines reported here (Fig. 8, A–D). This long-term experiment (9 to 12 days) proved the lack of off-target effects of this compound at the concentration used. Furthermore, we analyzed the metabolic consequences of the short-term GNE-140 treatment of the WT cells by Seahorse bioanalyzer. As shown in Fig. 8, E–H, 1-h treatment with 10 μm GNE-140 was sufficient to phenocopy the effect of the LDHA/B-DKO cells in terms of suppression of glycolysis and reactivation of OXPHOS. Hence, the growth phenotype of DLHA/B-DKO cells does not result from long-term growth selection during the two steps of genetic disruption. This finding, based on genetics and specific pharmacological disruption of LDHA and LDHB, firmly attests that, under normoxia, the Warburg effect is dispensable for in vitro tumor growth.
Figure 8.

GNE-140 treatment phenocopies LDHA/B double genetic disruption. A–D, clonal growth of LS174T (A) and B16 (C) WT and LDHA/B-DKO cells treated with 3 μm and 10 μm GNE-140, respectively, and the corresponding counts of the colonies (B and D). E–H, ECARs and OCRs of LS174T (E and F) and B16 (G and H) WT and LDHA/B-DKO cells and WT cells treated with 10 μm GNE-140 (blue lines). The mean ± S.E. is representative of three independent experiments performed in quadruplicate. glc, glucose; CTR, control; rot, rotenone; antA, antimycin A.
Suppression of the Warburg effect does not suppress in vivo tumor growth
To assess the consequences of LDHA and LDHB disruption on in vivo tumor growth, we performed xenograft experiments on immune-deficient mice with the LS174T and B16 cell lines. As shown in Fig. 9A, LS174T LDHA/B-DKO cells showed, after a lag of ∼3 days compared with WT cells, continuous tumor growth, with the average tumor volume being about half of that of the WT tumors on day 12. Similarly, B16 LDHA/B-DKO tumors grew steadily, with no obvious lag, being about 30% smaller than the corresponding WT tumors on day 12 (Fig. 9B). Single B16 LDHA-KO tumors displayed an intermediate growth rate between those of WT and DKO tumors, whereas growth of LDHB-KO tumors was identical to that of WT tumors (Fig. 9B).
Figure 9.
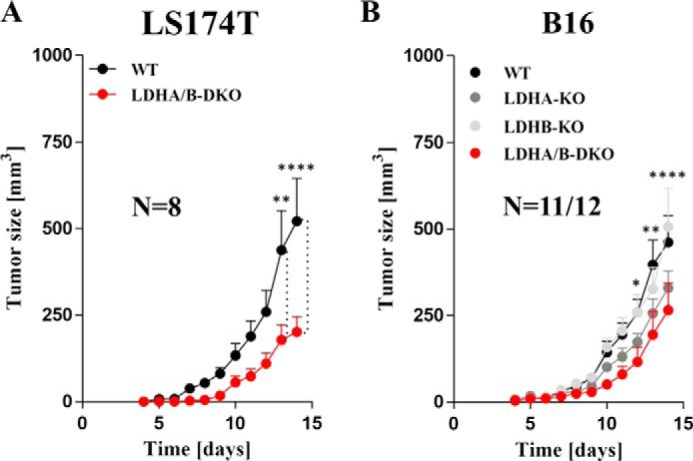
Xenograft tumor growth assays with LS174T and B16 LDHA/B-DKO cells showed a delay but not abolishment of tumor growth. A and B, tumor volumes of WT and LDHA/B-DKO LS174T (A) and WT and Ldha/b-KO B16 xenografts (B). 1 × 10⁵ cells were injected in NSG immune-deficient mice as indicated under “Experimental procedures.” *, p < 0.05; **, p < 0.002; ****, p < 0.0001.
Discussion
Benefits of the Warburg effect
Cancer metabolism has become a major focus in efforts to understand and fight cancer. The reprogramming of metabolic pathways in response to multiple oncogenic, nutritional and oxidative stresses is an elaborate way by which cancer cells respond to high bioenergetic and anabolic demands during tumorigenesis (28–30). The Warburg effect, the preference for fermentative glycolysis, also favored by yeast, is a classic example of metabolic reprogramming allowing cells to meet the metabolic demands of high proliferation. Indeed, cancer “glucose addiction” provides several growth and survival advantages, like rapid ATP availability, high carbon source levels for anabolism, diversion of glycolysis to increase redox status (NADPH) via the glycine–serine pathway (31–33), and massive production of lactic acid (34). By lowering the pH in the tumor environment, lactic acid induces metabolic “dormancy” but also tumor survival in a nutrient and oxygen-deprived environment by its pro-angiogenic and antioxidant action (34–38). Last but not least, lactic acid is involved in tumor immune response (39, 40). Our own data show that the reduction of tumor lactic acid by silencing LDHA reactivated the immune response by T and NK cells (12). Furthermore, a more recent publication suggested that inhibition of glycolysis by an LDHA inhibitor allowed effective immunotherapy by lowering lactate levels (41). These findings are in line with the work by Fantin et al. (14), who had already shown earlier that LDHA silencing reduced LDHA activity, stimulated respiration in vitro, and reduced the tumorigenicity of murine breast cancer cells in a syngeneic immunocompetent in vivo model. Le et al. (15) also reported that LDHA silencing as well as pharmacologic inhibition of LDHA by FX11 resulted in increased OXPHOS in vitro and reduced growth of human lymphoma and pancreatic cancer xenografts. In our experiments, we also detected an increase in OXPHOS after deletion of LDHA in B16 but not in LS174T cells. However, double knockout of both isoenzymes clearly shifted tumor metabolism to OXPHOS, indicating that tumor cells are metabolically flexible. In contrast to the results of Le et al. (15), we did not find a reduction of tumor growth in our xenograft model by targeting LDHA; in our hands, only elimination of both LDHA and LDHB was effective in reducing tumor growth. A possible explanation for this discrepancy is that FX11, like many LDHA inhibitors that have been developed in academia and by major pharmaceutical groups, inhibits both LDH enzymatic subunits with some additional off-target effects, precluding entry into the clinic (11, 42).
Complementary metabolic function of LDHA and LDHB in tumor cells
In contrast to earlier data that had not detected a difference in substrate specificity between LDHA and LDHB regarding lactate versus pyruvate (24), the majority of today's literature postulates that only hypoxia-inducible LDHA favors the conversion of pyruvate to lactate and is mainly responsible for the glycolytic phenotype and lactate secretion in tumors. Our data challenge this point of view; knockout of LDHA had only a moderate effect on lactate secretion, even under hypoxia (Fig. 2, E and F) and failed to suppress tumor growth. This clearly demonstrates that LDHB is capable of substituting LDHA under metabolic pressure. In line with the preserved production of lactate and glucose consumption in either LDHA- or LDHB-disrupted cells, metabolomic analysis showed that there is no difference in metabolic flux. Moreover, comparing glucose and glutamine flux between WT and LDHA/B-DKO cells revealed only moderate changes; more glutamine-derived pyruvate was detected in LDHA/B-DKO cells. These increased pyruvate levels probably contribute to alanine synthesis, given the increased glutamine-derived alanine labeling in LDHA/B-DKO cells.
Apart from their role in the regulation of the redox status, epigenetics, and genome maintenance, glycine and serine are also precursors for a variety of biosynthetic reactions in tumor cells (31). In LS174T cells, glutamine-derived glycine and serine were present only in LDHA/B-DKO cells, suggesting that one-carbon metabolism might contribute to amino acid and nucleotide synthesis in these cells.
When genetics meets pharmacology: Clinical perspectives
The question whether the Warburg effect and high glycolytic rate are essential tumor phenotypes or are dispensable for cancer growth is under debate. The genetic study reported here, with two glycolytic and fast growing cell lines, demonstrates unequivocally that complete suppression of fermentative glycolysis does not fully suppress in vitro growth and allows tumor xenografts to develop, although more slowly, at a 2-fold reduced rate. However, the Warburg effect, in contrast to OXPHOS, provides a clear growth advantage to cancer cells: the fastest growth rate and proliferation in a hypoxic microenvironment.
Why do LDHA and LDHB need to be suppressed to collapse the Warburg effect? How is resilient tumor growth still possible under these conditions? The efficiency of glucose fermentation in rapid ATP formation and growth relies on the reduction of pyruvate to lactate by LDHA. This is the key step allowing NAD+ regeneration to keep ATP-derived glycolysis running. This step is so essential that LDHA-KO cells, through intracellular pyruvate pool elevation, manage to reverse the mode of action of LDHB (22, 26), keeping Warburg effect intact and the tumor growth rate unchanged. Following combined deletion of LDHA and LDHB, NAD+ regeneration relies on mitochondrial complex I and oxygen consumption for ATP formation and growth. Under these conditions, growth is only possible in an oxygenated environment by reactivation of OXPHOS, as shown by metabolic rewiring (Fig. 3) and phenformin sensitivity (Fig. 7, A and B). In contrast, a low oxygen level (1%) sufficed to stop in vitro growth of LDHA/B-DKO tumor cells with no loss of viability.
The present conclusions regarding LDHA/B-DKO are strongly reinforced by our independent approach disrupting the upstream glycolytic enzyme glucose-6-phosphate isomerase (GPI) in the same cancer cell lines (43) or earlier studies of transformed fibroblasts (44, 45). Both GPI-KO cell lines, LS174T and B16, had severely reduced glucose consumption and completely suppressed lactic acid secretion, which made them rely on oxidative phosphorylation for their energy production (43). As was the case with LDHA/B-DKO, growth under hypoxia was severely restricted; in vivo, GPI-KO xenografts developed at a 2-fold reduced rate compared with GPI-WT. This increased dependence on OXPHOS resulted in higher sensitivity to mitochondrial respiration inhibitors in both LDHA/B-DKO and GPI-KO cell lines. Phenformin treatment completely eradicated LDHA/B-DKO colonies, suggesting that dual inhibition of glycolysis and mitochondrial metabolism holds more promise and should be investigated as a potential treatment, as we already suggested (46).
Interestingly, reassessment of the Warburg effect in cancer obtained by genetic disruption of two distinct steps of the glycolytic pathway is in full agreement with the findings reported regarding GNE-140 (27), the first specific pharmacologic dual inhibitor of LDHA and LDHB, to the best of our knowledge (Fig. 8, A–H). The pharmacologic/genetic convergence is a key argument demonstrating that growth resilience in the genetically disrupted Warburg effect cannot be explained by secondary genetic adaptation during the 3–4 weeks of CRISPR-Cas9 selection.
Finally, there is a specific case in which blunting glycolysis of LS174T cells and the concomitant reactivation of OXPHOS suppressed tumor growth (47). This was obtained by disrupting the cellular export of lactic acid, the ultimate step of the glycolytic pathway controlled by the two lactic acid transporters MCT1 and MCT4 (48). In this case, lactic acid is formed but sequestered, thus producing intracellular acidosis, which is recognized to inhibit mTORC1 (49, 50) and to induce cytostatic growth arrest, as we reported previously (46, 47).
In summary, the “glycolytic Warburg phenotype” of tumor cells depends on both LDHA and LDHB expression and seems not to represent an essential tumor phenotype, as it can, at least in immunodeficient mice, be replaced by OXPHOS. This shift in the metabolic strategy upon LDHA/B knockdown allows tumor growth and suggests that the therapeutic targeting of cancer energy metabolism should consider that only dual targeting of oxidative metabolism and glycolysis might be effective. In the context of immunotherapeutic strategies, combined targeting of LDHA and LDHB could represent a promising strategy to improve the response in patients. However, it remains to be explored whether the increased release of carbonic acid occurring upon OXPHOS reactivation in LDHA/B-DKO does not compromise the tumor immune response.
Experimental procedures
Cell culture and hypoxic exposure conditions
Human colon adenocarcinoma LS174T cells (kindly provided by Dr. Van de Wetering) and mouse B16 F10 cells were grown, unless otherwise specified, in Dulbecco's modified Eagle's medium (DMEM) (Gibco by Life Technologies) and RPMI medium, supplemented with fetal bovine serum (10%), penicillin (10 units/ml), and streptomycin (10 μg/ml). Under normoxic conditions, cells were incubated in a humidified atmosphere with 5% CO2/21% O2 at 37 °C. Under hypoxic conditions, the cells were maintained in 1% O2 in a sealed anaerobic work station (INVIVO2 400, Ruskinn Technology Ltd., Bridgend, South Wales), where the air was replaced by N2, and CO2 was maintained at 5%.
CRISPR/Cas9-mediated knockout of the mouse and human LDHA and LDHB genes
To obtain LDHA and LDHB single knockouts, human LS174T cells and mouse B16-F10 cells were transfected with CRISPR/Cas9 using a pSpCas9(BB)-2A-GFP (PX458) plasmid that had been donated by Feng Zhang (Addgene plasmid 48138) (51). Single guide RNAs (sgRNAs) targeting the exonic regions of the murine and human LDHA and LDHB gene were designed using the http://crispr.mit.edu website 11 (52) and cloned into the BbsI sites of the pSpCas9(BB)-2A-GFP (pX458) plasmid. Transfections were performed with Lipofectamine (Polyplus Transfection, Illkirch, France), and GFP-positive cells were detected by cell sorting (FACS). Each clone was analyzed for LDHA and LDHB protein expression by immunoblot. Finally, two independent LDHA and LDHB knockout clones for each cell line were selected and subcloned to obtain a pure cell population. Because the findings obtained were identical for the two clones of a cell line throughout the study, we show only the results obtained for one clone each. LDHA/B-DKO cell lines were obtained by transfecting LS174T and B16 LDHA-KO subclones with LDHB CRISPR.
Immunoblotting
Cells were lysed with SDS buffer, and the protein concentration was determined by BCA assay (Interchim, Montluçon, France). Proteins (40 μg) were separated by SDS-PAGE (10%) and transferred onto a polyvinylidene difluoride membrane (Immobilon, Merck Millipore Ltd., Tullagreen, Carrigtwohill, County Cork, Ireland). Membranes were blocked in 5% nonfat milk in TN buffer (50 mm Tris-HCl (pH 7.4) and 150 mm NaCl) and blotted with antibodies against LDHA (Abcam, ab208093), LDHB (Abcam, ab85319), and HIF-1α (rabbit anti-human/mouse polyclonal antibody, produced in our laboratory). Antibodies against tubulin (Invitrogen, 32-2500) and HSP60 (D6F1, rabbit monoclonal, 12165, Cell Signaling Technology) were used as loading controls. Immunoreactive bands were detected by the ECL system (Millipore Corp., Billerica, MA) after incubation of the membranes with secondary anti-mouse or anti-rabbit antibodies (Promega) and visualized using the GeneSys software (Syngene, Cambridge, UK). Densitometry was performed using Fiji software.
Quantitative proteome analysis by LC-SWATH-MS
Cell pellets were solubilized in 1.2% SDS and 20 mm sodium phosphate (pH 7.5), and protein amounts were measured using the FluoroProfile kit (Sigma-Aldrich). Samples were diluted to 1 μg of protein/μl using gel-aided sample preparation (GASP) buffer (4% SDS, 100 mm DTT, 6 m urea, and 1.5 m thiourea), and 50 μg of total protein was subjected to proteolytic digestion using the GASP protocol (53). 5 μg of the resulting peptide mixtures was spiked with 100 fmol of the retention time standard RePLiCal (Polyquant GmbH, Bad Abbach, Germany) and analyzed using an Eksigent NanoLC 400 system directly coupled to a TripleTOF 5600+TM Q-TOF mass spectrometer. For analysis of the B16 cell line samples, the peptides were separated on a ChromXP Halo C18 column (150 × 0.3-mm internal diameter, 2.7-μm particle size, flow rate of 6 μl/min) using a 76-min binary gradient from 2–40% B (A, 0.1% formic acid; B, 0.1% formic acid in acetonitrile), whereas, for the LS174T samples, a 100-min gradient from 2–40% B on a 150 × 0.3-mm internal diameter reverse-phase column (YMC-TriartC18, 1.9 μm, 120 Å, flow rate of 6 μl/min) was used. The sequential window acquisition of all theoretical fragment-ion spectra (SWATCH) runs for B16 samples were accomplished using a 50-ms full MS scan from 400–1,000 m/z and 60 subsequent SWATH windows of variable size for 40 ms each (mass range, 230–1,500 m/z). The respective libraries were generated from the same samples measured in independent data acquisition (IDA) mode using the TOP25 method with a full MS scan for 250 ms and MS/MS scans for 50 ms each. The mass ranges were the same as in SWATH mode. In the case of the human cell lines, the SWATH runs were conducted using a 50-ms full MS scan (400–1,000 m/z) and 60 SWATH windows of variable size for 35 ms each (230–1,500 m/z). Data-dependent acquisition (DDA) runs for library generation were done in a TOP20 fashion with a 250-ms full MS scan and 50-ms MS/MS scans (same mass ranges as SWATH mode).
MS/MS spectra from the independent data acquisition runs were searched against the respective UniProt database (mouse or human) using ProteinPilot 4.5 and imported in PeakView 2.1 using the SWATH MicroApp 2.0 allowing six peptides per proteins and five transitions per peptide. Statistical analysis was done with IBM SPSS 23 using univariate ANOVA and post hoc Dunnett tests against the control for the B16 knockout clones LdhA-KO, LdhB-KO, and LdhA/B-DKO and t tests in the case of the human cell line LS174T; only the double knockout was compared with the control. The p values were corrected for multiple testing using the false discovery rate (FDR) according to Benjamini and Hochberg (54).
Extracellular lactate level measurement
Cells (1 × 10⁶) were seeded in 10-cm dishes and incubated for 24 h under normoxia and hypoxia. Thereafter, 500 μl of supernatant was taken and centrifuged at 8,000 × g and 4 °C for 5 min, and lactate levels were analyzed by the Cobass c701 (Roche Diagnostics) in the biochemistry laboratory of the Nice University Hospital, as described in Ref. 43. Briefly, the method used is based on the enzymatic conversion of lactate into pyruvate by the lactate oxidase, coupled with the colorimetric reaction of hydrogen peroxide formed in the first reaction with the hydrogen donor, resulting in the formation of a colored compound, the intensity of which is measured spectrophotometrically and is directly proportional to the concentration of lactate. Three independent experiments were performed in duplicate, and the results were normalized to the quantity of total protein and expressed as millimolar lactate per microgram of protein.
Preparation of cell extracts for enzymatic assays
Cells (1 × 10⁵) were seeded in 6-well plates. After 24 h of incubation under normoxia and hypoxia, the cells were transferred onto ice, washed once with 2 ml each of cold PBS and distilled H2O, followed by addition of 300 μl of distilled H2O and stored at −80 °C for at least 10 min. Cells were placed on ice again, transferred into Eppendorf tubes by scraping, and centrifuged at 4 °C (8,000 × g for 10 min), and the supernatant corresponding to the cell extract was transferred to new tubes and stored at −80 °C if not analyzed immediately.
Enzymatic activity assays
Enzymatic activities of LDHA and LDHB in WT and double LDH-KO cells were measured by continuous spectrophotometric rate determination (Glomax, Promega BioSystems Inc., Sunnyvale, CA). LDHA activity was determined by monitoring the decrease in absorbance at 340 nm, corresponding to NADH oxidation, coupled with pyruvate reduction to lactate. Assays were performed at pH 7.4 and 25 °C and started by adding 6 μl of cell extract to the reaction mixture containing 200 mm Tris-HCl (pH 7.4), 1 mm sodium pyruvate, and 0.5 mm NADH. LDHB activity was monitored in the same way, but to push the reaction in the direction of lactate oxidation to pyruvate, 0.5 m glycine buffer (pH 9.5), was used. Coupled β-NAD+ reduction was monitored as an increase in absorbance at 340 nm, and 216.7 mm hydrazine was added to the reaction mixture to prevent product inhibition and reversibility of the reaction by nonenzymatic binding to pyruvate (18). In both reactions, all components were added in excess so that only LDHA or LDHB enzyme activity would be rate-limiting. Hence, the activity of the enzyme is proportional to the initial rate of the reaction, and the activities were obtained as the tangent to the initial part of the absorbance versus time curve. Five independent experiments were performed per sample and enzyme, and values normalized to microgram of protein are presented.
Metabolic flux analysis
OCRs and ECARs of cells were analyzed by the Seahorse XF24 extracellular flux analyzer (Seahorse Bioscience). Cells were seeded on Seahorse plates and grown for 24 h to form a confluent layer. One hour prior to measurement, cell culture media were replaced with the assay medium without glucose, pyruvate, serum, and buffer (D5030, Sigma), and the plates were incubated in a non-CO2 incubator at 37 °C. Basal levels of OCR and ECAR were recorded for 24 min, followed by a mitochondrial stress test (1 μm oligomycin, 3 μm FCCP or 100 μm DNP, and 1 μm rotenone/1 μm antimycin A). Normalization to protein content was performed after each experiment, and data were presented as milli-pH units (mpH) per minute per microgram of protein for ECAR and as picomoles of O2 per minute per microgram of protein for OCR.
High-resolution respirometry
Mitochondrial respiratory activity was analyzed in a two-channel titration injection respirometer (Oxygraph-2k, Oroboros Instruments, Innsbruck, Austria) at 37 °C. Two different protocols were applied. Cells were harvested, resuspended in culture medium or mitochondrial medium (MiR05), and transferred to the Oxygraph chambers at a final cell density of ∼1 × 10⁶ cells/ml. In the first substrate–uncoupler–inhibitor titration protocol, basal respiration (no additions), LEAK respiration (oligomycin-inhibited, 2 μg/ml) and maximum capacity of the ETS, and stepwise titration of carbonyl cyanide p-trifluoromethoxyphenylhydrazone (FCCP, 2 μm) were determined in intact cells in culture medium. Residual oxygen consumption (ROX) was determined after the addition of rotenone (0.5 μm) and myxothiozol (2.5 μm), and all respiratory parameters were corrected for ROX. Oxygen consumption available for ATP production (free basal respiration, O2-ATP) was calculated by subtracting LEAK from basal respiration. In the second protocol, cells were resuspended in MiR05. After a stabilization phase, malate (2 mm) was added, the plasma membrane was permeabilized with digitonin (8.1 μm), and the maximum capacity of the oxidative phosphorylation system (OXPHOS) was measured after addition of glutamate (10 mm), pyruvate (5 mm), ADP (20 mm), and succinate (10 mm). Subsequently, ETS capacity was determined after FCCP titration as described above. OXPHOS and ETS were corrected for ROX.
13C tracer experiments
Analyses of amino acids and organic acids from stable isotope tracer experiments were performed using HPLC-MS/MS and GC-MS after derivatization, respectively, as described recently (55). All expected isotopologs were analyzed. Correction for natural stable isotope abundance and tracer impurity in the tracing experiments was performed using an in-house tool (IsoCorrectoR) to correct MS/MS data and IsoCor for full MS data (56). Mean isotope enrichment is calculated based on the relative isotopolog fractions:
| (Eq. 1) |
Mi is the relative fraction of the isotopolog containing i tracer atoms, and n is the number of tracer element atoms in the molecule (C-atoms for 13C tracing) (56).
Proliferation and cell viability assay
Cells (5 × 10⁴ for LS174T and 2 × 10⁴ for B16) were seeded in 6-well plates in triplicate per cell line and condition. 24 h after seeding, the cells were detached by trypsinization and counted by an automatic cell counter (ADAM-MCTM, Digital Bio, NanoEnTek Inc., Seoul, Korea) on days 0, 3, 4, and 6 for LS174T and days 0, 3, and 4 for B16 cells. The cell proliferation index was calculated by dividing the cell counts obtained on days 3, 4, and 6 by the count obtained 24 h after seeding (day 0).
For determination of cell viability, cells were washed 24 h after adhesion with PBS, trypsinized, centrifuged (5 min, 259 × g), added to the supernatant taken previously, and resuspended in propidium iodide solution to discriminate between live and dead cells. Three independent experiments were performed in duplicate.
Clonogenic viability assay
Cells (1 × 10³) were seeded on 60-mm plates and incubated for 24 h, and then the medium was replaced with DMEM supplemented with 10% fetal bovine serum with or without the addition of 100 μm phenformin. After 8–10 days under normoxia and 12–15 days under hypoxia (1% O2), colonies were stained with 5% Giemsa solution (Sigma-Aldrich, Hannover, Germany) for 30 min for colony visualization.
Tumor xenografts
For B16 cell lines, animal experiments were performed according to the regulations of the government of the Upper Palatinate, Regensburg, Germany. For LS174T cell lines, animal experiments were performed according to the regulations approved by the animal experimentation protocol of the local animal care committee (Veterinary Service and Direction of Sanitary and Social Action of Monaco, Dr. H. Raps).
1 × 10⁵ tumor cells were injected subcutaneously in 50 μl of RPMI 1640 in the dorsal region of 9 week-old immune-deficient NOD scid γ (NSG) mice. Animals were monitored on a daily basis for tumor size and their general condition. Tumor dimensions were estimated by measurements of the short (a) and long (b) axis of the mass daily using a caliper, and tumor volume was calculated applying the following formula: V = p/6 × 0.5 × a2 × b.
Mitochondrial DNA analysis
Cells (1 × 10⁶) were seeded in 10-cm dishes, and after 24 h of incubation, DNA extraction was performed using the AllPrep DNA/RNA kit (Qiagen GmbH, Hilden, Germany). 30 and 0.3 ng of total DNA were employed for LS174T and B16 cells, respectively, to determine the ratio of mtDNA to nuclear DNA by quantitative PCR of subunit 1 of hNADH-dehydrogenase or NADH-ubiquinone oxidoreductase (hND1) and hLPL (lipoprotein lipase) for LS174T and mCytB (cytochrome b) and mACT (actin) for B16 cells, respectively, using the ddCt method. Oligonucleotides for hND1 (F_CCCTAAAACCCGCCACATCT, R_GAGCGATGGTGAGAGCTAAGGT), hLPL (F_CGAGTCGTCTTTCTCCTGATGAT, R_TTCTGGATTCCAATGCTTCGA), mCytB (F_CCACTTCATCTTACCATTTATTATCGC, R_TTTTATCTGCATCTGAGTTTAA), and mACT (F_CTGCCTGACGGCCAGG, R_CTATGGCCTCAGGAGTTTTGTC) were kindly provided by Dr. D. Pisani (IBV, Nice, France). Quantitative PCR was performed with TakyonTM Rox SYBR MasterMix dTTP Blue (Eurogentec, Seraing, Belgium) on a StepOnePlus real-time PCR machine (Applied Biosystems, Life Technologies).
Statistical analysis
Results were expressed as mean ± S.E., and statistical analysis was performed using analysis of variance followed by nonparametric tests using GraphPad Prism 5 software. The differences between the groups were considered significant when p < 0.05.
Author contributions
M. Ž., A. B., K. D., K. R., J. P., and M. K. conceptualization; M. Ž. and A. B. data curation; M. Ž., A. B., K. R., J. P., and M. K. supervision; M. Ž., J. P., and M. K. funding acquisition; M. Ž., A. B., L. D. I., K. D., J. R., K. S., S.-M. D., B. F.-A., J. D., M. E., P. J. O., and J. P. investigation; M. Ž., A. B., L. D. I., K. D., J. R., K. S., K. P., A. S., C. B., G. K., B. F.-A., J. D., P. B., M. E., P. J. O., and K. R. methodology; M. Ž., A. B., and J. P. writing-original draft; M. Ž. and J. P. project administration; M. Ž., A. B., P. J. O., K. R., J. P., and M. K. writing-review and editing; A. B., K. D., J. R., K. S., and K. P. formal analysis; L. D. I. and B. F.-A. validation; K. D., J. R., K. S., and P. J. O. software; M. E., T. O., and P. J. O. resources; L. D. I. work done in Nice as a training scholarship; K. P. contributed to the manuscript; A. S., C. B., and G. K. animal experimentation; J. D. CRISPR-Cas9 gRNA design; P. B. enzymatic assays; P. J. O. metabolomics.
Supplementary Material
Acknowledgments
We thank Ludovic Cervera for cell sorting assistance on the CytoMed platform at the flow cytometry facility at the Institute for Research on Cancer and Aging, Nice (IRCAN). The materials of CytoMed were supported by Conseil Général 06, Fonds européen de développement régional (FEDER), the Ministère de l'Enseignement Supérieur, the Région Provence Alpes-Côte d'Azur, and INSERM. We also thank Claude Fabre and Claire Tworek, technicians in the clinical chemistry laboratory at the University Hospital of Nice. We thank Milica Vučetić and Valérie Vial for help with mouse experiments at Centre Scientifique de Monaco (CSM), Monaco.
The authors declare that they have no conflicts of interest with the contents of this article.
This article contains Figs. S1–S3.
Please note that the JBC is not responsible for the long-term archiving and maintenance of this site or any other third party–hosted site.
- LDH
- lactate dehydrogenase
- KO
- knockout
- DKO
- double knockout
- ECAR
- extracellular acidification rate
- OXPHOS
- oxidative phosphorylation
- OCR
- oxygen consumption rate
- FCCP
- carbonyl cyanide p-trifluoromethoxyphenylhydrazone
- DNP
- 2,4-dinitrophenol
- ETS
- electron transport system
- GPI
- glucose-6-phosphate isomerase
- ROX
- residual oxygen consumption
- Nx
- normoxia
- Hx
- hypoxia
- DMEM
- Dulbecco's modified Eagle's medium
- TCA
- tricarboxylic acid
- SWATH
- sequential window acquisition of all theoretical fragment-ion spectra.
References
- 1. Warburg O. (1956) On respiratory impairment in cancer cells. Science 124, 269–270 [PubMed] [Google Scholar]
- 2. Kroemer G., and Pouyssegur J. (2008) Tumor cell metabolism: cancer's Achilles' heel. Cancer Cell 13, 472–482 10.1016/j.ccr.2008.05.005 [DOI] [PubMed] [Google Scholar]
- 3. Vander Heiden M. G., Cantley L. C., and Thompson C. B. (2009) Understanding the Warburg effect: the metabolic requirements of cell proliferation. Science 324, 1029–1033 10.1126/science.1160809 [DOI] [PMC free article] [PubMed] [Google Scholar]
- 4. Hay N. (2016) Reprogramming glucose metabolism in cancer: can it be exploited for cancer therapy? Nat. Rev. Cancer 16, 635–649 10.1038/nrc.2016.77 [DOI] [PMC free article] [PubMed] [Google Scholar]
- 5. Brahimi-Horn M. C., Bellot G., and Pouyssegur J. (2011) Hypoxia and energetic tumour metabolism. Curr. Opin. Genet. Dev. 21, 67–72 10.1016/j.gde.2010.10.006 [DOI] [PubMed] [Google Scholar]
- 6. Hsieh A. L., Walton Z. E., Altman B. J., Stine Z. E., and Dang C. V. (2015) MYC and metabolism on the path to cancer. Semin. Cell Dev. Biol. 43, 11–21 [DOI] [PMC free article] [PubMed] [Google Scholar]
- 7. Hubbi M. E., and Semenza G. L. (2015) Regulation of cell proliferation by hypoxia-inducible factors. Am. J. Physiol. Cell Physiol. 309, C775–C782 10.1152/ajpcell.00279.2015 [DOI] [PMC free article] [PubMed] [Google Scholar]
- 8. Chae Y. C., Vaira V., Caino M. C., Tang H. Y., Seo J. H., Kossenkov A. V., Ottobrini L., Martelli C., Lucignani G., Bertolini I., Locatelli M., Bryant K. G., Ghosh J. C., Lisanti S., Ku B., et al. (2016) Mitochondrial Akt regulation of hypoxic tumor reprogramming. Cancer Cell 30, 257–272 10.1016/j.ccell.2016.07.004 [DOI] [PMC free article] [PubMed] [Google Scholar]
- 9. Kim J. W., Tchernyshyov I., Semenza G. L., and Dang C. V. (2006) HIF-1-mediated expression of pyruvate dehydrogenase kinase: a metabolic switch required for cellular adaptation to hypoxia. Cell Metab. 3, 177–185 10.1016/j.cmet.2006.02.002 [DOI] [PubMed] [Google Scholar]
- 10. Hirschhaeuser F., Sattler U. G., and Mueller-Klieser W. (2011) Lactate: a metabolic key player in cancer. Cancer Res. 71, 6921–6925 10.1158/0008-5472.CAN-11-1457 [DOI] [PubMed] [Google Scholar]
- 11. Augoff K., Hryniewicz-Jankowska A., and Tabola R. (2015) Lactate dehydrogenase 5: an old friend and a new hope in the war on cancer. Cancer Lett. 358, 1–7 10.1016/j.canlet.2014.12.035 [DOI] [PubMed] [Google Scholar]
- 12. Brand A., Singer K., Koehl G. E., Kolitzus M., Schoenhammer G., Thiel A., Matos C., Bruss C., Klobuch S., Peter K., Kastenberger M., Bogdan C., Schleicher U., Mackensen A., Ullrich E., et al. (2016) LDHA-associated lactic acid production blunts tumor immunosurveillance by T and NK Cells. Cell Metab. 24, 657–671 10.1016/j.cmet.2016.08.011 [DOI] [PubMed] [Google Scholar]
- 13. Fischer K., Hoffmann P., Voelkl S., Meidenbauer N., Ammer J., Edinger M., Gottfried E., Schwarz S., Rothe G., Hoves S., Renner K., Timischl B., Mackensen A., Kunz-Schughart L., Andreesen R., Krause S. W., and Kreutz M. (2007) Inhibitory effect of tumor cell-derived lactic acid on human T cells. Blood 109, 3812–3819 10.1182/blood-2006-07-035972 [DOI] [PubMed] [Google Scholar]
- 14. Fantin V. R., St-Pierre J., and Leder P. (2006) Attenuation of LDH-A expression uncovers a link between glycolysis, mitochondrial physiology, and tumor maintenance. Cancer Cell 9, 425–434 10.1016/j.ccr.2006.04.023 [DOI] [PubMed] [Google Scholar]
- 15. Le A., Cooper C. R., Gouw A. M., Dinavahi R., Maitra A., Deck L. M., Royer R. E., Vander Jagt D. L., Semenza G. L., and Dang C. V. (2010) Inhibition of lactate dehydrogenase A induces oxidative stress and inhibits tumor progression. Proc. Natl. Acad. Sci. U.S.A. 107, 2037–2042 10.1073/pnas.0914433107 [DOI] [PMC free article] [PubMed] [Google Scholar]
- 16. Sheng S. L., Liu J. J., Dai Y. H., Sun X. G., Xiong X. P., and Huang G. (2012) Knockdown of lactate dehydrogenase A suppresses tumor growth and metastasis of human hepatocellular carcinoma. FEBS J. 279, 3898–3910 10.1111/j.1742-4658.2012.08748.x [DOI] [PubMed] [Google Scholar]
- 17. Wang Z. Y., Loo T. Y., Shen J. G., Wang N., Wang D. M., Yang D. P., Mo S. L., Guan X. Y., and Chen J. P. (2012) LDH-A silencing suppresses breast cancer tumorigenicity through induction of oxidative stress mediated mitochondrial pathway apoptosis. Breast Cancer Res. Treat. 131, 791–800 10.1007/s10549-011-1466-6 [DOI] [PubMed] [Google Scholar]
- 18. Xie H., Hanai J., Ren J. G., Kats L., Burgess K., Bhargava P., Signoretti S., Billiard J., Duffy K. J., Grant A., Wang X., Lorkiewicz P. K., Schatzman S., Bousamra M. 2nd, Lane A. N., et al. (2014) Targeting lactate dehydrogenase–a inhibits tumorigenesis and tumor progression in mouse models of lung cancer and impacts tumor-initiating cells. Cell Metab. 19, 795–809 10.1016/j.cmet.2014.03.003 [DOI] [PMC free article] [PubMed] [Google Scholar]
- 19. McCleland M. L., Adler A. S., Shang Y., Hunsaker T., Truong T., Peterson D., Torres E., Li L., Haley B., Stephan J. P., Belvin M., Hatzivassiliou G., Blackwood E. M., Corson L., Evangelista M., et al. (2012) An integrated genomic screen identifies LDHB as an essential gene for triple-negative breast cancer. Cancer Res. 72, 5812–5823 10.1158/0008-5472.CAN-12-1098 [DOI] [PubMed] [Google Scholar]
- 20. McCleland M. L., Adler A. S., Deming L., Cosino E., Lee L., Blackwood E. M., Solon M., Tao J., Li L., Shames D., Jackson E., Forrest W. F., and Firestein R. (2013) Lactate dehydrogenase B is required for the growth of KRAS-dependent lung adenocarcinomas. Clin. Cancer Res. 19, 773–784 10.1158/1078-0432.CCR-12-2638 [DOI] [PubMed] [Google Scholar]
- 21. Sun W., Zhang X., Ding X., Li H., Geng M., Xie Z., Wu H., and Huang M. (2015) Lactate dehydrogenase B is associated with the response to neoadjuvant chemotherapy in oral squamous cell carcinoma. PLoS ONE 10, e0125976 10.1371/journal.pone.0125976 [DOI] [PMC free article] [PubMed] [Google Scholar]
- 22. Markert C. L., and Møller F. (1959) Multiple forms of enzymes: tissue, ontogenetic, and species specific patterns. Proc. Natl. Acad. Sci. U.S.A. 45, 753–763 10.1073/pnas.45.5.753 [DOI] [PMC free article] [PubMed] [Google Scholar]
- 23. Koen A. L., and Goodman M. (1969) Lactate dehydrogenase isozymes: qualitative and quantitative changes during primate evolution. Biochem. Genet. 3, 457–474 10.1007/BF00485606 [DOI] [PubMed] [Google Scholar]
- 24. Vesell E. S. (1965) Lactate dehydrogenase isozymes: substrate inhibition in various human tissues. Science 150, 1590–1593 10.1126/science.150.3703.1590 [DOI] [PubMed] [Google Scholar]
- 25. Vanderlinde R. E. (1985) Measurement of total lactate dehydrogenase activity. Ann. Clin. Lab. Sci. 15, 13–31 [PubMed] [Google Scholar]
- 26. Goldberg E. (1971) Immunochemical specificity of lactate dehydrogenase-X. Proc. Natl. Acad. Sci. U.S.A. 68, 349–352 10.1073/pnas.68.2.349 [DOI] [PMC free article] [PubMed] [Google Scholar]
- 27. Boudreau A., Purkey H. E., Hitz A., Robarge K., Peterson D., Labadie S., Kwong M., Hong R., Gao M., Del Nagro C., Pusapati R., Ma S., Salphati L., Pang J., Zhou A., et al. (2016) Metabolic plasticity underpins innate and acquired resistance to LDHA inhibition. Nat. Chem. Biol. 12, 779–786 10.1038/nchembio.2143 [DOI] [PubMed] [Google Scholar]
- 28. Costa A. S. H., and Frezza C. (2017) Metabolic reprogramming and oncogenesis: one hallmark, many organelles. Int. Rev. Cell Mol. Biol. 332, 213–231 10.1016/bs.ircmb.2017.01.001 [DOI] [PubMed] [Google Scholar]
- 29. Vander Heiden M. G., and DeBerardinis R. J. (2017) Understanding the intersections between metabolism and cancer biology. Cell 168, 657–669 10.1016/j.cell.2016.12.039 [DOI] [PMC free article] [PubMed] [Google Scholar]
- 30. Vucetic M., Cormerais Y., Parks S. K., and Pouyssegur J. (2018) The central role of amino acids in cancer redox homeostasis: vulnerability points of the cancer redox code. Front. Oncol. [DOI] [PMC free article] [PubMed] [Google Scholar]
- 31. Locasale J. W. (2013) Serine, glycine and one-carbon units: cancer metabolism in full circle. Nat. Rev. Cancer 13, 572–583 10.1038/nrc3557 [DOI] [PMC free article] [PubMed] [Google Scholar]
- 32. Liberti M. V., and Locasale J. W. (2016) The Warburg effect: how does it benefit cancer cells? Trends Biochem. Sci. 41, 211–218 10.1016/j.tibs.2015.12.001 [DOI] [PMC free article] [PubMed] [Google Scholar]
- 33. Semenza G. L. (2017) Hypoxia-inducible factors: coupling glucose metabolism and redox regulation with induction of the breast cancer stem cell phenotype. EMBO J. 36, 252–259 10.15252/embj.201695204 [DOI] [PMC free article] [PubMed] [Google Scholar]
- 34. Gillies R. J. (2001) The tumour microenvironment: causes and consequences of hypoxia and acidity. Introduction. Novartis Foundation Symposium 240, 1–6 [PubMed] [Google Scholar]
- 35. Parks S. K., Mazure N. M., Counillon L., and Pouysségur J. (2013) Hypoxia promotes tumor cell survival in acidic conditions by preserving ATP levels. J. Cell. Physiol. 228, 1854–1862 10.1002/jcp.24346 [DOI] [PubMed] [Google Scholar]
- 36. Polet F., and Feron O. (2013) Endothelial cell metabolism and tumour angiogenesis: glucose and glutamine as essential fuels and lactate as the driving force. J. Int. Med. 273, 156–165 10.1111/joim.12016 [DOI] [PubMed] [Google Scholar]
- 37. Groussard C., Morel I., Chevanne M., Monnier M., Cillard J., and Delamarche A. (2000) Free radical scavenging and antioxidant effects of lactate ion: an in vitro study. J. Appl. Physiol. 89, 169–175 10.1152/jappl.2000.89.1.169 [DOI] [PubMed] [Google Scholar]
- 38. Parks S. K., Cormerais Y., and Pouyssegur J. (2017) Hypoxia and cellular metabolism in tumour pathophysiology. J. Physiol. [DOI] [PMC free article] [PubMed] [Google Scholar]
- 39. Colegio O. R., Chu N. Q., Szabo A. L., Chu T., Rhebergen A. M., Jairam V., Cyrus N., Brokowski C. E., Eisenbarth S. C., Phillips G. M., Cline G. W., Phillips A. J., and Medzhitov R. (2014) Functional polarization of tumour-associated macrophages by tumour-derived lactic acid. Nature 513, 559–563 10.1038/nature13490 [DOI] [PMC free article] [PubMed] [Google Scholar]
- 40. Damgaci S., Ibrahim-Hashim A., Enriquez-Navas P. M., Pilon-Thomas S., Guvenis A., and Gillies R. J. (2018) Hypoxia and acidosis: immune suppressors and therapeutic targets. Immunology [DOI] [PMC free article] [PubMed] [Google Scholar]
- 41. Cascone T., McKenzie J. A., Mbofung R. M., Punt S., Wang Z., Xu C., Williams L. J., Wang Z., Bristow C. A., Carugo A., Peoples M. D., Li L., Karpinets T., Huang L., Malu S., et al. (2018) Increased tumor glycolysis characterizes immune resistance to adoptive T cell therapy. Cell Metab. 27, 977–987.e4 10.1016/j.cmet.2018.02.024 [DOI] [PMC free article] [PubMed] [Google Scholar]
- 42. Granchi C., Paterni I., Rani R., and Minutolo F. (2013) Small-molecule inhibitors of human LDH5. Future Med. Chemistry 5, 1967–1991 10.4155/fmc.13.151 [DOI] [PMC free article] [PubMed] [Google Scholar]
- 43. de Padua M. C., Delodi G., Vučetić M., Durivault J., Vial V., Bayer P., Noleto G. R., Mazure N. M., Ždralević M., and Pouysségur J. (2017) Disrupting glucose-6-phosphate isomerase fully suppresses the “Warburg effect” and activates OXPHOS with minimal impact on tumor growth except in hypoxia. Oncotarget 8, 87623–87637 [DOI] [PMC free article] [PubMed] [Google Scholar]
- 44. Pouysségur J., Franchi A., Salomon J. C., and Silvestre P. (1980) Isolation of a Chinese hamster fibroblast mutant defective in hexose transport and aerobic glycolysis: its use to dissect the malignant phenotype. Proc. Natl. Acad. Sci. U.S.A. 77, 2698–2701 10.1073/pnas.77.5.2698 [DOI] [PMC free article] [PubMed] [Google Scholar]
- 45. Pouysségur J., Franchi A., and Silvestre P. (1980) Relationship between increased aerobic glycolysis and DNA synthesis initiation studied using glycolytic mutant fibroblasts. Nature 287, 445–447 10.1038/287445a0 [DOI] [PubMed] [Google Scholar]
- 46. Parks S. K., Chiche J., and Pouysségur J. (2013) Disrupting proton dynamics and energy metabolism for cancer therapy. Nat. Rev. Cancer 13, 611–623 10.1038/nrc3579 [DOI] [PubMed] [Google Scholar]
- 47. Marchiq I., Le Floch R., Roux D., Simon M. P., and Pouyssegur J. (2015) Genetic disruption of lactate/H+ symporters (MCTs) and their subunit CD147/BASIGIN sensitizes glycolytic tumor cells to phenformin. Cancer Res. 75, 171–180 10.1158/0008-5472.CAN-14-2260, 10.1158/1538-7445.AM2015-171 [DOI] [PubMed] [Google Scholar]
- 48. Marchiq I., and Pouysségur J. (2016) Hypoxia, cancer metabolism and the therapeutic benefit of targeting lactate/H+ symporters. J. Mol. Med. 94, 155–171 10.1007/s00109-015-1307-x [DOI] [PMC free article] [PubMed] [Google Scholar]
- 49. Balgi A. D., Diering G. H., Donohue E., Lam K. K., Fonseca B. D., Zimmerman C., Numata M., and Roberge M. (2011) Regulation of mTORC1 signaling by pH. PLoS ONE 6, e21549 10.1371/journal.pone.0021549 [DOI] [PMC free article] [PubMed] [Google Scholar]
- 50. Pouysségur J., Chambard J. C., Franchi A., Paris S., and Van Obberghen-Schilling E. (1982) Growth factor activation of an amiloride-sensitive Na+/H+ exchange system in quiescent fibroblasts: coupling to ribosomal protein S6 phosphorylation. Proc. Natl. Acad. Sci. U.S.A. 79, 3935–3939 10.1073/pnas.79.13.3935 [DOI] [PMC free article] [PubMed] [Google Scholar]
- 51. Ran F. A., Hsu P. D., Wright J., Agarwala V., Scott D. A., and Zhang F. (2013) Genome engineering using the CRISPR-Cas9 system. Nat Protoc. 8, 2281–2308 10.1038/nprot.2013.143 [DOI] [PMC free article] [PubMed] [Google Scholar]
- 52. Hsu P. D., Scott D. A., Weinstein J. A., Ran F. A., Konermann S., Agarwala V., Li Y., Fine E. J., Wu X., Shalem O., Cradick T. J., Marraffini L. A., Bao G., and Zhang F. (2013) DNA targeting specificity of RNA-guided Cas9 nucleases. Nat. Biotechnol. 31, 827–832 10.1038/nbt.2647 [DOI] [PMC free article] [PubMed] [Google Scholar]
- 53. Zhang Y., Bilbao A., Bruderer T., Luban J., Strambio-De-Castillia C., Lisacek F., Hopfgartner G., and Varesio E. (2015) The use of variable Q1 isolation windows improves selectivity in LC-SWATH-MS acquisition. J. Proteome Res. 14, 4359–4371 10.1021/acs.jproteome.5b00543 [DOI] [PubMed] [Google Scholar]
- 54. Benjamini Y., and Hochberg Y. (1995) Controlling the false discovery rate: a practical and powerful approach to multiple testing. J. R. Stat. Soc. Series B Methodol. 57, 289–300 [Google Scholar]
- 55. Feist M., Schwarzfischer P., Heinrich P., Sun X., Kemper J., von Bonin F., Perez-Rubio P., Taruttis F., Rehberg T., Dettmer K., Gronwald W., Reinders J., Engelmann J. C., Dudek J., Klapper W., et al. (2018) Cooperative STAT/NF-κB signaling regulates lymphoma metabolic reprogramming and aberrant GOT2 expression. Nat. Commun. 9, 1514 10.1038/s41467-018-03803-x [DOI] [PMC free article] [PubMed] [Google Scholar]
- 56. Millard P., Letisse F., Sokol S., and Portais J. C. (2012) IsoCor: correcting MS data in isotope labeling experiments. Bioinformatics 28, 1294–1296 10.1093/bioinformatics/bts127 [DOI] [PubMed] [Google Scholar]
Associated Data
This section collects any data citations, data availability statements, or supplementary materials included in this article.