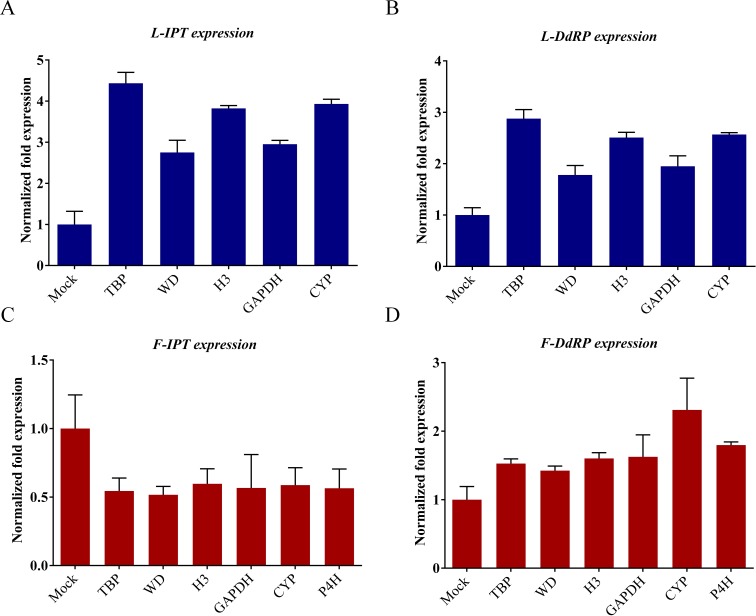
Figure 5. Relative quantification of LsIPT and LsDdRP expression in gourd leaf and fruit infected by CGMMV with RGs selected.
LsTBP (leaf and fruit), LsWD (leaf and fruit), LsH3 (leaf and fruit), LsGAPDH (leaf and fruit), LsCYP (leaf and fruit) and LsP4H (fruit only) were used as RGs. Error bars represent mean standard error calculated from three biological replicates. A control mock-inoculated sample was used as the calibrator (= 1). (A) LsIPT expression of gourd leaves with selected RGs. (B) LsDdRP expression of gourd leaves with selected RGs. (C) LsIPT expression of gourd fruits with selected RGs. (D) LsDdRP expression of gourd fruits with selected RGs. L, leaf; F, fruit.

