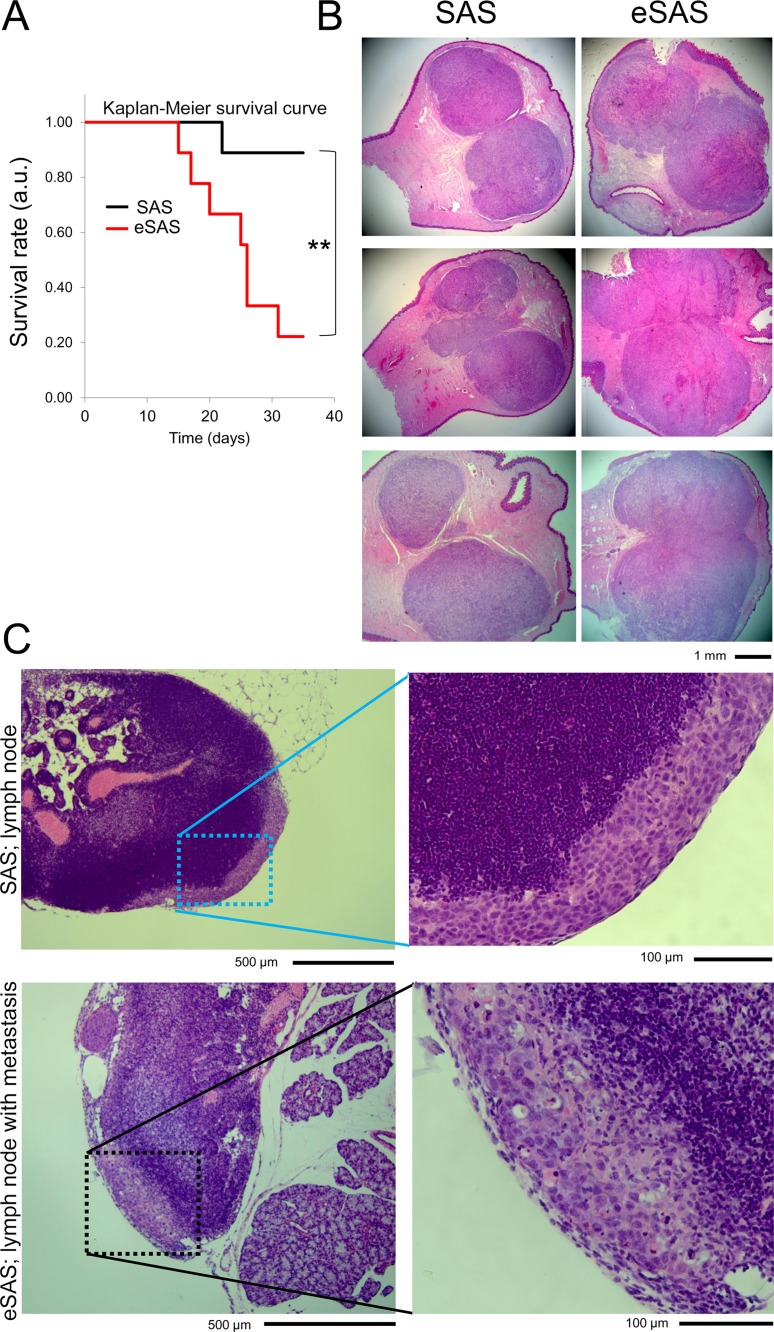
Figure 4. eSAS cells exhibit a reduced survival rate in nude mice.
(A) Survival curves of mice with SAS or eSAS cells implanted into the tongue. Survival rate is presented in arbitrary units (a.u.). Survival analysis of the nude mice was evaluated by the Kaplan-Meier method and the log-rank test (Peto-Peto and Cochran-Mantel-Haenszel) and generalized Wilcoxon test (Gehan-Breslow) was used to compare the data from nine SAS cell-implanted and nine eSAS cell-implanted mice. One SAS cell-implanted mouse and seven eSAS cell-implanted mice died at day 35 after implantation. **P < 0.01, namely, P = 0.0064 as determined by Cochran-Mantel-Haenszel method. (B) Hematoxylin and eosin (HE) staining of dissected tongues of mice implanted with SAS (left panels) and eSAS (right panels) cells. The mice were sacrificed fourteen days after cell implantation. The six mice employed in this assay were different from those used to evaluate survival rates. Tumors were observed as regions with a dark pink color. (C) Typical images of cervical lymph nodes of nude mice implanted with SAS or eSAS cells after HE staining. Right panels show enlarged images of the left panels. Regions of interest are encircled by dotted squares in the left panels. The pale purple region in the right panel of mice implanted with eSAS shows the putative invasive region.

