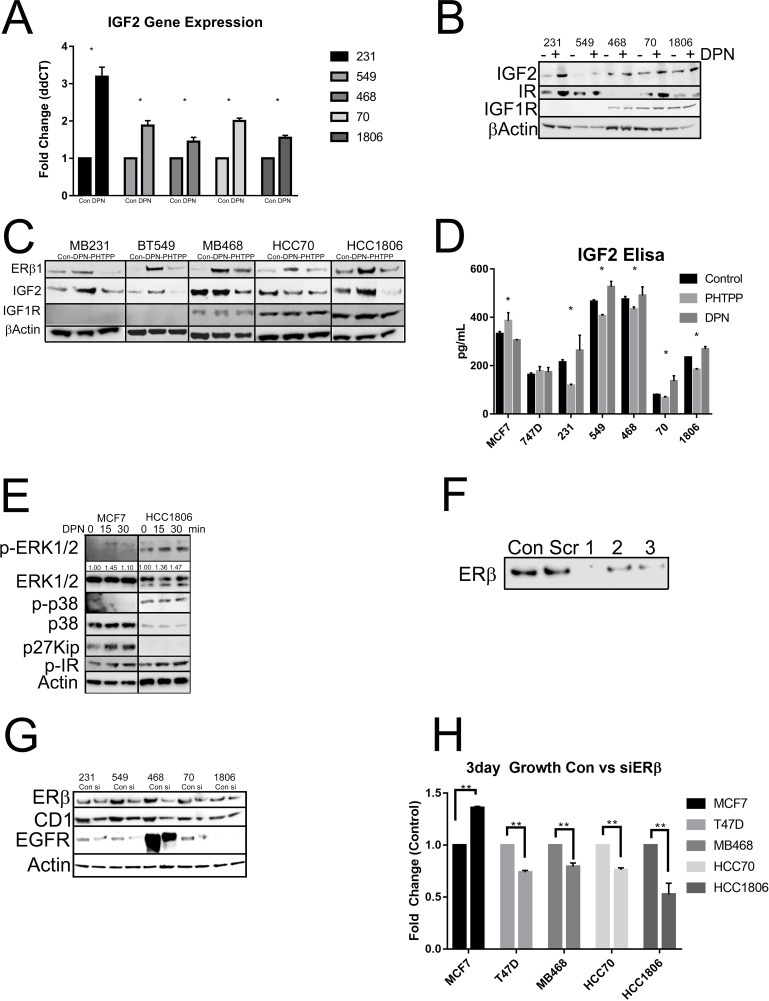
Figure 6. Activation of ERβ upregulates IGF2 and activates the IR/IGF1R/MAPK pathways.
(A) The indicated cells were treated with or without DPN. mRNA level of IGF2 was determined by RT-qPCR and adjusted for GAPDH. The bar graph presented fold changes of IGF2 level in cells treated with DPN compared to non-treated cells (control). Each bar indicated mean ±SD from 3 measurements and “*” indicated p<0.05 determined by one-way ANOVA. (B) Total protein was extracted from the indicated cells treated with or without DPN. Western blot analysis was performed with antibodies for IGF2, insulin receptor (IR) and IGFIR. β-actin was used for loading control. (C) The cells were treated with or without DPN, PHTPP or DPN+PHTPP as descripted in methods and total protein was extracted. Protein levels of ERβ1, IGF2 and IGFIR were determined by Western Blot analysis and β-actin was used as loading control. (D) The cells were maintained in serum free media and treated with or without DPN or PHTPP. Secreted protein level of IGF2 in the media was measured by IGF2 ELISA kit according to manufacture instruction as described in methods. The bars indicated mean level of IGF2 with SD from duplicated measurements and “*” indicated P<0.05 for the differences in level of IGF2 between the indicated cells and MCF7 cells determined by one-way ANOVA. (E) The cells were treated with DPN from 0 to 30 min and protein was extracted. Western blot analysis was performed with antibodies for P-ERK1/2, ERK1/2, P-p38, p38 and p27kip. β-actin was used as loading control. The level of P-ERK1/2 was further quantified with β-actin and showed under membrane of P-ERK1/2. (F) T47D cells were treated with 3 different siRNA sequences of ERβ and ERβ1 expression was determined Western Blot analysis with antibody for ERβ1 was used to assess efficiency of the siRNAs. (G) The cells were treated with pooled siRNA sequences for ERβ and the level of ERβ was determined by Western blot. The protein levels of cyclin D1 (CD1) and EGFR were also determined by Western blot analysis. β-actin was used as loading control. (H) The cells were treated with or without siRNA for ERβ and cell proliferation was determined by The CellTiter-Glo® Luminescent Cell Viability Assay as described in methods. The bars indicated fold changes (mena ±SD) of cells treated with siRNA compared to cells without treating with siRNA (control). “**” indicated P<0.001 between the indicated groups determined by one-way ANOVA.

