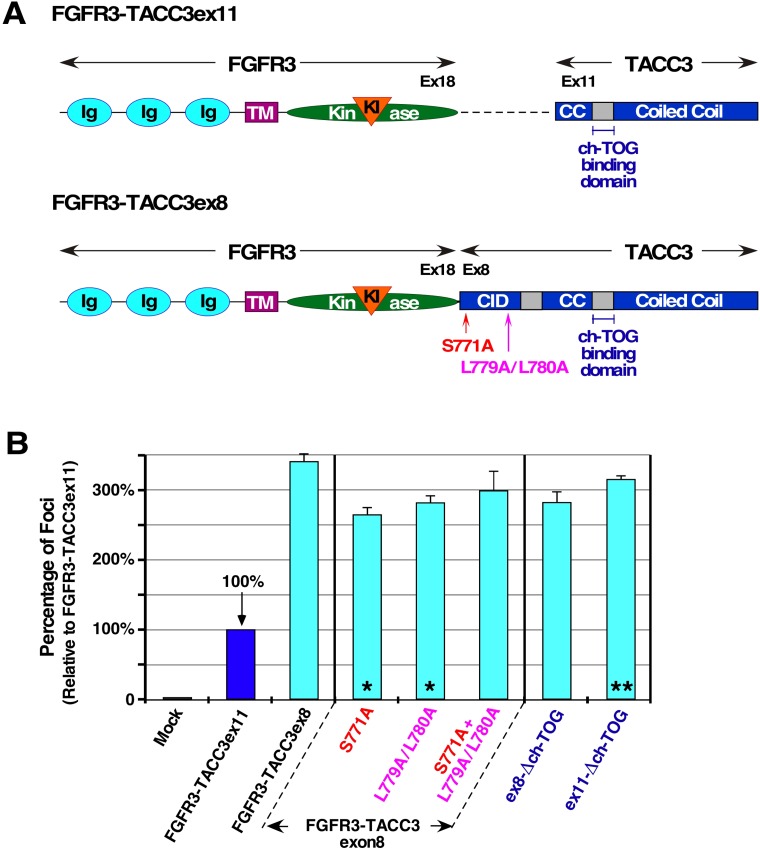
Figure 5. TACC3 domain mutations and their contribution to cell transformation.
(A) Schematic of FGFR3-TACC3ex11 and FGFR3-TACC3ex8 with ch-TOG binding domain indicated. Location of Aurora-A phosphorylation site (S771) and clathrin binding site (L779/L780) in FGFR3-TACC3ex8 are shown. (CID: clathrin interaction domain). (B) Transformation of NIH3T3 cells by the indicated constructs. Number of foci were scored, normalized by transfection efficiency, and quantitated relative to FGFR3-TACC3ex11 ± SEM. Statistical analysis by Student's t-test identifies significant changes in focus counts (*p < 0.05, **p < 0.01). Assays were performed a minimum of three times per DNA construct.

