Abstract
Quantitative mass spectrometry-based protein profiling is widely used to measure protein levels across different treatments or disease states, yet current mass spectrometry acquisition methods present distinct limitations. While data-independent acquisition (DIA) bypasses the stochastic nature of data-dependent acquisition (DDA), fragment spectra derived from DIA are often complex and challenging to deconvolve. In-line ion mobility separation (IMS) adds an additional dimension to increase peak capacity for more efficient product ion assignment. As a similar strategy to sequential window acquisition methods (SWATH), IMS-enabled DIA methods rival DDA methods for protein annotation. Here we evaluate IMS-DIA quantitative accuracy using stable isotope labeling by amino acids in cell culture (SILAC). Since SILAC analysis doubles the sample complexity, we find that IMS-DIA analysis is not sufficiently accurate for sensitive quantitation. However, SILAC precursor pairs share common retention and drift times, and both species co-fragment to yield multiple quantifiable isotopic y-ion peak pairs. Since y-ion SILAC ratios are intrinsic for each quantified precursor, combined MS1 and y-ion ratio analysis significantly increases the total number of measurements. With increased sampling, we present DIA-SIFT (SILAC Intrinsic Filtering Tool), a simple statistical algorithm to identify and eliminate poorly quantified MS1 and/or MS2 events. DIA-SIFT combines both MS1 and y-ion ratios, removes outliers, and provides more accurate and precise quantitation (<15% CV) without removing any proteins from the final analysis. Overall, pooled MS1 and MS2 quantitation increases sampling in IMS-DIA SILAC analyses for accurate and precise quantitation.
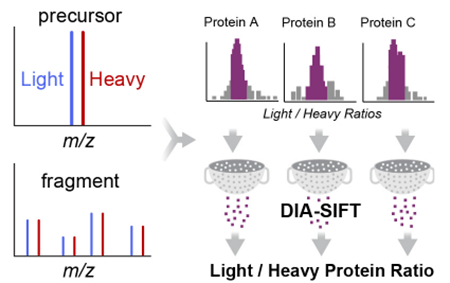
Graphical Abstract

Standard shotgun proteomics acquisition methods rely on repeating cycles initialized by a precursor scan and followed by dynamic selection, isolation, and fragmentation of a fixed number of abundant ions for sequence annotation1. In regions of high chromatographic complexity, the rate of the data-dependent acquisition (DDA) duty cycle limits isolation and fragmentation to only the most intense precursor ions. This under under-sampling fundamentally ties the number of analyzed peptides to the instrument scan speed, limiting proteome coverage2. Additionally, low mass resolution of multipole ion selection often results in undesirable ion interference, yielding chimeric fragmentation spectra across >50% of MS2 spectra3. The resulting composite fragment spectra incur search penalties that limit confident peptide annotations. These variables diminish reproducible analysis, prompting the need for new approaches to enhance ion discrimination and deliver high-quality fragmentation spectra.
To address this gap, data-independent acquisition (DIA) methods have been developed that bypass abundance-based ion isolation. Instead of iteratively selecting the most abundant ions for isolation and fragmentation, all-ion fragmentation methods, such as MSE, use alternating MS scans collected at low and high collision energies, generating precursor (MS1) and product (MS2) ion spectra across the entire mass range4. Post-acquisition alignment of peptide elution profiles for MS1 and MS2 spectra allow accurate assignment of precursors to their corresponding product ions. Sequential window acquisition of all theoretical mass spectra, or SWATH, further segregates the precursor mass range into limited m/z windows for confined fragmentation, resulting in reduced ion interference while preserving reproducibility5,6.
Recent commercial mass spectrometers incorporating ion mobility separation (IMS) provide an orthogonal approach to reduce ion interference for DIA workflows. In general terms, IMS describes a gas-phase electrophoresis separation, separating ions based on their size, shape, and charge on a millisecond timescale. These inherent physical properties impart distinct IMS drift times, providing an orthogonal analytical dimension that increases peak capacity, reduces ion interference, and delivers multi-parameter peptide analytics (retention time, drift time, precursor and product m/z) for high-definition analysis7,8. Furthermore, drift-time dependent collision energy assignment produces more efficient fragmentation, where higher collision energies are assigned to peptides with longer drift times9. Altogether, IMS-DIA methods yield a 2.3-fold higher annotation rate than the theoretical maximum for a first-generation quadrupole Orbitrap instrument using higher-energy collisional dissociation (HCD)9. This results in 1/3 more annotated proteins and twice as many annotated peptides. Based on these values, IMS separation improves both peak capacity and fragmentation efficiency to provide a unique platform for multi-dimensional DIA analysis8.
Label-free quantitation methods typically measure the 3 ions with the highest intensity (top-3 analysis), which largely correlate with protein abundance4. This procedure immediately triages the bulk of the peptide features from the final measurement, reducing statistical power often needed for confident cross-experiment analyses. SWATH acquisition quantified by summing the 5 most intense product ions from the 3 most intense peak groups generally yields intra-day CVs less than 20% across replicate runs, but variance increases significantly between different laboratories operating the same instrument10.
Incorporating internal standards for direct quantitation would correct many sources of additional variance.
We hypothesized that stable isotope labeling by amino acids in cell culture (SILAC) analysis might improve reproducible DIA quantitation across the proteome, especially since comparative ratios are internally quantified and eliminate many sources of experimental error. In this approach, control and experimental cells are grown separately in “Light” media or stable isotope-labeled “Heavy” media supplemented with L-arginine (13C6, 15N4) and L-lysine (13C6, 15N2). The samples are then mixed and digested with trypsin for comparative mass spectrometry analysis. Since trypsin digests proteins at arginine and lysine residues, the integrated intensity of each control (“Light”) and experimental (“Heavy”) peptides can be comparatively quantified across all proteolytic peptides. When SILAC is combined with IMS-DIA methods, even at the most complex elution time, IMS separation limits ion interference to only 5.5%11. Therefore, IMS enhances peak capacity to resolve much of the complexity introduced through binary SILAC analysis. Nevertheless, it remained unclear if this purity is sufficient for accurate quantitative analysis. Here we sought to benchmark stable isotope quantitation using IMS-DIA methods, particularly for accurate quantification of fractional abundance changes.
Since SILAC “Light” and “Heavy” peptide pairs share common retention and ion mobility drift times, the paired peptides co-fragment, and the resulting y-ion fragment spectra include “Light” and “Heavy” peak pairs derived from the C-terminal arginine or lysine labels. In current IMS-DIA proteomic analysis workflows, these product ion pairs are automatically binned together during drift and retention time alignment during peptide annotation (Figure 1A-B). To access these product ion ratios for quantitation, we developed a SILAC quantitation pipeline to process output files generated by the APEX algorithm provided in the PLGS analysis software (Waters)12,13. This post-processing algorithm retroactively extracts y-ion peak pair assignments, and since the DIA workflow samples peptide fragments across their chromatographic elution profile, the peak area can be quantified for all assigned y-ion pairs.
Figure 1.

y-ion quantitation increases measureable observations in DIA-SILAC analysis. (A) Schematic of SILAC IMS-DIA analysis. SILAC pairs share a common drift time and retention time for both precursor and product ions. (B) MS2 spectra of SILAC analysis (1:1) of histone 2B tryptic peptide demonstrating “Light” and “Heavy” (13C6, 15N4) y-ion pairs (shaded orange). (C) SILAC quantitation of y-ion ratios increases the number of quantifiable observations. Data represent aggregate observations across 3 replicates. (D) Fragment and precursor ions intensity profiles derived from SILAC IMS-DIA analysis.
A series of human SILAC-labeled 293T cell tryptic digests of known Light / Heavy ratios were analyzed using a quadrupole IMS time-of-flight mass spectrometer (Synapt G2-S HDMS; Waters). Across different SILAC mixtures, MS2 y-ion ratio measurements nearly doubled the number of quantifiable observations, producing up to 60,000 quantifiable ratios summed across 3 replicates using a 105 min gradient (Figure 1C). Across this triplicate dilution series, 1254 ± 153 (SD) proteins were identified with an average of 19 precursor and 21 y-ion SILAC ratios per protein. Fragment ion intensities average 1-2 orders of magnitude lower than precursor ions, yet remain well within the dynamic range of the detector, allowing accurate quantitation (Figure 1D). By including these intrinsic y-ion SILAC ratios, on average, peptides are measured ~5 times, providing inherent validation of the quantified precursor ratio.
Label-free MS2 quantitation of IMS-DIA data reportedly increases accuracy of protein quantification, even when protein abundance spans a wide dynamic range14) In order to explore this further, we quantified the distribution of SILAC ratios across peptides from the different SILAC mixtures. In analyses of predefined mixtures spanning a 5-fold range, MS1 quantitation yielded a broad distribution of ratios with a 95% confidence interval for the coefficient of variation between 28-30% (Figure S1A), signifying extensive ion interference amplified by the increased sample complexity. In comparison, MS2 quantitation of y-ion ratios acquired with IMS-DIA methods yielded a broad distribution of measurements with a 95% confidence interval for the coefficient of variation between 76-80% (Figure S1B). However, the quantified ratios across individual proteins were largely Gaussian, with outliers amplifying the overall variance. These protein-level CVs are similar to retrospective analysis across several archived DDA experiments acquired on different generation Orbitrap instruments (Figure S2)15–17.
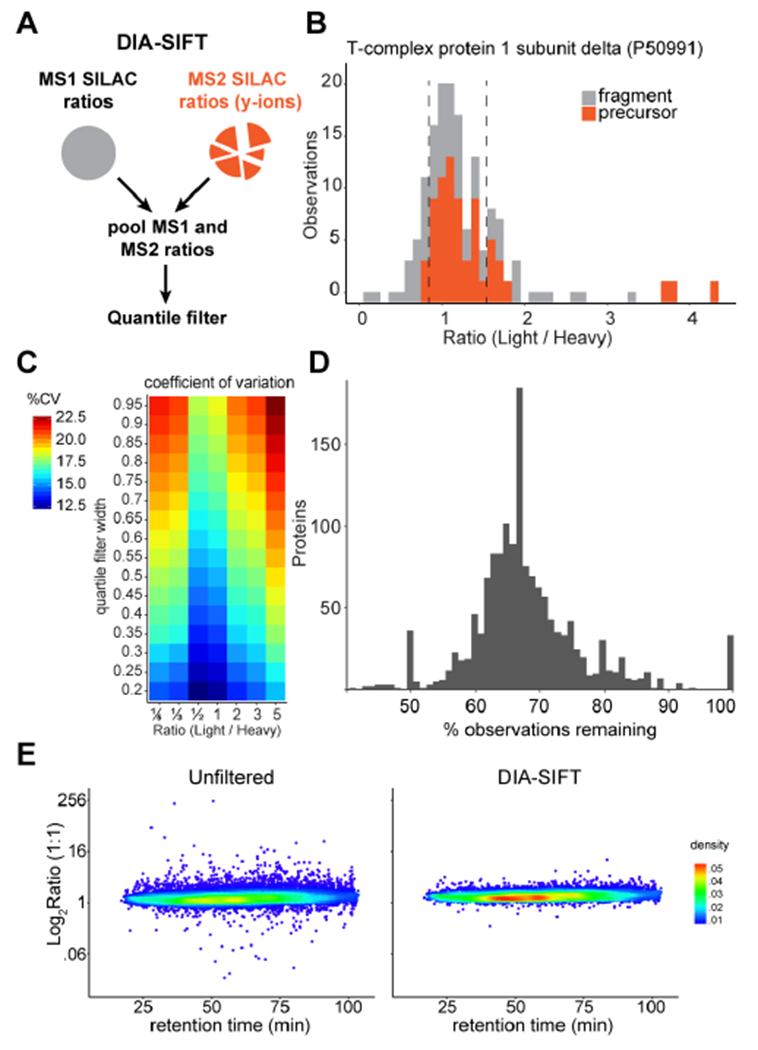
To address these observations, we introduced a simple statistical filter, termed DIA-SIFT, to eliminate outliers from pooled MS1 and MS2 ratios (Figure 2A). Since MS1 and MS2 ratios are both intrinsic to the actual ratio, precursor and y-ion measurements are weighted equally. The pooled measurements for each protein are then quantile filtered, removing any statistical outliers from the overall protein measurement. For example, the chaperone protein CCT4 reports a largely Gaussian distribution of both precursor and y-ion ratios in a 1:1 (Light : Heavy) analysis. DIA-SIFT filtering removes interfered outliers while retaining sufficient measurements for accurate quantitation (Figure 2B). Pooled protein measurements are only filtered when there are at least three observations, and no quantified proteins are outright eliminated from the analysis.
Figure 2.

Quantile filtering of pooled MS1 and y-ion SILAC ratios improves accuracy. (A) Measured ratios are pooled together for quantile filtering of each protein. (B) Elimination of outlier ratios (those outside the dashed lines) by quantile filtering of pooled SILAC ratios for accurate protein quantitation. (C) Systematic analysis of quantile filter window relationship to the %CV across the analysis at different defined SILAC mixtures. (D) Profile of observations remaining after quantile filtering MS1 and y-ion ratios by protein using a stringent 0.2 i.q.r. filter. (E) Quantile filtering reduces outlying peptide ratios to narrow the overall distribution of SILAC ratios toward the true value across the chromatographic gradient. Data compiled from 3 independent replicates. The color heatmap corresponds to two-dimensional kernel density estimate.
MS1-based SILAC measurements are typically reported as median values, which complicate later statistical analysis. Here, a sufficient number of measurements are retained to average any inconsistencies and more accurately reflect the true SILAC ratio. Applying a 0.2 inner quartile range (IQR) filter (see Supporting Experimental Methods) retains 67 ± 10 % (mean ± standard deviation) of the observations in the final protein quantitation (Figure 2C-D), while reducing the coefficient of variation >4-fold across the SILAC dilution series. The selected filter thresholds balance stringency with retention of quantified observations. Outlier ratios are equally distributed across the chromatographic gradient, and largely eliminated after quantile filtering (Figure 2E). Overall, DIA-SIFT restores accurate protein quantitation in SILAC IMS-DIA analysis without removing any protein identifications.
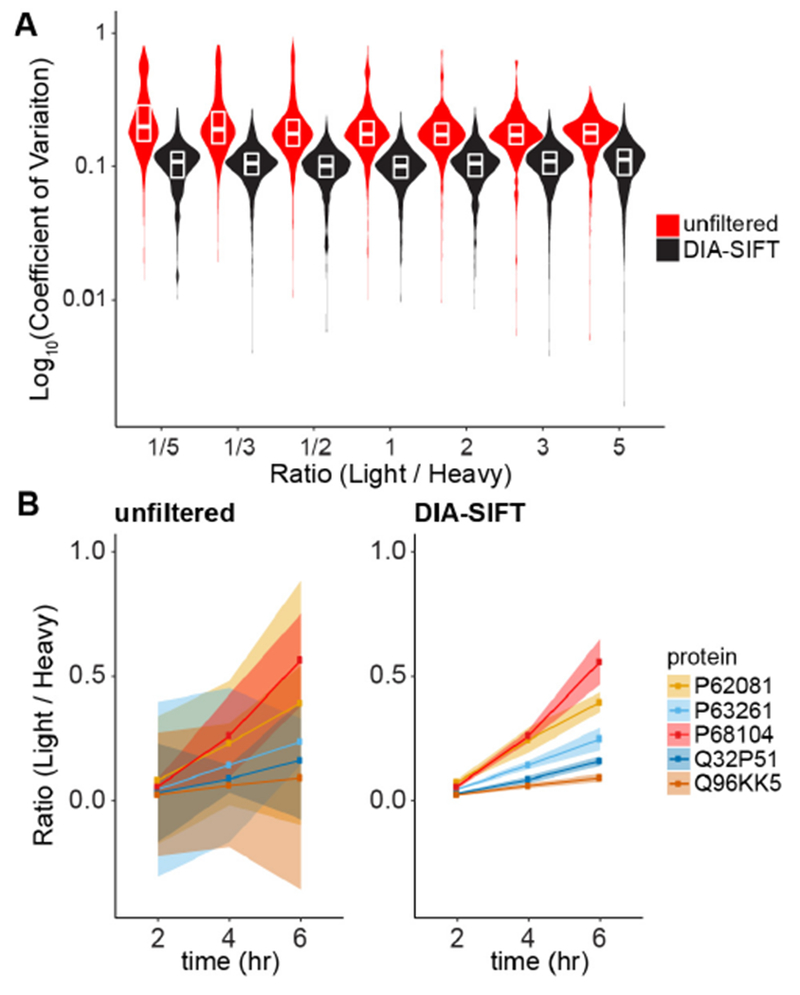
Across the tested dilution series, DIA-SIFT dramatically improves accurate quantitation of fractional changes across the proteome (Figures 3A, S3, and S4). For example, in a 1:1 mixture the mean protein-level coefficient of variation is reduced from 0.55 to 0.12, and the mean peptide-level variation is reduced from 0.24 to 0.06. The overall result is a reduction in outliers, which is essential for accurately measuring biologically significant changes. Weighting MS1 ratios more heavily than y-ion ratios had no effect on the overall accuracy, highlighting the broad dynamic range of TOF-based SILAC quantitation (Figure S5). Overall, quantile filtering reduces the mean coefficient of variation to less than 15% across all samples across the dilution series.
Figure 3.

DIA-SIFT reduces variance to more accurately measure changes in protein levels. (A) Protein quantitative accuracy is improved by DIA-SIFT. Observed coefficients of variation across a defined SILAC dilution series are broad and harbor a number of outliers. DIA-SIFT reduces variation equivalently across the series. (B) Pulse-SILAC labeling measurements are resolved by DIA-SIFT analysis. Five proteins are shown across 3 time points after cell growth media was switched from Heavy to Light. Shaded error represents the standard deviation for each protein.
As further validation, human 293T cells initially grown in Heavy SILAC media (with arginine +10 and lysine +8) were switched to Light media and collected after different time intervals. The rate of Heavy to Light amino acid incorporation reports the ratio of old and newly synthesized proteins (Figure 3B). Unprocessed data is highly variable and cannot be reasonably interpreted. After processing the data with DIA-SIFT, individual proteins are more accurately quantified to determine their rate of synthesis and turnover.
Overall, DIA-SILAC methods offer several unique advantages for proteomics data analysis. Recent NeuCoDIA methods also quantify y-ion ratios, leveraging neutron-encoded SILAC labels to avoid increased sample complexity18, yet require extended acquisition times for high resolution analysis (120,000 resolution at 200 m/z) of the neutron-encoded labels. This limits analysis to only a narrow mass range (100 m/z) with four 27 m/z-wide SWATH windows. In comparison, IMS-DIA SILAC methods profile the entire mass range, collect more frequent MS1 and MS2 scans for better chromatographic peak definition and yield significantly more quantifiable observations than NeuCoDIA analysis. Nonetheless, both DDA and DIA SILAC analysis reduce the total number of annotated proteins by ~20%11,19. When accuracy is critical, this fractional loss in proteome coverage is less of a concern. In addition, the largest ratio changes are typically the most biologically interesting. Thus, implementing DIA-SIFT will reduce false positives and direct further biological validation to bona fide targets.
Here we demonstrate that DIA analysis yields y-ion ratio measurements that enhance SILAC quantitation. y-ions can be easily identified as fragments pairs with matched drift and retention times. Since the y-ion pairs are matched based on the drift and retention time peaks, they represent multiple measurements and not single scans typical of DDA spectra. Beyond quantitation, these y-ion pairs could also be leveraged to enhance confidence in peptide search algorithms, since they provide an orthogonal validation of accurate peptide fragmentation20. Implementing y-ion pair statistics in label-assisted de novo sequencing (LADS) algorithms could further enhance peptide annotation, quantitation, and reproducibility. Overall, DIA-SIFT algorithms can be adapted for SWATH analysis of SILAC or NeuCode-labeled peptides, providing a simple filter to leverage y-ion ratios for more accurate quantitation.
Supplementary Material
ACKNOWLEDGMENT
We would like to thank Kristina Hakansson, Robert Kennedy and Brandon Ruotolo (Michigan) for helpful discussions. Financial support for these studies was provided by the American Heart Association 14POST20420040 (J.D.M.), the National Institutes of Health DP2 GM114848 (B.R.M.), T32 GM008597 (S.E.H.), and the University of Michigan.
ASSOCIATED CONTENT
Supporting Information
The Supporting Information is available free of charge on the ACS Publications website. Data are available on ProteomeXchange using identifier PXD009949. DIA-SIFT software and documentation is available for download at https://github.com/martin-lab/DIA-SIFT.
Experimental methods, distribution of product and precursor ratios, DIA-SIFT details. (PDF)
REFERENCES
- (1).Pandey A, Mann M 2000, Nature 405, 837–846. [DOI] [PubMed] [Google Scholar]
- (2).Shishkova E, Hebert AS, Coon JJ 2016, Cell Syst 3, 321–324. [DOI] [PMC free article] [PubMed] [Google Scholar]
- (3).Houel S, Abernathy R, Renganathan K, Meyer-Arendt K, Ahn NG, Old WM 2010, J. Proteome Res 9, 4152–4160. [DOI] [PMC free article] [PubMed] [Google Scholar]
- (4).Silva JC, Gorenstein MV, Li GZ, Vissers JP, Geromanos SJ 2006, Mol. Cell. Proteomics 5, 144–156. [DOI] [PubMed] [Google Scholar]
- (5).Venable JD, Dong MQ, Wohlschlegel J, Dillin A, Yates JR 2004, Nat. Methods 1, 39–45. [DOI] [PubMed] [Google Scholar]
- (6).Gillet LC, Navarro P, Tate S, Rost H, Selevsek N, Reiter L, Bonner R, Aebersold R 2012, Mol. Cell. Proteomics 11, O111016717. [DOI] [PMC free article] [PubMed] [Google Scholar]
- (7).Valentine SJ, Kulchania M, Barnes CAS, Clemmer DE 2001, Int. J. Mass Spectrom 212, 97–109. [Google Scholar]
- (8).Haynes SE, Polasky DA, Dixit SM, Majmudar JD, Neeson K, Ruotolo BT, Martin BR 2017, Anal. Chem 89, 5669–5672. [DOI] [PMC free article] [PubMed] [Google Scholar]
- (9).Distler U, Kuharev J, Navarro P, Levin Y, Schild H, Tenzer S 2014, Nat. Methods 11, 167–170. [DOI] [PubMed] [Google Scholar]
- (10).Collins BC, Hunter CL, Liu Y, Schilling B, Rosenberger G, Bader SL, Chan DW, Gibson BW, Gingras AC, Held JM, Hirayama-Kurogi M, Hou G, Krisp C, Larsen B, Lin L, Liu S, Molloy MP, Moritz RL, Ohtsuki S, Schlapbach R, Selevsek N, Thomas SN, Tzeng SC, Zhang H, Aebersold R 2017, Nat. Commun 8, 291. [DOI] [PMC free article] [PubMed] [Google Scholar]
- (11).Geromanos SJ, Hughes C, Ciavarini S, Vissers JP, Langridge JI 2012, Anal. Bioanal. Chem 404, 1127–1139. [DOI] [PubMed] [Google Scholar]
- (12).Geromanos SJ, Vissers JP, Silva JC, Dorschel CA, Li GZ, Gorenstein MV, Bateman RH, Langridge JI 2009, Proteomics 9, 1683–1695. [DOI] [PubMed] [Google Scholar]
- (13).Huang X, Liu M, Nold MJ, Tian C, Fu K, Zheng J, Geromanos SJ, Ding SJ 2011, Anal. Chem 83, 6971–6979. [DOI] [PubMed] [Google Scholar]
- (14).Daly CE, Ng LL, Hakimi A, Willingale R, Jones DJL 2014, Anal. Chem 86, 1972–1979. [DOI] [PMC free article] [PubMed] [Google Scholar]
- (15).Li Q, Chang Z, Oliveira G, Xiong M, Smith LM, Frey BL, Welham NV 2016, Biomaterials 81, 104–113. [DOI] [PMC free article] [PubMed] [Google Scholar]
- (16).Kathiriya JJ, Nakra N, Nixon J, Patel PS, Vaghasiya V, Alhassani A, Tian Z, Allen-Gipson D, Davé V 2017, Cell Death discovery 3, 17010. [DOI] [PMC free article] [PubMed] [Google Scholar]
- (17).Hogrebe A, von Stechow L, Bekker-Jensen DB, Weinert BT, Kelstrup CD, Olsen JV 2018, Nat. Commun 9, 1045. [DOI] [PMC free article] [PubMed] [Google Scholar]
- (18).Minogue CE, Hebert AS, Rensvold JW, Westphall MS, Pagliarini DJ, Coon JJ 2015, Anal. Chem 87, 2570–2575. [DOI] [PMC free article] [PubMed] [Google Scholar]
- (19).Li Z, Adams RM, Chourey K, Hurst GB, Hettich RL, Pan C 2012, J Proteome Res 11, 1582–1590. [DOI] [PubMed] [Google Scholar]
- (20).Devabhaktuni A, Elias JE 2016, J. Proteome Res 15, 732–742. [DOI] [PubMed] [Google Scholar]
Associated Data
This section collects any data citations, data availability statements, or supplementary materials included in this article.


