Abstract
X-ray luminescence computed tomography (XLCT) is a hybrid imaging modality with the potential to achieve a spatial resolution up to several hundred micrometers for targets embedded in turbid media with a depth larger than several millimeters. In this paper, we report a high spatial resolution XLCT imaging system with a collimated superfine x-ray beam in imaging the deeply embedded targets. A collimator with a 100 micrometer pinhole was mounted in the front of a powerful x-ray tube to generate a superfine x-ray pencil beam with a beam diameter of 0.175 mm. For the phantom experiment of four capillary targets with an edge-to-edge distance of 400 micrometers, we were able to reconstruct the targets in a depth of 5 mm successfully, which were validated with microCT images. We have further investigated the effect of different x-ray beam diameters on the reconstructed XLCT images with numerical simulations. Our results indicate that XLCT has the ability to image successfully multiple deeply embedded targets when the collimated x-ray beam diameter is less than or equal to the target edge-to-edge distance. Our numerical simulations also demonstrate that XLCT can achieve a spatial resolution of 200 micrometers for targets embedded at a depth of 5 mm if the scanning beam has a diameter of 100 micrometers.
Keywords: X-ray imaging, medical optics instrumentation, tomography, turbid media
1. INTRODUCTION
Hybrid imaging has attracted lots of attention in recent years due to its advantage of combining the strengths of multiple imaging modalities. One typical example of hybrid imaging is photoacoustic imaging, in which a powerful pulsed laser is used to heat up absorbers that expand rapidly and emit ultrasound waves to be detected.1 Photoacoustic imaging can extract the optical absorber distribution at a spatial resolution of ultrasound imaging. Another example is the x-ray luminescence computed tomography (XLCT), in which linearly propagating x-ray beams are used to excite phosphors that emit optical photons to be measured for extracting the concentration of phosphors in tissues. XLCT has the potential to have both the high measurement sensitivity of optical imaging and the high spatial resolution of x-ray imaging.2,3 To image deep targets in turbid media, XLCT overcomes the optical scattering effects by applying x-ray beam positions as structural priors in the XLCT reconstruction algorithms.4,5
To date, several types of XLCT imaging systems have been designed and studied. Pratx et al. proposed the concept of narrow beam XLCT and proved the feasibility of XLCT by numerical simulations.6 They also demonstrated that narrow beam XLCT can have high spatial resolution in deep tissues by both numerical and experimental studies.3 We have previously reported a collimated pencil beam XLCT system and proved experimentally that the reconstructed target size varies less than 10% for target depths from 4.2 to 7.7 mm.2 To overcome the long measurement time in narrow and pencil beam XLCT systems, Chen et al. designed a cone beam XLCT imaging system to improve the scanning speed but with a compromised spatial resolution.7 Liu et al. implemented their cone beam XLCT in small animal studies.8 Recently, we have reported a multiple beam scanning based XLCT system for reducing the data acquisition time and also measured the x-ray radiation dose of an XLCT scan to be in the range of a typical CT scan.9
To take advantage of the high spatial resolution of x-ray imaging, we continue pursuing our approach based on collimated x-ray pencil beams whose position and size are included as structural priors in the XLCT reconstruction.2 There are two approaches to generate superfine x-ray beams. One is by x-ray optics, in which a conical x-ray beam is focused with an x-ray optics lens. In x-ray fluorescence (XRF) analysis, mono- and poly-capillary optics were usually used to focus x-ray beams with a focal spot diameter as small as 22 μm.10 In XLCT, Cong et al. proposed a dual cone scanning method with a poly-capillary lens, in which the x-ray beam was focused into a spot with a diameter less than 50 μm. In their numerical simulation studies, they achieved a spatial resolution around 50 μm.11 This approach has high x-ray photon intensity in the focused x-ray beams. However, it is very difficult to focus high-energy x-ray photons and the cost is high. Another method is the collimation of x-ray beams. If the collimator aperture is small, we can have superfine x-ray beams. The pinhole collimators are successfully used in XRF for micro-scale spatial resolution analysis.12 The advantage of this approach is that it is straightforward to implement at a very low cost. The disadvantage is the low x-ray photon utilization efficiency because most x-ray photons are absorbed by the collimator, which might not be a problem for XLCT imaging if a powerful x-ray tube and a sensitive optical detector are used.
In this paper, to investigate whether we can achieve high resolution in deep turbid media with XLCT, we reduced the x-ray collimator’s diameter to 100 micrometers (μm) to generate superfine x-ray beams that were used to scan deeply embedded phosphor targets. The rest of this paper is organized as follows. In section 2, numerical simulation setup, XLCT imaging system, phantom experimental parameters, and XLCT image quality evaluation criteria are introduced. In section 3, we describe the results of numerical simulations and experimental experiments. Finally, section 4 ends this paper with discussion and conclusions.
2. METHODS
2.1. Numerical simulation setup
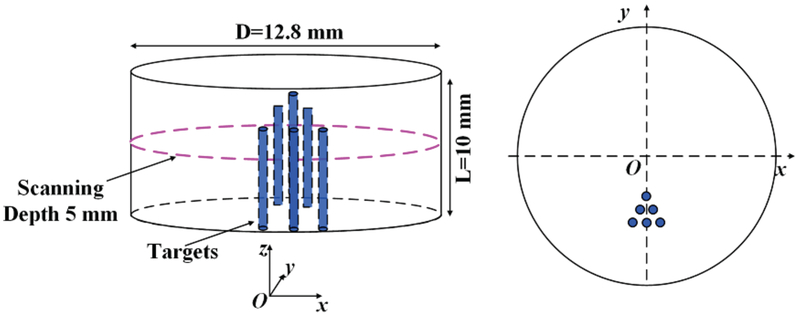
To study how the x-ray beam size affects the XLCT reconstruction, we have performed numerical simulations of XLCT with different collimated x-ray beam diameters to scan a cylindrical phantom embedded with 6 targets with different target diameters. A 10 mm long cylindrical numerical phantom with a diameter of 12.8 mm was used to mimic a mouse size object. The numerical phantom had an absorption coefficient (μa) of 0.0072 mm−1 and a reduced scattering coefficient (μ′s) of 0.72 mm−1 at the wavelength of 703 nm, which is the wavelength peak in the emission spectrum of the phosphor (Eu3+−doped gadolinium oxysulfide, GOS:Eu3+). The x-ray attenuation coefficient (μx) was set to be 0.0214 mm−1.9 We have 6 targets placed inside the phantom as indicated in Fig. 1 for a typical case with target diameter of 0.2 mm and an edge-to-edge distance of 0.2 mm. We simulated four different cases with different target diameters of 1.0, 0.5, 0.2 and 0.1 mm. For all four numerical simulation cases, the edge-to-edge distance equals the target diameter. For all numerical simulations, the phosphor particle concentration in targets was 1.0 mg/mL. The background phantom contained no phosphor particles. To simulate the experiments in the following sections, we used a single x-ray beam to scan the phantom at a depth of 5 mm under the phantom top surface numerically. The x-ray beam diameter was set to be 0.1, 0.2, 0.5 and 1 mm, respectively. The scanning step size was equal to the x-ray beam diameter. For all numerical simulations we used 6 angular projections with an angular step size of 30 degrees. To scan the whole transverse section of the phantom, for each angular projection, there were 128, 64, 26 and 13 linear scan steps for the x-ray beam diameters of 0.1, 0.2, 0.5 and 1 mm, respectively. We generated numerical measurements at the six angular projections with our forward model in XLCT.4
Fig. 1.
The phantom geometry for numerical simulations with six targets. The target diameter and edge-to-edge distances are 1.0, 0.5, 0.2 and 0.1 mm for different simulation cases.
In the numerical simulation studies, we used a straight pencil beam with different diameters to scan the phantom for simplification. The beam size change is not considered. We included the x-ray beam attenuations in the simulations. The x-ray intensity along the collimated x-ray beam at position r can be expressed as:
| (1) |
where T0 is the initial x-ray intensity at the collimator and assumed to be T0 = 1.
To investigate how the number of angular projections affects the XLCT reconstruction, we have performed the numerical simulations of 6 targets for the cases with a target diameter and an edge-to-edge distance of 0.1 mm from the measurements using angular projections of 3, 6, 12, 24, and 36 with the angular step sizes f 60, 30, 15, 7.5 and 5 degrees, respectively. For this study, the scanning x-ray beam had a diameter of 0.1 mm, the same as the target diameter.
For the all simulation cases, numerical measurements were generated from the forward modeling in which the phantom was discretized by a finite element mesh with 26,638 nodes, 153,053 tetrahedral elements and 11,456 face elements. Finally, 50% Gaussian noise was added to the numerical measurements. Although XLCT reconstruction is three dimensional, we only reconstructed the scanned transverse section of the phantom. To minimize the effects of the grid size on the XLCT image quality, the scanned transverse section was discretized with a 2D grid having a pixel size of 25 × 25 μm2. We followed the same method for including the actual x-ray beam size and position into the XLCT reconstruction algorithm,4 in which a majorization-minimization (MM) algorithm was applied to minimize the L1 regularized mismatch between measured and modeled photon intensity and to update XLCT images iteratively. The details of the MM algorithm have been described elsewhere.13,14
2.2. Phantom experimental setup
2.2.1. XLCT experimental imaging system
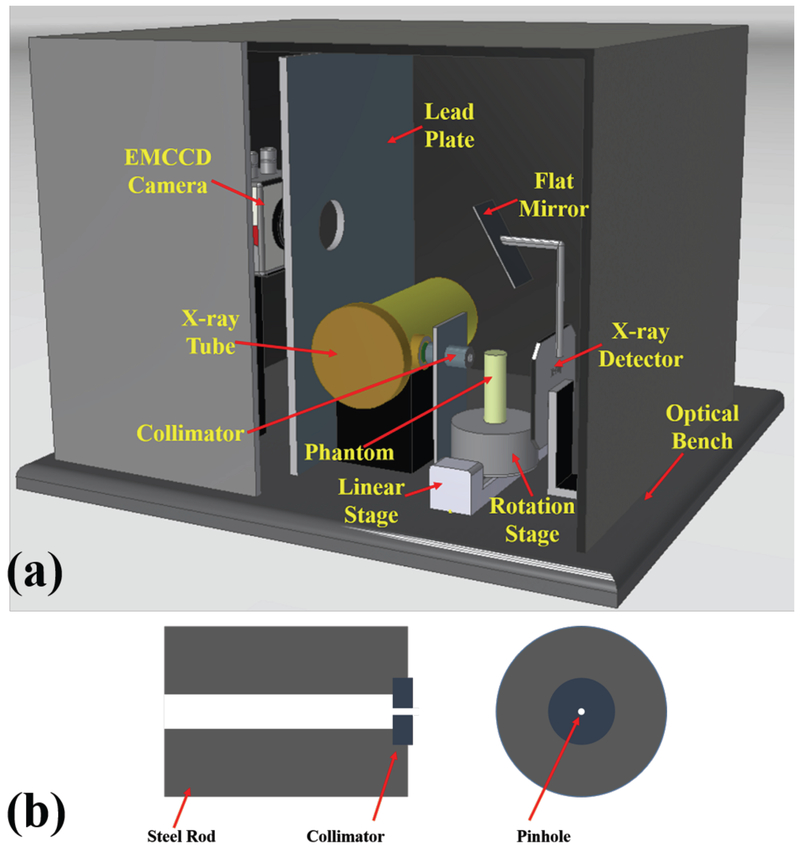
The XLCT system design is shown in Fig. 2a. An x-ray tube (93212, Oxford Instruments X-Ray Technology) generated x-ray photons up to 50 kVp with a tube current of 2 mA. The generated x-ray photons were collimated by a 5.08 cm long steel rod collimator with a central through hole of 1 mm in diameter and outside diameter of 25.4 mm. At the far end of the steel rod, we embedded a 1 mm thick tungsten disk collimator with a 0.1 mm pinhole, which was used to generate the superfine x-ray beam. The collimator design is depicted in Fig. 2b. The objects to be imaged were placed on a motorized rotary stage (B4872TS-ZR, Velmex, Inc.) that was mounted on a motorized linear stage (MB2509Q1J-S3, Velmex, Inc.). The center of the object was 10 mm away from the collimator. The position and size of the collimated x-ray beam were measured by an x-ray detector (Shad-o-Box 1024, GOS scintillator screen, Rad-icon Imaging Corporation), which has a detection area of 49.2 × 49.2 mm2 with 1024 × 1024 pixels and a pixel size of 48 × 48 μm2. The distance from the x-ray tube to the x-ray detector was 150 mm. The emitted optical photons from the phantom top surface were reflected by a flat mirror and acquired by a water-cooled electron multiplying charge-coupled device (EMCCD) camera (C9100–13, Hamamatsu) with a focus lens (50 mm, f/1.4 ZE planar T* manual focus, Carl Zeiss). A 5 mm thick lead plate with a circular aperture was placed between the EMCCD camera and the x-ray tube to protect the EMCCD camera from high energy x-ray photons. The reflected optical photons from the mirror pass the circular aperture to the EMCCD camera. As shown in Fig. 2, the imaging system was mounted on an optical table and placed inside an x-ray shielding and light tight cabinet. The system was controlled by a lab-made program written in C++ in the Visual Studio® development environment.
Fig. 2.
(a) 3D design of the superfine x-ray beam based XLCT imaging system; (b) Side and top views of the collimator design used in the phantom experiment.
2.2.3. Experimental phantom setup
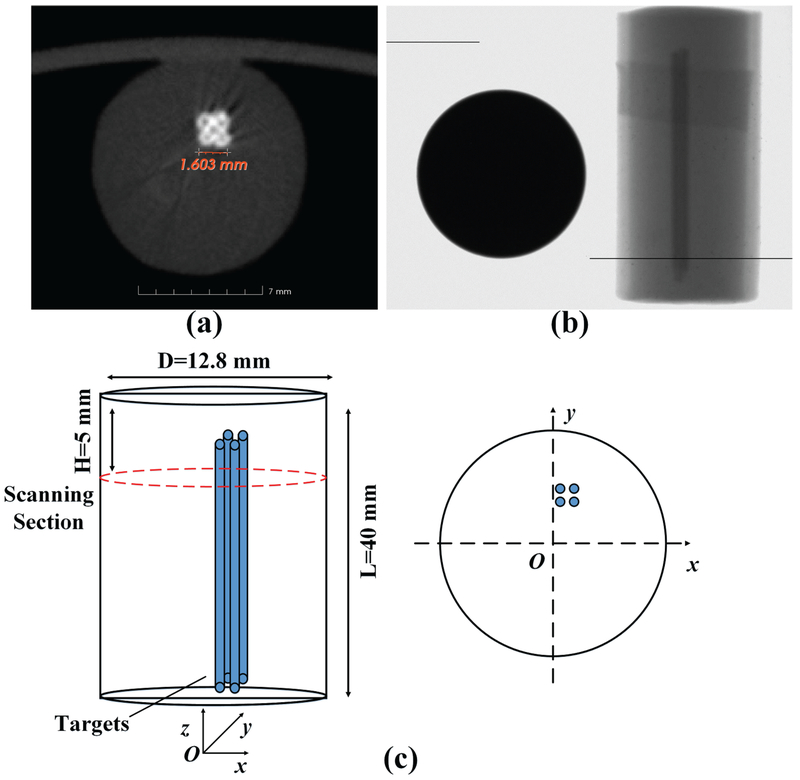
We have performed the phantom experiment with four targets to validate the feasibility of the high resolution XLCT imaging system. We used a 40 mm long and 12.7 mm diameter water phantom composed of 1% intralipid and 2% agar. For the phantom experiment, we had the target compositions of 1% intralipid, 2% agar, and 10 mg/ml GOS:Eu3+ (UKL63/UF-R1, Phosphor Technology Ltd). We filled the phosphor solution in capillary tubes, which then solidified at the room temperature and then embedded them side by side in the background phantom, as shown in Fig. 3. The glass tube has an inner diameter of 0.4 mm and a wall thickness of 0.2 mm. As shown in Fig. 3(c), the targets were located at (0.5 mm, 1.95 mm), (1.3 mm, 1.95 mm), (0.5 mm, 2.75 mm), and (1.3 mm, 2.75 mm). A superfine x-ray beam with a diameter of 0.1 mm was used to validate the feasibility of high resolution XLCT. The x-ray detector was used to determine the phantom boundary during measurements by examining the x-ray beam intensity changes. During the experiments, the phantom was scanned with the x-ray beam at a depth of 5 mm below the top surface, as shown in Fig. 3(c). We acquired measurement data at 6 angular projections with an angular step size of 30 degrees. To cover the entire scanning plane, the linear scan step was 65 for each angular projection with a step size of 0.2 mm. During measurements, the EMCCD camera was cooled to −92 °C with a water-cooling system and was operated at maximum gain (electron-multiplying (EM) gain of 255 and analog gain of 5) with an optical measurement mode of 0. The x-ray tube current was 2 mA at a tube voltage of 50 kVp. The EMCCD camera exposure time was 20 seconds for each linear scan position.
Fig. 3.
(a) A microCT image of the phantom with four targets; (b) A side view x-ray projection image of the phantom (right) with a penny (left) as reference; (c) Phantom geometry for the experiment where four capillary tubes are the targets.
2.3. Evaluation criteria
Three criteria were used to evaluate the quality of the reconstructed XLCT images, as described in Ref. 14:
Target Size Error (TSE): This criterion is defined as the percentage error between the reconstructed target and the true target diameters and is calculated as:
where Dr and Dt are the diameters of reconstructed and true target, respectively. Dr is calculated from the cross target profile plot by using the full width tenth maximum (FWTM) approach, in which we measured the width at the tenth of the maximum.
Center-to-center Distance Error (CDE): For multiple target imaging, we define CDE as the distance error ratio between the reconstructed targets and the true targets that is calculated as:
where Distr and Distt are the center-to-center distance (CtCD) between the reconstructed targets and the true targets, respectively. Distr is also calculated from the cross target profile plot by using the FWTM approach.
Dice Similarity Coefficient (DICE): DICE is used for comparing the similarity between the reconstructed and true targets and is calculated as:
where ROIr is the reconstructed region of interest that is defined to be the pixels whose intensities are higher than 10% of the the maximum of the normalized reconstructed intensity, and ROIt is the true target region. Generally, the closer DICE is to 100%, the better.
3. RESULTS
3.1. Results of numerical simulations
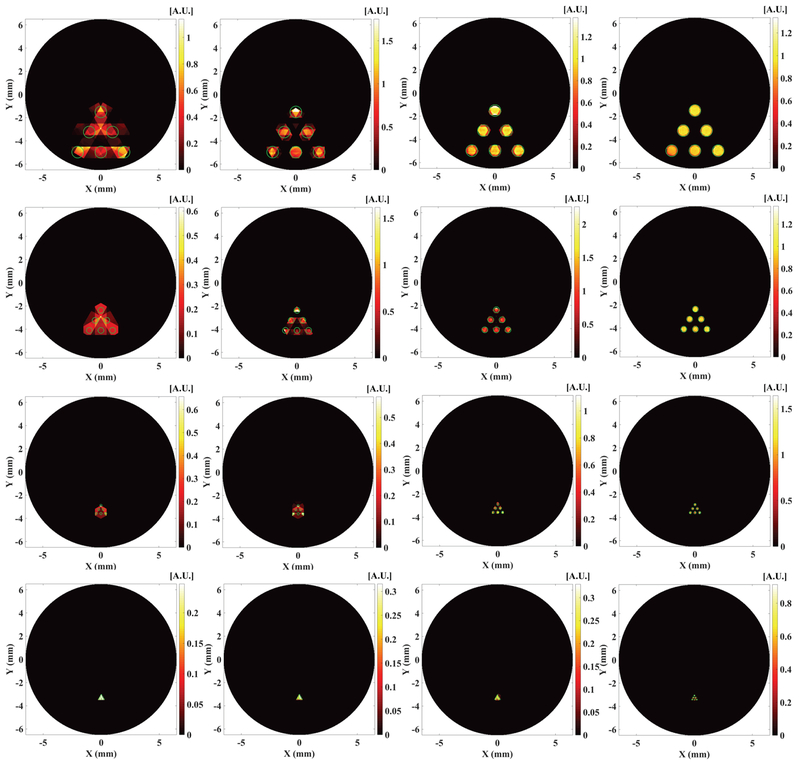
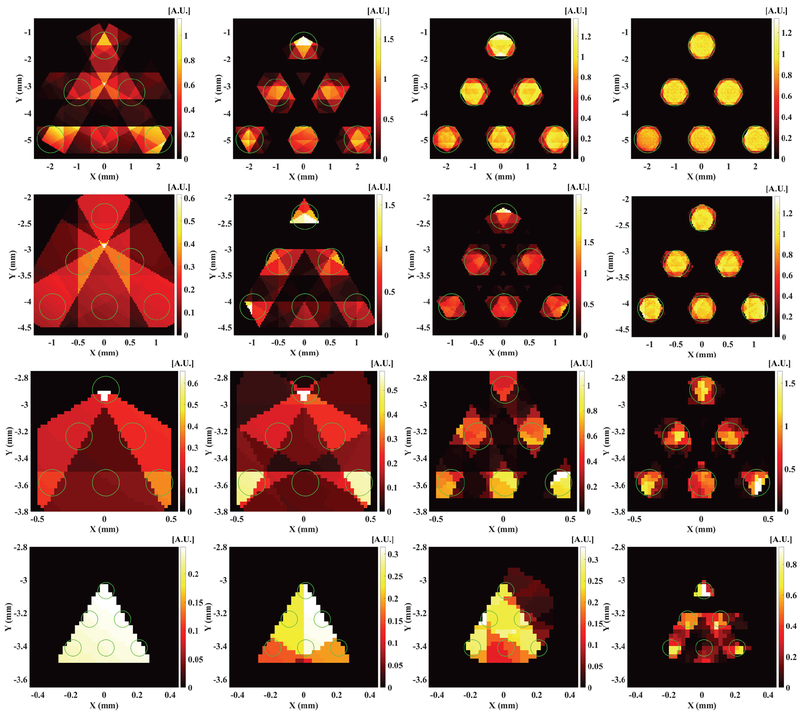
With the MM reconstruction algorithm, we reconstructed the XLCT images from the numerical measurements for different x-ray beam sizes. The reconstructed XLCT images are plotted in Fig. 4 for the target diameters of 1.0, 0.5, 0.2 and 0.1 mm in the 1st, 2nd, 3rd and 4th row, respectively. In Fig. 4, the pictures in the 1st, 2nd, 3rd and 4th columns from left to right represent the reconstructed XLCT images with the collimator size of 1.0, 0.5, 0.2 and 0.1 mm, respectively. Fig. 5 plots the corresponding zoomed-in pictures of the target region in Fig. 4. In Figs. 4 and 5, the green circles represent the true target size and position for each simulation case. From Figs. 4 and 5, it is seen that the scan with smaller beam size (right column) has better XLCT image quality. In both Fig. 4 and 5, as indicated by the pictures of the 1st column in the 1st row, the 2nd column in the 2nd row, the 3rd column in the 3rd row, and the 4th column in the 4th row, we see that the 6 targets can be reconstructed when the collimator size equals the edge-to-edge distance among targets from the measurements at 6 angular projections. The image quality degrades when the larger x-ray beams were used, which indicates that the targets could not be separated very well when we scan objects with an x-ray beam whose diameter is larger than the edge-to-edge distance.
Fig. 4.
Reconstructed XLCT images for numerical simulation cases for different target diameters of 1, 0.5, 0.2 and 0.1 mm in the 1st, 2nd, 3rd and 4th row, respectively, from measurements at 6 angular projections scanned by an x-ray beam with a diameter of 1, 0.5, 0.2 and 0.1 mm in the 1st, 2nd, 3rd and 4th column from left to right.
Fig. 5.
The zoomed in target region corresponding to the figures in Fig. 4. Each row and each column indicate the same numerical simulation case in Fig. 4.
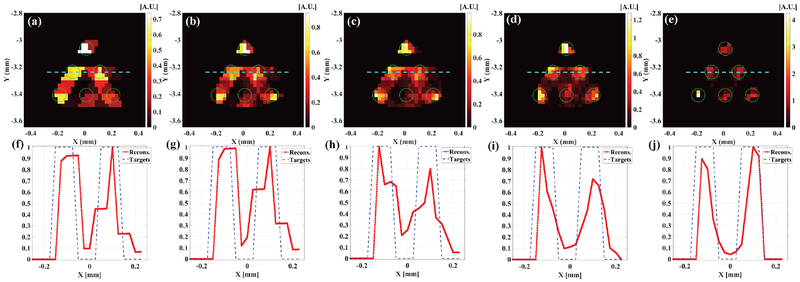
Fig. 6 plots the reconstructed XLCT images of a numerical phantom with 6 targets, each of which has a diameter of 0.1 mm, scanned by a superfine x-ray beam of 0.1 mm in diameter. The numerical simulation setup was the same as the previously mentioned simulation but with measurements at different angular projections of 3, 6, 12, 24, and 36, respectively. From Fig. 6, it is seen that the six targets could be reconstructed with 6 projections and the reconstructed image quality is better with more angular projections. For simplicity, we only plotted profile plots across the middle row targets. The quantitative image quality metrics was calculated from these profile plots. Table 1 lists the quantitative image quality metrics for different projections, from which we see that the TSE is 58.25%, 72.5%, 69.25%, 57.75%, and 9.75% for measurements at 3, 6, 12, 24, and 36 angular projections, respectively, which further validates that more projections result in better image quality. The reconstructed XLCT images in Fig. 6 indicate that XLCT can achieve a spatial resolution of 200 micrometers if we scan the deeply embedded targets with a superfine x-ray beam with a diameter of 100 micrometers.
Fig. 6.
The reconstructed XLCT images and the corresponding profile plots for the cases of 6 targets (each target with a diameter of 0.1 mm) with measurements at angular projections of 3 (a, f), 6(b, g), 12(c, h), 24 (d, i) and 36 (e, j). The x-ray beam to scan targets has a diameter of 0.1 mm. The dotted blue line indicates the horizontal profile plot position.
Table 1.
Quantitative imaging quality metrics for numerical simulations.
| Number of angular projections | Diameter (mm)/TSE | CtCD (mm)/CDE | DICE |
|---|---|---|---|
| 3 | 0.1583/58.25% | 0.1833/8.38% | 60.87% |
| 6 | 0.1725/72.5% | 0.1725/13.75% | 56.76% |
| 12 | 0.1693/69.25% | 0.1692/15.38% | 56% |
| 24 | 0.1578/57.75% | 0.1652/17.38% | 62.69% |
| 36 | 0.1097/9.75% | 0.1843/7.88% | 78.43% |
3.2. Results of phantom experiments
The MM reconstruction algorithm was used to reconstruct XLCT images for the phantom experiments as in the numerical simulations. For the XLCT reconstruction, the phantom was discretized by a finite element mesh with 26,638 nodes, 153,053 tetrahedral elements and 11,456 face elements. The reconstructed transverse section was also discretized with a 2D grid with a pixel size of 100×100 μm2 for reconstruction. The measured x-ray beam size models were applied in the XLCT reconstruction.
As reported in reference 9, we have measured the x-ray beam diameter and the averaged intensity (intensity per pixel). The measurements indicate that the collimated x-ray beams are conical and the beam diameters change linearly as the distance increases. For the 0.1 mm collimator case, the x-ray beam diameter changed from 160 to 190 μm in the phantom region with a diameter of 175 μm in the phantom center. The intensity curves show that the x-ray intensity attenuates exponentially along a straight line. These measured x-ray beam diameter and intensity were fitted with models that were applied in the XLCT reconstructions of the following phantom experiment.
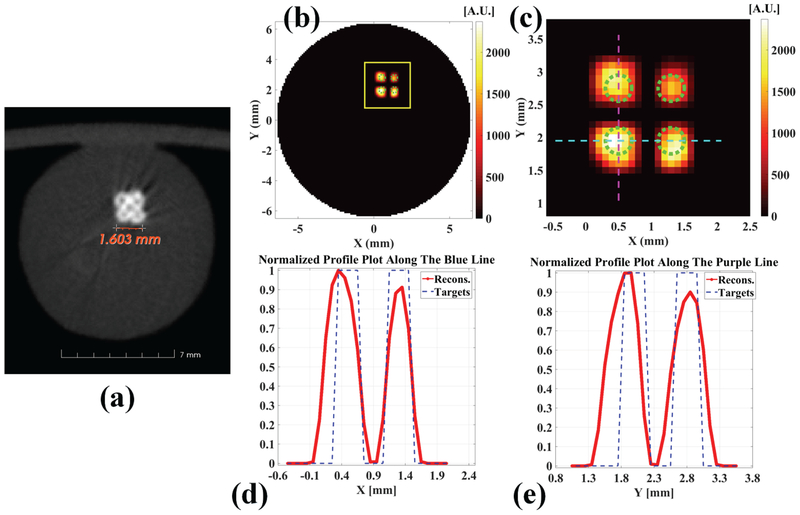
For the experimental phantom, Fig. 7(a) plots a transverse section of the microCT image. Fig. 7(b) shows the reconstructed XLCT image. To view the reconstructed targets better, we plot the zoomed in targets in Fig. 7(c). The normalized line profile across the bottom two targets (horizontal targets) is plotted in Fig. 7(d). The profile location is indicated by the blue line in Fig. 7(c). The profile across the left two targets (vertical targets) is plotted in Fig. 7(e) and the profile location is indicated by the purple line in Fig. 7(c). All the four targets have been separated and reconstructed successfully at the correct locations in the reconstructed XLCT image as shown in Fig. 7(b, c). We have calculated the reconstructed image quality metrics as shown in Table 2. The reconstructed CtCD is 0.9036 mm at FWTM with a CDE of 12.95% for horizontal targets, while CtCD is 0.9985 mm at FWTM with a CDE of 24.81% for vertical targets. The DICE is 39.34%. All these quantitative image quality metrics indicate that multiple deeply embedded small targets can be reconstructed successfully by using a superfine collimated x-ray beam.
Fig. 7.
Reconstructed XLCT results for the phantom experiment with four target case. (a) A transverse section from the reconstructed CT image; (b) The reconstructed XLCT image and (c) the zoomed in region, the dotted green circles indicate the exact target size and position; (d) The profile plot across bottom two targets (horizontal targets) as indicated in the dotted blue line in (c); (e) The profile plot across left two targets (vertical targets) as indicated in the dotted purple line in (c).
Table 2.
Quantitative imaging quality metrics for phantom experiment.
| Diameter (mm)/TSE | CtCD (mm)/CDE | DICE | |
|---|---|---|---|
| Horizontal targets | 0.7146/78.66% | 0.9036/12.95% | 39.34% |
| Vertical targets | 0.8025/100.63% | 0.9985/24.81% |
4. DISCUSSION AND CONCLUSIONS
From the experimental results described above, we see that XLCT can image and separate deeply embedded targets with an edge-to-edge distance as small as 0.4 mm using measurements at six angular projections with a superfine x-ray beam of 0.175 mm in diameter to scan the phantoms. Our numerical simulation results demonstrate that XLCT can achieve a spatial resolution of two times of the scanning x-ray beam diameter. We expect to achieve a spatial resolution of 0.35 mm with our superfine collimated x-ray beam of 0.175 mm. However, it is quite challenging for us to make such small phosphor targets in deep turbid media. Thus, we cannot verify it experimentally in this study. We will study how to fabricate small XLCT targets in the future.
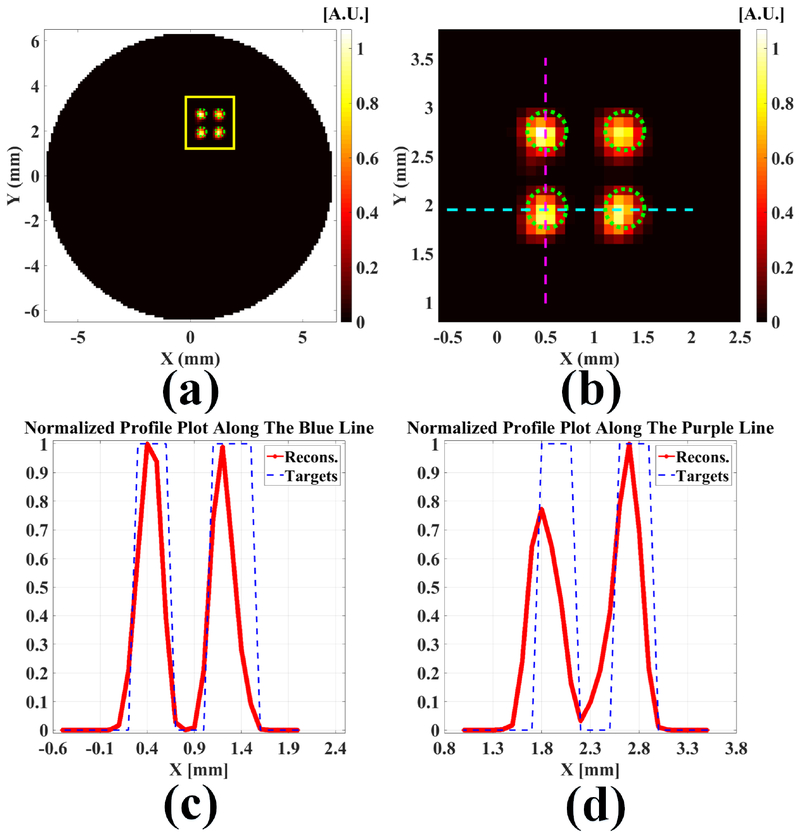
To compare the experimental results with numerical simulations directly, we have performed a numerical simulation with the same phantom geometry and the same XLCT scanning scheme as those in the experiment. The numerical measurements were generated with the XLCT forward model and then were added 50% Gaussian noises. It is worth noting that we used the real x-ray beam size in both the forward model and the XLCT reconstruction. The reconstructed XLCT images and the profiles across the targets are plotted in Fig. 8. The DICE was found to be 58.5%, larger than the 39.34% for the experimental case. After comparing Fig. 8 with Fig. 7, we see that all four targets have been reconstructed successfully for both numerical simulation and experimental cases. Although the numerical simulation has slightly better results, it is reasonable because there are many other factors in the experiment to deteriorate the results. One possible factor is the x-ray beam attenuation and scattering. Another factor is the target fabrication.
Fig. 8.
Numerical simulation results with the same setup as the experiment. (a) The reconstructed XLCT image and (b) the zoomed in region, the dotted green circles indicate the exact target size and position; (c) The profile plot across bottom two targets (horizontal targets) as indicated in the dotted blue line in (b); (d) The profile plot across left two targets (vertical targets) as indicated in the dotted purple line in (b).
The results of the numerical simulations and phantom experiments indicate that the x-ray beam size is a key factor to achieve high spatial resolution of the XLCT imaging. We have demonstrated that it is impossible to separate two targets when the x-ray beam size is larger than the target edge-to-edge distance as indicated by Figs. 4 and 5. When the x-ray beam size is close to the edge-to-edge distance, it is possible to separate two deeply embedded targets but with poor image quality as shown in Fig. 6(e). We have also performed numerical simulations with measurements at more angular projections such as 12, 24 and 36. Our results demonstrated that more angular projections could result in better XLCT image quality, especially when the x-ray beam size is close to the edge-to-edge distance.
There are many factors in quantifying the reconstructed values since XLCT is a quantitative imaging modality. Each factor needs careful calibrations, which is beyond the scope of this paper because our goal here is to show that XLCT can achieve high spatial resolution with superfine x-ray beams and how the x-ray beam size affects the XLCT spatial resolution.
With the current setup, it took a long time to acquire measurements at six projections. The current measurement time is 6×65×20 seconds or 130 minutes. In the future, we will pursue new scanning schemes to acquire measurements in a shorter time. One of the approaches is to use a focused x-ray beam to improve the x-ray beam photon intensity so that the measurement time can be reduced15. At the same time, we can use a higher sensitive photon detector such as photomultiplier tube (PMT) to reduce the measure time substantially15. We expect to scan one section in less than 1 minute in the future setup.
We have demonstrated that a small collimator of 0.1 mm diameter can be used to generate a superfine x-ray beam with a diameter as small as 0.175 mm. However, most x-ray photons are absorbed by the collimator thus the x-ray utilization efficiency is low, which contributes to the long measurement time. The focused x-ray beam is a better choice for our future XLCT design to improve the x-ray photon flux in the x-ray beams.
Recently we have reported that XLCT is sensitive enough to reconstruct a phosphor target at a depth as large as 21 mm with a phosphor concentration less than 0.01 mg/mL.16 In this study, our results indicate that it is feasible to achieve good spatial resolution for a deep target. Those studies will provide guidance for the future XLCT imaging system design.
In conclusion, we have built a prototype XLCT imaging system with collimated superfine x-ray beams. With numerical simulations and phantom experiments, we have demonstrated that the spatial resolution of XLCT depends on the scanning x-ray beam size and a spatial resolution around double of the x-ray beam diameter can be achieved in imaging the deeply embedded phosphor targets.
ACKNOWLEDGEMENTS
This work is supported in part by Grants (R03 EB022305) from the National Institute of Health (NIH) and Start Up funds from UC Merced. The authors also thank Prof. Simon R. Cherry from University of California, Davis for lending us the x-ray detector and the x-ray tube in the microCT setup.
Footnotes
CONFLICT OF INTEREST DISCLOSE
The authors have no COI to report.
REFERENCES
- [1].Zhang H, Maslov K, Stoica G, and Wang LV, “Functional photoacoustic microscopy for high-esolution and noninvasive in vivo imaging,” Nat. Biotechnol 24(7), 848–851 (2006). [DOI] [PubMed] [Google Scholar]
- [2].Li C, Di K, Bec J, and Cherry SR, “X-ray luminescence optical tomography imaging: experimental studies,” Opt. Lett 38(13), 2339–2341 (2013). [DOI] [PMC free article] [PubMed] [Google Scholar]
- [3].Pratx G, Carpenter CM, Sun C, Rao RP, and Xing L, “Tomographic molecular imaging of x-ray-excitable nanoparticles,” Opt. Lett 35(20), 3345–3347 (2010). [DOI] [PubMed] [Google Scholar]
- [4].Li C, Martinez-Davalos A, Cherry SR, “Numerical simulation of x-ray luminescence optical tomography for small-animal imaging,” J. Biomed. Opt 19(4), 046002 (2014). [DOI] [PMC free article] [PubMed] [Google Scholar]
- [5].Zhang W, Zhu D, Zhang K, and Li C, “Microscopic x-ray luminescence computed tomography,” Proc. SPIE 9316, 93160M (2015). [Google Scholar]
- [6].Pratx G, Carpenter CM, Sun C, and Xing L, “X-ray luminescence computed tomography via selective excitation: a feasibility study,” IEEE Trans. Med. Imaging 29(12), 1992–1999 (2010). [DOI] [PubMed] [Google Scholar]
- [7].Chen D, Zhu S, Yi H, Zhang X, Chen D, Liang J, and Tian J, “Cone beam x-ray luminescence computed tomography: A feasibility study,” Med. Phys 40(3), 031111 (2013). [DOI] [PubMed] [Google Scholar]
- [8].Liu X, Liao Q, and Wang H, “In vivo x-ray luminescence tomographic imaging with singleview data,” Opt. Lett 38(22), 4530–4533 (2013). [DOI] [PubMed] [Google Scholar]
- [9].Zhang W, Zhu D, Lun M, and Li C, “Multiple pinhole collimator based X-ray luminescence computed tomography,” Biomed. Opt. Express 7(7), 2506–2523 (2016). [DOI] [PMC free article] [PubMed] [Google Scholar]
- [10].Dehlinger M, Fauquet C, Lavandier S, Aumporn O, Jandard F, Arkadiev V, Bjeoumikhov A, and Tonneau D, “Spatial resolution of confocal XRF technique using capillary optics,” Nanoscale Res. Lett 8, 271 (2013). [DOI] [PMC free article] [PubMed] [Google Scholar]
- [11].Cong W, Pan Z, Filkins R, Srivastava A, Ishaque N, Stefanov P, and Wang G, “X-ray micromodulated luminescence tomography in dual-cone geometry,” J. Biomed. Opt 19(7), 076002 (2014). [DOI] [PMC free article] [PubMed] [Google Scholar]
- [12].Colletti LP, Havrilla GJ, “Specimen preparation limitations in trace element analysis quantification using micro-x-ray fluorescence,” JCPDS-International Centre for Diffraction Data 2000, Advances in x-ray Analysis 42, 64–73 (2000). [Google Scholar]
- [13].Zhu D, Li C, “Nonuniform update for sparse target recovery in fluorescence molecular tomography accelerated by ordered subsets,” Biomed. Opt. Express 5(12), 4249–4259 (2014). [DOI] [PMC free article] [PubMed] [Google Scholar]
- [14].Zhu D, Li C, “Nonconvex regularizations in fluorescence molecular tomography for sparsity enhancement,” Phys. Med. Biol 59(12), 2901–2912 (2014). [DOI] [PubMed] [Google Scholar]
- [15].Zhang W, Lun M, and Li C, “Fiber based fast sparse sampling X-ray luminescence computed tomography,” Proc. SPIE 10057, 1005704 (2017). [Google Scholar]
- [16].Lun MC, Zhang W, and Li C, “Sensitivity study of x-ray luminescence computed tomography,” Appl. Opt 56(11), 3010–3019 (2017). [DOI] [PMC free article] [PubMed] [Google Scholar]


