

Abstract
Non-collagenous proteins are a vital component of bone matrix. Amongst them, osteocalcin (OC) and osteopontin (OPN) hold special significance due to their intimate interaction with the mineral and collagenous matrix in bone. Both proteins have been associated with microdamage and fracture, but their structural role in energy dissipation is unclear. This study used bone tissue from genetic deficient mice lacking OC and/or OPN and subjected them to a series of creep-fatigue-creep tests. To this end, whole tibiae were loaded in four-point bending to 70% stiffness loss which captured the three characteristic phases of fatigue associated with initiation, propagation, and coalescence of microdamage. Fatigue loading preceded and followed creep tests to determine creep and dampening parameters. Microdamage in the form of linear microcracks and diffuse damage were analyzed by histology. It was shown that OC and OPN were ‘activated’ following stiffness loss associated with fatigue damage where they facilitated creep and dampening parameters (i.e. increased energy dissipation). More specifically, post-fatigue creep rate and dampening were significantly greater in wild-types (WTs) than genetic deficient mice (p<0.05). These results were supported by microdamage analysis which showed significant increase in creep-associated diffuse damage formation in WTs compared to genetic deficient groups (p<0.05). Based on these findings, we propose that during local yield events, OC and OPN rely on ionic interactions of their charged side chains and on hydrogen bonding to dissipate energy in bone.
Keywords: Bone, osteocalcin, osteopontin, interface, creep, fatigue, microdamage
Introduction
Bone mechanical properties deteriorate with age (Reilly and Burstein, 1976), and fragility fractures present a considerable public health concern (Johnell and Kanis, 2004). The fracture resistance of bone is derived from its hierarchical composite structure, where hydroxyapatite mineral particles (HA) reinforce the collagenous organic matrix (Krauss et al. 2009). In this intricate structure, physiological loading leads to accumulation of defects (i.e. microdamage), which lowers the threshold for fracture (Carter and Hayes, 1977). Bone’s capacity to undergo plastic deformation, without fracture, is one of its most important mechanical functions. Understanding how bone employs its nanostructure to achieve this function is critical to improving bone health, reducing fracture risk, and potentially designing materials that mimic bone biomechanics.
Plastic deformation is attributed mostly to bone’s organic matrix (Reilly and Burstein, 1976), where type-I collagen is the principal component. However, the role of noncollagenous proteins (NCPs) in bone deformation is not fully understood. Most of the NCPs are present in amounts far lower than collagen and are known primarily to regulate bone mineralization (Gericke et al. 2005, Boskey et al. 1998, Poundarik et al. 2018), partake in cell signaling (Sroga and Vashishth, 2012), and exhibit hormonal functions (Oury et al. 2013). Recent evidence demonstrated the ability of NCPs like osteocalcin (OC) and osteopontin (OPN) to enhance fracture resistance of bone (Fantner et al. 2005; Fantner et al. 2007; Poundarik et al. 2012). Given that diffuse damage forms in rodent and human bone (Benetolia et al., 1998; Diab et al., 2007) and diffuse damage formation allows bone to dissipate energy without causing overt fracture (Zioupos et al., 1994; Boyce et al., 1998; George and Vashishth 2005; Diab and Vashishth 2005), it is likely that OC and OPN may play a key role in determining creep and fatigue-induced material changes and the energy dissipation in bone.
OC is a bone-specific protein known for its role in bone turnover (Ducy et al. 1996), energy metabolism (Lee et al. 2007), and its ability to bind to bone mineral via several surface-exposed carboxylate groups (Hoang et al. 2003). In contrast to 6 kDa OC, OPN is a 34 kDa protein that does not have a defined secondary structure (Sodek et al. 2000). OPN fragments are indicated in a number of signaling functions, and its charged amino acid residues make it capable of forming sacrificial bonds in vitro (Fantner et al. 2007), as well as interacting with HA surface and collagen (Kaartinen et al. 1999; Boskey et al. 2012). OPN plays a role in nucleating bone mineral [Gericke et al. 2005] and also binds to extracellular calcium via its phosphorylated (serine and threonine) and acidic (aspartate and glutamate) residues. Together, OC and OPN were shown to enhance fracture toughness of whole bone (Poundarik et al. 2012), and it was proposed that they form a non-covalent adduct akin to the complex observed in vitro (Ritter et al. 1992). These adducts link extrafibrillar HA surfaces and, during fracture, stretch and dissipate mechanical energy.
Perhaps the most important process occurring in bone structure to resist fracture at two hierarchical levels is plastic sacrificial sliding. At the first level, within the individual mineralized fibrils (MF), shearing of tropocollagen (TC) between the intrafibrillar HA platelets protects the HA platelets from excessive loading (Buehler 2007). At the second level, the level of arrays of mineralized collagen fibrils (MF), the shearing of the extrafibrillar matrix protects the MFs from exceeding their critical (failure) load (Krauss et al. 2009; Gupta et al. 2006; Gupta et al. 2013). This two-level sacrificial sliding at the nanoscale is also manifested at the tissue level. Measuring Poisson’s ratio in bone at the tissue level reveals that, under tension, bone dilates with near-zero transverse strain, and the increase in volume is accounted for by formation of voids (Mercer et al 2006). These voids correspond to dilatational bands, in which OC and OPN act to dissipate energy during fracture (Poundarik et al. 2012). Dilatational bands are also observed within diffused damage areas in bone undergoing fatigue and creep (Carter and Hayes 1977; Fondrk et al. 1988; Nicolella et al. 2011; Bentolila et al. 1998; Diab and Vashishth 2007). It is thus plausible that OC and OPN would contribute to bone fatigue and creep functions under loads such that the applied loading does not lead to overt fracture.
In the above context, this work seeks to determine whether OC and OPN can enhance bone’s response to sub-critical levels of static and cyclic loading. To isolate the contribution of OC and OPN to the mechanical properties of bone, this study evaluates creep and fatigue in bone tissue from mice genetically modified to lack either OC, OPN, or both, and from their wildtype (WT) littermates.
Methods
Sample preparation
All animal procedures were approved by IACUC and are in compliance with the NIH guidelines. Hind-limbs from male 6 month old OC−/− (n=11), OPN−/− (n=11), OC-OPN−/−;−/−(n=11), and C57/BL/6 WT littermate (n=9) mice were used in this study. One tibia per donor was selected from each group. Two OC−/− samples broke during fatigue testing and the postfatigue data was therefore not available. The bones were rid of soft tissue, and instrumented with strain gauge (EA-13–015DJ-120, Vishay) bonded on the lateral surface at 50% of the bone length. The strain data was acquired via hardware interface during mechanical loading (Enduratec ELF 3200, Bose).
A custom fixture was used for 4-point bending where the fixed bottom supports were 10 mm and top supports were 3 mm apart. The two top supports were axially supported on a lever-fulcrum to adapt to the specimen geometry and to distribute the loading force evenly (Figure 1). To account for variation in the specimen geometry, the maximum force of each specimen was determined by a linear ramp load at 40 N/sec until 5000 με was measured in the strain gauge on the bone surface. This individualized loading level was used as the maximum load in cyclic loading and creep tests. The bones were loaded such that the lateral side was in tension and the medial side was in compression (Hsieh et al. 1999). Bones were kept wet during testing by a saline drip.
Figure 1.
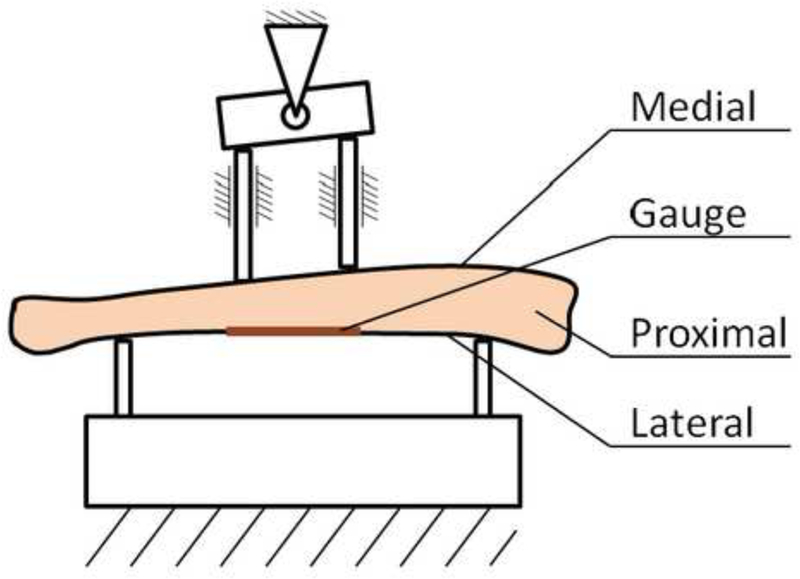
Schematic of the 4-point bending of the tibia instrumented with tensile strain gauge on its lateral surface. Top supports are 3 mm and bottom supports are 10 mm apart.
Creep testing
Creep testing was done before and after fatigue loading using the method established by Fondrk et al. (Fondrk et al. 1988). Bone specimens were loaded in load control, using 60 s loading period separated by 60 s recovery period and 0.5 N load maintained the contact between the bone and the fixture (Figure 2A). The loading was increased stepwise from 4 N in increments of 2 N to the maximum load, which corresponded to the load required to reach 5000 με. The acquired displacement data were fitted by least squares method using a function which superposed an exponential and a straight line (Figure 2B). The straight line fitted to the 20–60s region of the creep curve defines the creep rate β1 (Figure 2C). At the maximum loading force, the strain exceeds the 5000 με value. The creep rate β1 presented here was interpolated from creep rates, measured during the individual loading steps, as the value corresponding to loading at 5000 με.
Figure 2.
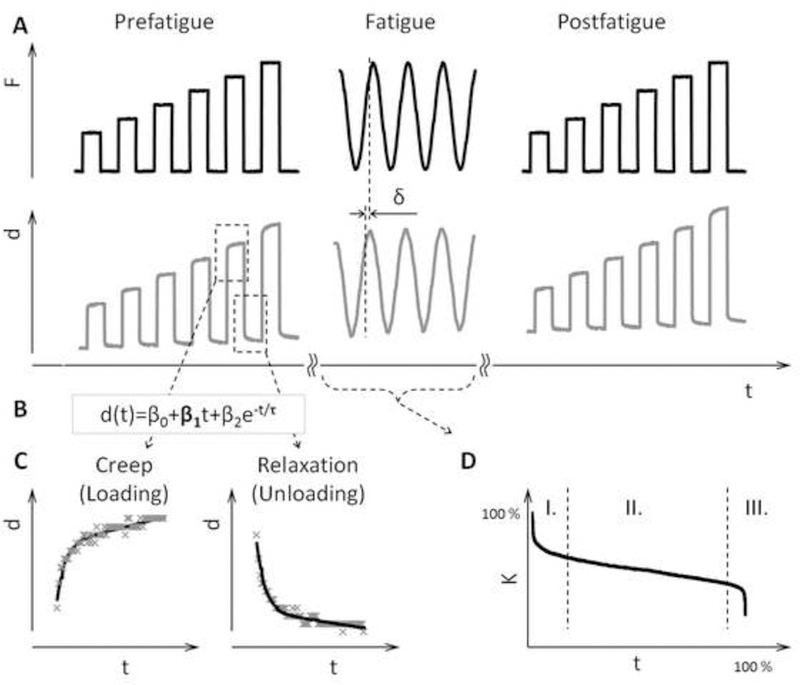
Schematic of the test protocol. Creep test was carried out pre- and post-fatigue. Each creep segment had 60 s duration and cyclic loading was applied at 2 Hz (A). Displacement under static loading was evaluated in terms of the time constant τ and the steady state creep rate β1 (B) for creep and recovery (C). The fatigue loading proceeded through phases I, II, and III, and was stopped when 70% loss of initial stiffness K was reached (D).
Fatigue loading
Fatigue loading was done in load control by cycling a 2 Hz sine wave between 1 N and the predetermined maximum load. Cyclic loading was stopped in the tertiary phase of fatigue life, at 70 % loss of initial stiffness (Figure 2D). The initial stiffness was defined as the apparent stiffness in the first cycle of fatigue loading and the apparent stiffness is the measured force divided by the measured displacement. The fatigue behavior in the three phases of fatigue life was represented by the instantaneous stiffness Ki and dampening parameter δ. Ki can be defined at any point of the loading cycle as the slope of the loading-displacement curve. For analysis Ki was resolved at 8 distinct points of each loading cycle. Sections 1–4 sampled the increasing loading, and sections 5–8 sampled the decreasing half of the loading cycle (Figure 3A). To better represent instantaneous stiffness of a given section over an entire fatigue phase by a single value, a method exploiting a polynomial fit was employed. Instead of averaging the values over a certain time period, the stiffness data were fitted by a cubic polynomial, and the factors of the polynomial fit were then used to calculate a representative stiffness at time points corresponding to 0%, 50% and 100% completion of the fatigue test. This polynomial fit-based method offered more robust representation of the bone behavior than simple averaging over a selected time period.
Figure 3.
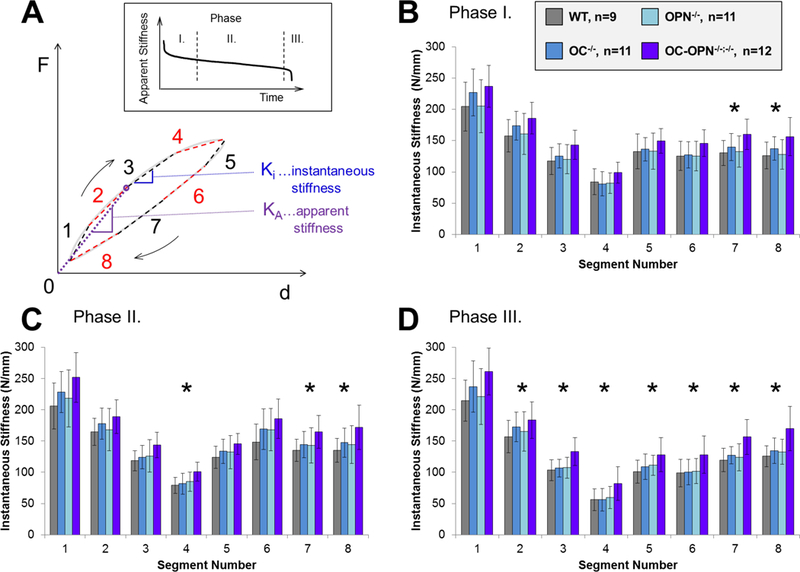
The loading cycle was separated into 8 segments, and instantaneous stiffness Ki was assessed in each segment (A). Ki was defined as the slope of the force-displacement curve. The dashed line in the inset serves as visual aid to highlight the three distinct phases of fatigue life. The Ki changes in the progress of three phases of fatigue (A, inset), which are represented in B, C and D. The error bars represent the standard deviation. The Ki difference between the OC-OPN−/−;−/− and all other groups (indicated by *) becomes increasingly significant (p<0.05) as the fatigue test progresses.
The dampening parameter, δ, was calculated from two consecutive loading cycles, taken at the beginning, middle, and at the end of the test. Specifically, the displacement and loading measured over two consecutive cycles were fitted by a sine function, and the dampening parameter was obtained as the difference between the phases of displacement and loading. The dampening parameter is independent of force and displacement amplitudes, and merely captures the phase delay between them. As a reference, in a perfectly elastic material, this delay is zero and it increases with increasing dissipation of mechanical energy, i.e. dampening.
Microdamage Assessment
Following creep and fatigue loading, a subset of specimens from the four groups (n=6) were assessed for microdamage. Samples were stained in 1% basic fuchsin and embedded in polymethyl methacrylate (PMMA). Transverse sections through the region of the strain gauge were created at 100 µm thickness. Diffused damage and linear microcracks were observed on the sections using a laser scanning confocal microscope (Zeiss LSM 510Meta, Carl Zeiss, Germany). Each section was initially imaged at 10x for calculating the total bone cross sectional area (CSA) and total number of linear microcracks (sharply defined lines). Diffused damage areas were confirmed using 40x objective with water, and appeared as submicroscopic cracks in regions of pooled staining. Image acquisition specifications included: z-stack of 4 slices per bone section (13.13 µm), 543 nm excitation laser, 560 nm LP filter, and 8 average lines per scan. Damage quantification was conducted by two single-blinded observers and the calculations of CSA, linear crack density (# of LMC/CSA), and diffuse damage area fraction (diffuse damage area/CSA) were averaged.
Statistics
In this test design, creep and fatigue behavior of bone were assessed in response to the presence or absence of OC and/or OPN. The mechanical parameters pre- and post- fatigue creep rate, β1, and fatigue properties including stiffness (Ki, KA) and dampening (δ) were compared between the groups by one way ANOVA followed by post hoc Student-Newman-Keuls method. All analyses were done using the Sigma Plot software package.
Results
Stiffness loss during fatigue loading
The measured load and displacement in a given loading cycle, termed apparent stiffness, KA, decreased in a characteristic 3-phase manner (Figure 3 A - inset) and, per experimental design, bone samples reached approximately 70% of initial stiffness without overt fracture. At the beginning of the fatigue testing, the instantaneous stiffness (determined using 8 segments described in Figure 3A) in all four groups gradually decreased as the load approached the 5000 με level (Figure 3 B , segments 1 through 4), but remained relatively even during the recovery (unloading) portion of the cycle (Figure 3 B, segments 5 through 8). This characteristic difference between recovery and loading was noted for all three phases, in all groups. The difference in Ki between the groups was only significant during segments 7 and 8 of Phase I (Figure 3 B), but it reached a significantly higher value in the OC-OPN−/−;−/− group during other segments as the test progressed to Phases II and III of fatigue loading (Figure 3 C, D) (p<0.05).
Energy dissipation (dampening) during fatigue
In all groups, the dampening decreased in the second phase compared to Phase I, and then increased again in the third phase of fatigue life. When the groups were compared, no difference was found, until phase II, where OC-OPN−/−;−/− bones demonstrated significantly less dampening than WT (p = 0.024) and OC−/− (p = 0.021). In Phase III, the OC-OPN−/−;−/− mice dampened less than the WT (p = 0.005), OC−/− (p = 0.007), and OPN−/− (p = 0.005) groups (Figure 4A).
Figure 4.
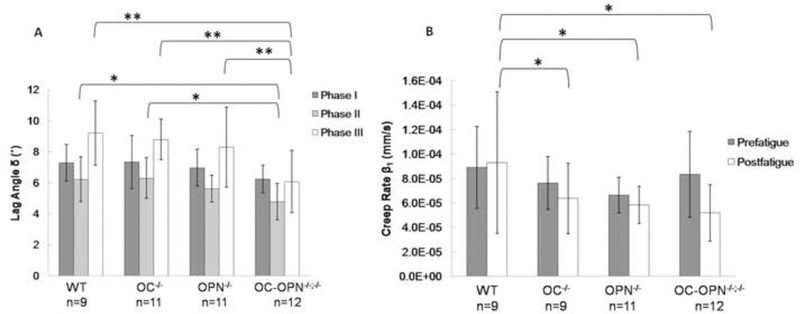
(A) Dampening parameter (lag angle) δ measured in all experimental groups in three phases of fatigue. The fatigue life is sampled by three time points. One at the beginning (Phase I), second at the midpoint (Phase II), and third at the end of the fatigue test (Phase III). * indicates p < 0.05;** indicates p < 0.01. The error bars represent the standard deviation. (B) Creep rate β1 in all experimental groups measured pre- and post-fatigue where the asterisk indicates statistical significance (p < 0.05) and error bars represent the standard deviation.
Creep Behavior
The prefatigue creep rate (β1) did not differ significantly among the groups. However, creep tests conducted postfatigue revealed that the creep rate in OC-OPN−/−;−/− tissue was significantly lower (p = 0.016) than in the WT control (Figure 4B). The postfatigue creep rate in OC−/− and OPN−/− reached values similar to OC-OPN−/−;−/−, and the difference from WT was significant for both OPN−/− (p = 0.034) and OC−/− (p=0.042). Thus, the application of fatigue loading lead to changes in creep behavior in bones where the genetic deficient bones creeped at a slower rate than WT littermates.
Microdamage Assessment
Microdamage was noted in all four groups following fatigue loading and creep testing (Figure 5). Due to non-normal distribution of the data (Shapiro-Wilk, p<0.05), Kruskal-Wallis One Way ANOVA was used to determine differences between the groups. There were no differences in linear microcracks between the groups (p>0.05) (Table 1). However, diffuse damage was significantly greater in the WTs compared to the genetic deficient groups (p=0.032).
Figure 5:
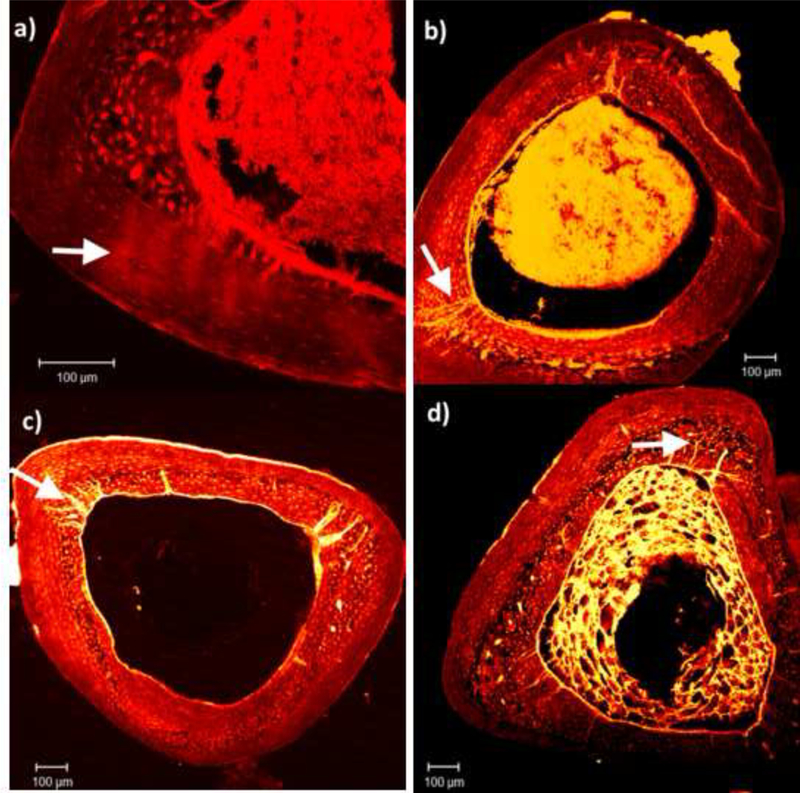
Microdamage formation in mice of different genotypes. Diffuse damage was observed in WT (a), while linear microcracks were predominant in the genetic deficient mice: OPN−/− (b), OC−/− (c), and OC-OPN−/−;−/− (d). Images were taken at 10× magnification. Arrows in (a) mark diffuse damage and arrows (b to d) represent linear microcracks.
Table 1:
Linear microcracks and diffuse damage in four mice genotypes including wild-type (WT), osteocalcin knock-out (OC−/−), osteopontin knock-out (OPN−/−) and osteocalcin-osteopontin double knock-out (OC-OPN−/−;−/−) following creep and fatigue loading described in Figure 2.
| Genotype | Linear Microcrack Density (#LMC/mm2) |
Diffused Damage Density (mm2/ mm2) |
|---|---|---|
| WT | 6.00 ± 4.60 | 0.054 ± 0.055 |
| OC−/− | 11.65 ± 4.09 | 0.001 ± 0.015 |
| OPN−/− | 6.27 ± 5.00 | 0.000 ± 0.00 |
| OC-OPN−/−;−/− | 6.74 ± 5.66 | 0.010 ± 0.036 |
Discussion
We have previously demonstrated that in the animal model used for this study, where OC and/or OPN were removed, the collagen and HA chemical structure and composition remained largely unaffected (Nikel et al. 2013). Thus, we can consider the interfacial energy in the OC and OPN mutants as approximately equivalent to the WT controls. The above view is supported by the data presented here which shows no statistically significant differences between the groups in prefatigue creep rate and the dampening parameter in the first phase of fatigue test. However, as the fatigue loading continued, the creep and dampening began to significantly differ between the groups. This behavior can be directly attributed to the presence or absence of OC and OPN, potentially at the organic-mineral interface.
OC and OPN have been previously implicated in bond breakage and energy dissipation during fracture (Fantner et al. 2007; Poundarik et al. 2012). It is plausible that the slower creep rate observed here in their absence can, too, be attributed to the energy dissipative capacity of these proteins. Specifically, we suggest that OC and OPN are tasked with facilitating plastic sliding in the MF-MF interfaces to protect the TC-HA interface at the lower hierarchical level (Figure 6). In the absence of breakable bonds, the extrafibrillar matrix has significantly lower capacity for energy dissipation. Consequently, the capacity for plastic deformation under a given load observably decreases in the absence of OC and OPN. This is in agreement with studies on the organic matrix of bone showing a positive association between microdamage, in the form of diffused damage, and post-yield deformation in bone (Wang and Nyman, 2007; Poundarik et al. 2015). The microdamage data presented here demonstrate the existence of diffused damage in WT fatigued bones, and its absence in genetic deficient fatigued bones. These results are indicative of why the presence of NCPs is critical to plastic deformation in bone.
Figure 6.
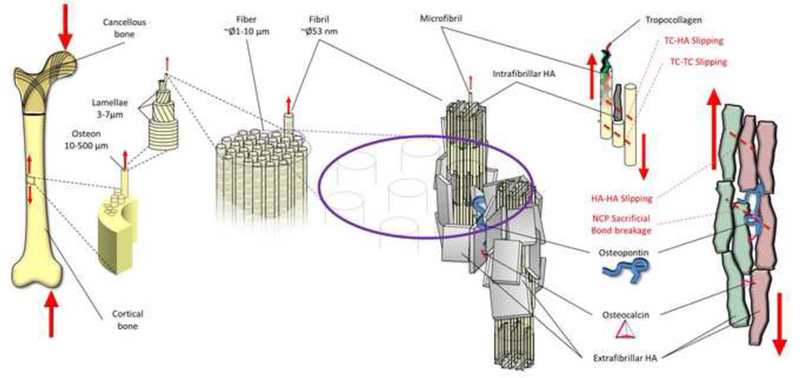
Bone is a hierarchical composite material, where the two most abundant noncollagenous proteins OC and OPN are embedded in the extrafibrillar space. Loading applied at organ level propagates through the hierarchical levels. When fatigue loading is applied, mineralized fibrils in certain locations begin to slide against each other, engaging dissipative interfaces. We propose that at that point, the load leads to disruption of the ionic interactions and hydrogen bonds of OC and OPN, which helps dissipate mechanical energy and prevent fracture.
The lower plasticity in bone from OC-OPN−/−;−/− mice is also in agreement with the higher instantaneous stiffness Ki measured in this study. In other words, bone lacking OC and OPN undergoes lower displacement under a given load. It is plausible that this difference in Ki reflects the decreased ability of mineralized fibrils (MF) to slide past each other. This impairment of “shielding by MF-MF sliding” will inherently lead to stronger loading on fewer individual mineralized fibrils and, at macroscopic level, would manifest in higher brittleness and stiffness. Such decrease in fracture toughness (i.e. increase in brittleness) was reported by Poundarik et al. (Poundarik et al. 2012), and the higher stiffness in OC-OPN−/−;−/− bones has been measured in this study (Figure 3 B–D). Although the load levels in all tests were normalized to the same strain level, Ki is not independent of specimen geometry. To fully rule out the influence of the specimen geometry and get a better understanding of the fatigue-induced changes at the material level, the dampening parameter δ is a more suitable measure of mechanical energy dissipation.
The dampening behavior during fatigue loading was not different between the groups in the first phase, when the microdamage in bone is being initiated (Diab and Vashishth, 2005). The difference between the groups only emerged during the second phase, where microcracks grow, and the difference became pronounced in the third phase, where microcracks coalesce. The fatigue-induced changes in bone at the material level thus engage OC and OPN and these proteins get ‘activated’ to play a key structural role following initiation of microdamage. It is important to note that the inferior dissipation of energy in OC-OPN−/−;−/− tissue (33% lower than WTs) clearly establishes the significant contribution of OC and OPN to bone mechanical properties. Specifically, OC and OPN plasticize bone in the cyclic loading regime, which occurs during intense physiological loading and does not result in an overt fracture. Differences in pre-fatigue creep rate could provide additional information on the progression of fatigue among the genotypes and perhaps further support the concept that OC and OPN plasticize bone. Nevertheless, the results suggest that OC and OPN might hold potential as therapeutic targets, and their concentration in bone could serve as a useful marker of bone fragility.
The data describing the mechanical behavior of tissues devoid of one or both NCPs can offer an insight into whether OC needs the presence of OPN (and vice versa) to carry out its mechanical function. The creep rate in single mutants (Figure 4B) suggests that OC and OPN benefit from the presence of each other and thus facilitate creep as an adduct. This is consistent with behavior of bone during fracture, where the OC-OPN adduct in bone allows it to resist fracture and the loss of one or both proteins results in a similar magnitude of toughness loss (Poundarik et al. 2012). It is however noteworthy that during the cyclic loading, OC and OPN seem to maintain their function as individual proteins (Figures 3 and 4A).
The rate of the deformation during cyclic loading is two orders of magnitude faster than the deformation during creep. It may very well be the case that during the relatively slow creep, OC-OPN adduct dissipates energy by mechanism different from the mechanism they employ under fatigue. Our prior knowledge of structure and in vitro interactions of OC and OPN (Price et al., 1976; Ritter et al., 1992; Huang et al., 2003) supports that the charged amino acids, highly concentrated in OC and OPN, are responsible for binding to the charged surfaces of extrafibrillar HA, and that they may break/reform these non-covalent bonds during the cyclic loading. To explain our results, we integrate our findings into the current understanding of bone structure (Figure 6). Several reports have established that, in loaded bone, the mineralized fibrils are shielded from critical loading by sliding past each other (Krauss et al. 2009; Gupta et al. 2006; Gupta et al. 2013). OC and OPN are too large to fit inside the mineralized fibrils, and bone’s nano-structure is indeed well preserved when they are removed (Nikel et al. 2013). We therefore propose that the contribution of OC and OPN to energy dissipation, observed in our experimental results, takes place in the extrafibrillar space.
To link the dissipative capacity of OC and OPN to the energy dissipated during the loading cycles, we first calculate the amount of energy dissipated in each cycle. This energy can be evaluated based on strain energy, which is a measure of mechanical energy, akin to force times displacement, stored in a given volume of a deformed solid. Although the stress was not measured directly in our study, it can be estimated using beam theory (Turner and Burr, 2003). When the loading cycle is plotted in stress-strain coordinates, the cycle forms a loop which encloses an area that corresponds to the dissipated strain energy. Strain energy is a volume-specific measure, so to obtain absolute energy, a particular volume needs to be considered. Given that OC and OPN function in extrafibrillar space, it is meaningful to select a model volume that captures this length scale. In a model volume of bone selected to be a cube with 100 nm edge, one 2 Hz loading cycle to 5000 με leads to dissipation of energy in the order of magnitude of 100 eV.
In order to show that OC and OPN could account for substantial portion of the energy that “dissipates” in the 1003 nm3 cube of bone, the dissipative capacity of OC and OPN was estimated based on published data. Considering the measurements of OC and OPN concentration reported elsewhere (Poundarik et al. 2012), a model 1003 nm3 bone cube would contain approximately 13 OCs and 1 OPN molecule. Breaking all side-chain interactions with Ca2+ would dissipate approximately 1.7 eV per OC molecule (Nousiainen et al. 2002) and 4.1 eV per OPN molecule (Chen et al. 1992). Disrupting the hydrogen bonds in the alpha helices (Lantz et al. 1999) could dissipate up to 5.7 eV per OC (Hoang et al. 2003) and 30.9 eV per OPN molecule (Denhardt and Guo, 1993). If all these disruptions occurred at once, they would account for up to approximately 131 eV. The approximately 0.5 eV interaction between OC and OPN (Ritter et al. 1992) would thus present only a minor contribution. It should be noted that the value of 131 eV represents an extreme scenario, where all of OC and OPN folding is completely disrupted. In nanoscale yield events occurring under physiologic fatigue such complete folding disruption is unlikely, and portion of the dissipated ~100 eV has to be accounted for by other dissipative processes. We propose that additional mechanical energy is dissipated by disrupting the interfaces of other noncollagenous organics such as glycosaminoglycans (GAGs) with HA and through the deformation of interfaces between the individual extrafibrillar platelets (HA-HA), where OC and OPN are absent.
Indeed, if we considered the extrafibrillar (EF) HA platelets to be 80 × 25 × 5 nm prisms, there would be approximately 50 EF platelets in our 1003 nm3 model volume. Consequently, there would be 4 EF HA platelets for each OC, and 50 EF platelets for each OPN. In other words, many of EF HA platelets would not be in contact with OC and OPN at all. It is known that the EF HA platelets are partially fused (McNally et al. 2012) and can transfer load directly between the fibrils during elastic deformation (Krauss et al. 2009). Interestingly, it has been shown that the interfaces of extrafibrillar HA platelets are bridged via citrate-rich layers of disordered HA (Davies et al. 2014). These disordered interfaces weaken the fused EF mineral which, at point of yield, cracks so that the separated EF platelets can slide on each other with friction, plausibly dissipating substantial amounts of energy.
Thus, taken together, our findings demonstrate the seminal role of NCPs osteocalcin and osteopontin in creep and fatigue of bone. The absence of these proteins diminishes the plasticity of bone matrix and its ability to withstand cyclical loading and creep. In particular, we show that OC and OPN are ‘activated’ following stiffness loss associated with fatigue damage where they facilitate creep and dampening (i.e. increased energy dissipation). These results were supported by microdamage analysis in fatigued bone which showed significant increase in creep-associated diffuse damage formation in WTs compared to genetic mutants. Additionally, our calculations regarding energy dissipation are in agreement with our data, where cyclic loading, involving nano-scale yield events, engages OC and OPN to dissipate mechanical energy and thus plasticize bone at tissue level. Based on these findings, we propose that during local yield events, OC and OPN rely on ionic interactions of their charged side chains and on hydrogen bonding to dissipate energy in bone.
Supplementary Material
Acknowledgements
Robert Davignon and Stephanie Krom for their help in mechanical testing. This work was funded by NIAMS AR49635 and by Ajit Prabhu Fellowship at Rensselaer Polytechnic Institute. We thank Caren Gundberg and Gerard Karsenty for providing the genetic knockout and WT littermates and David Burr and Keith Condon for histological preparation of microdamage sections.
Abbreviations:
- OC
Osteocalcin
- OPN
Osteopontin
- NCP
non collagenous protein
- OC−/−
osteocalcin knockout group
- OPN−/−
osteopontin knockout group
- OC-OPN−/−;−/−
osteocalcin and osteopontin double knockout group
- WT
wildtype littermate control group
- HA
hydroxyapatite bone mineral
- TC
tropocollagen
- MF
mineralized fibril
- EFM
extrafibrillar matrix
Footnotes
Publisher's Disclaimer: This is a PDF file of an unedited manuscript that has been accepted for publication. As a service to our customers we are providing this early version of the manuscript. The manuscript will undergo copyediting, typesetting, and review of the resulting proof before it is published in its final citable form. Please note that during the production process errors may be discovered which could affect the content, and all legal disclaimers that apply to the journal pertain.
Conflict of Interest Statement
Authors have no conflicts of interest.
References
- Bentolila V, Boyce TM, Fyhrie DP, Drumb R, Skerry TM, Schaffler MB, Intracortical remodeling in adult rat long bones after fatigue loading, Bone 23 (1998) 275–281. [DOI] [PubMed] [Google Scholar]
- Boskey AL, Christensen B, Taleb H, Sørensen ES, Post-translational modification of osteopontin: effects on in vitro hydroxyapatite formation and growth, Biochem. Biophys. Res. Commun 419 (2012) 333–338. [DOI] [PMC free article] [PubMed] [Google Scholar]
- Boskey AL, Gadaleta S, Gundberg C, Doty SB, Ducy P, Karsenty G, Fourier transform infrared microspectroscopic analysis of bones of osteocalcin-deficient mice provides insight into the function of osteocalcin, Bone 23(1998) 187–196. [DOI] [PubMed] [Google Scholar]
- Boyce TM, Fyhrie DP, Glotkowski MC, Radin EL, Schaffler MB. Damage type and strain mode associations in human compact bone bending fatigue. J Orthop Res 1998. May;16(3):322–9. [DOI] [PubMed] [Google Scholar]
- Buehler MJ, Molecular nanomechanics of nascent bone: fibrillar toughening by mineralization, Nanotechnology 18 (2007) 295102. [Google Scholar]
- Carter DR, Hayes WC, Compact bone fatigue damage-I. Residual strength and stiffness, J. Biomech 10 (1977) 325–337. [DOI] [PubMed] [Google Scholar]
- Chen Y, Bal BS, Gorski JP, Calcium and Collagen Binding Properties of Osteopontin, Bone Sialoprotein ad Bone Acidic Glycoprotein-75 from Bone, J. Biol. Chem 267 (1992) 24871– 24878. [PubMed] [Google Scholar]
- Davies E, Müller KH, Wong WC, Pickard CJ, Reid DG, Skepper JN, Duer MJ, Citrate bridges between mineral platelets in bone, Proc. Natl. Acad. Sci. U. S. A 111 (2014) E1354–E1363. [DOI] [PMC free article] [PubMed] [Google Scholar]
- Denhardt DT, Guo X, Osteopontin : a Protein with Diverse Functions, J. Fed. Am. Soc. Exp. Boil 7 (1993) 1475–1482. [PubMed] [Google Scholar]
- Diab T, Vashishth D, Effects of damage morphology on cortical bone fragility, Bone 37 (2005) 96–102. [DOI] [PubMed] [Google Scholar]
- Diab T, Vashishth D, Morphology, localization and accumulation of in vivo microdamage in human cortical bone, Bone 40 (2007) 612–618. [DOI] [PMC free article] [PubMed] [Google Scholar]
- Dowd TL, Rosen JF, Li L, Gundberg CM, The three-dimensional structure of bovine calcium ion-bound osteocalcin using 1H NMR spectroscopy, Biochemistry 42 (2003) 7769–7779. [DOI] [PMC free article] [PubMed] [Google Scholar]
- Ducy P, Desbois C, Boyce B, Pinero G, Story B, Dunstan C, Smith E, Bonadio J, Goldstein S, Gundberg C, Bradley A, Karsenty G, Increased bone formation in osteocalcin-deficient mice, Nature 382 (1996) 448–452. [DOI] [PubMed] [Google Scholar]
- Fantner GE, Adams J, Turner P, Thurner PJ, Fisher LW, Hansma PK, Nanoscale ion mediated networks in bone: osteopontin can repeatedly dissipate large amounts of energy, Nano Lett 7 (2007) 2491–2498. [DOI] [PubMed] [Google Scholar]
- Fantner GE, Hassenkam T, Kindt JH, Weaver JC, Birkedal H, Pechenik L, Cutroni JA, Cidade GAGA, Stucky GD, Morse DE, Hansma PK, Sacrificial bonds and hidden length dissipate energy as mineralized fibrils separate during bone fracture, Nat. Mater 4 (2005) 612–616. [DOI] [PubMed] [Google Scholar]
- Fondrk M, Bahniuk E, Davy DT, Michaels C, Some Viscoplastic Characteristics of Bovine and Human Cortical Bone, J. Biomech 21 (1988) 623–630. [DOI] [PubMed] [Google Scholar]
- Gautieri A, Buehler MJ, Redaelli A, Deformation rate controls elasticity and unfolding pathway of single tropocollagen molecules, J. Mech. Behav. Biomed. Mater 2 (2009) 130–137. [DOI] [PubMed] [Google Scholar]
- Gericke A, Qin C, Spevak L, Fujimoto Y, Butler WT, Sørensen ES, Boskey AL, Importance of phosphorylation for osteopontin regulation of biomineralization, Calcif. Tiss. Internat 77 (2005) 45–54. [DOI] [PMC free article] [PubMed] [Google Scholar]
- George WT, Vashishth D. Damage mechanisms and failure modes of cortical bone under components of physiological loading. J Orthop Res 2005. September;23(5):1047–53 [DOI] [PubMed] [Google Scholar]
- Gupta HS, Krauss S, Kerschnitzki M, Karunaratne A, Dunlop JWC, Barber H, Boesecke P, Funari SS, Fratzl P, Intrafibrillar plasticity through mineral/collagen sliding is the dominant mechanism for the extreme toughness of antler bone, J. Mech. Behav. Biomed. Mater 28 (2013) 366–382. [DOI] [PubMed] [Google Scholar]
- Gupta HS, Seto J, Wagermaier W, Zaslansky P, Boesecke P, Fratzl P, Cooperative deformation of mineral and collagen in bone at the nanoscale, Proc. Natl. Acad. Sci. U. S. A 103 (2006) 17741–17746. [DOI] [PMC free article] [PubMed] [Google Scholar]
- Hoang QQ, Sicheri F, Howard AJ, Yang DSC, Bone recognition mechanism of porcine osteocalcin from crystal structure, Lett. to Nat 425 (2003) 977–980. [DOI] [PubMed] [Google Scholar]
- Hsieh YF, Wang T, Turner CH, Viscoelastic Response of the Rat Loading Model : Implications for Studies of Strain-Adaptive Bone Formation, Bone 25 (1999) 379–382. [DOI] [PubMed] [Google Scholar]
- Johnell O, Kanis JA, An estimate of the worldwide prevalence, mortality and disability associated with hip fracture, Osteoporos. Int 15 (2004) 897–902. [DOI] [PubMed] [Google Scholar]
- Kaartinen MT, Pirhonen A, Linnala-Kankkunen A, Mäenpää PH, Cross-linking of Osteopontin by Tissue Transglutaminase Increases Its Collagen Binding Properties, J. Biol. Chem 274 (1999) 1729–1735. [DOI] [PubMed] [Google Scholar]
- Krauss S, Fratzl P, Seto J, Currey JD, a Estevez J, Funari SS, Gupta HS, Inhomogeneous fibril stretching in antler starts after macroscopic yielding: indication for a nanoscale toughening mechanism, Bone 44 (2009) 1105–1110. [DOI] [PubMed] [Google Scholar]
- Laizé V, Martel P, Viegas CS., Price PA, Cancela ML, Evolution of matrix and bone gamma-carboxyglutamic acid proteins in vertebrates, J. Biol. Chem 280 (2005) 26659–26668. [DOI] [PubMed] [Google Scholar]
- Lantz MA, Jarvis SP, Tokumoto H, Martynski T, Kusumi T, Nakamura C, Miyake J, Stretching the α-helix: a direct measure of the hydrogen-bond energy of a single-peptide molecule, Chem. Phys. Lett 315 (1999) 61–68. [Google Scholar]
- Lee NK, Sowa H, Hinoi E, Ferron M, Ahn JD, Confavreux C, Dacquin R, Mee PJ, McKee MD, Jung DY, Zhang Z, Kim JK, Mauvais-Jarvis F, Ducy P, Karsenty G, Endocrine Regulation of Energy Metabolism by the Skeleton, Cell 130 (2007) 456–469. [DOI] [PMC free article] [PubMed] [Google Scholar]
- McNally EA, Schwarcz HP, Botton GA, Arsenault AL, A model for the ultrastructure of bone based on electron microscopy of ion-milled sections, PLoS One 7 (2012) e29258. [DOI] [PMC free article] [PubMed] [Google Scholar]
- Mercer C, He MY, Wang R, Evans G, Mechanisms governing the inelastic deformation of cortical bone and application to trabecular bone, Acta Biomater 2 (2006) 59–68. [DOI] [PubMed] [Google Scholar]
- Nicolella DP, Ni Q, Chan KS, Non-destructive characterization of microdamage in cortical bone using low field pulsed NMR, J. Mech. Behav. Biomed. Mater 4 (2011) 383–91. [DOI] [PMC free article] [PubMed] [Google Scholar]
- Nikel O, Laurencin D, McCallum SA, Gundberg CM, Vashishth D, NMR investigation of the role of osteocalcin and osteopontin at the organic-inorganic interface in bone, Langmuir 29 (2013) 13873–13882. [DOI] [PMC free article] [PubMed] [Google Scholar]
- Nousiainen M, Derrick PJ, Kaartinen MT, Mäenpää PH, Rouvinen J, Vainiotalo P, A Mass Spectrometric Study of Metal Binding to Osteocalcin, Chem. Biol 9 (2002) 195–202. [DOI] [PubMed] [Google Scholar]
- Oury F, Khrimian L, Denny CA, Gardin A, Chamouni A, Goeden N, Karsenty G, Maternal and offspring pools of osteocalcin influence brain development and functions, Cell 155 (2013) 228–241. [DOI] [PMC free article] [PubMed] [Google Scholar]
- Poundarik AA, Diab T, Sroga GE, Ural A, Boskey AL, Gundberg CM, Vashishth D, Dilatational band formation in bone, Proc. Natl. Acad. Sci. U. S. A 109 (2012) 19178–19183. [DOI] [PMC free article] [PubMed] [Google Scholar]
- Poundarik AA, Wu PC, Evis Z, Sroga GE, Ural A, Rubin M, Vashishth D, A direct role of collagen glycation in bone fracture, J. Mech. Behav. Biomed. Mater 52 (2015) 120–130. [DOI] [PMC free article] [PubMed] [Google Scholar]
- Poundarik AA, Boskey A, Gundberg C, Vashishth D, Biomolecular regulation, composition and nanoarchitecture of bone mineral, Scientif. Rep 8 (2018) 1191. [DOI] [PMC free article] [PubMed] [Google Scholar]
- Price PA, Otsuka AS, Poser JW, Kristaponis J, Raman N, Characterization of a y-carboxyglutamic acid-containing protein from bone, Proc. Natl. Acad. Sci. U. S. A 73 (1976) 1447–1451. [DOI] [PMC free article] [PubMed] [Google Scholar]
- Ritter Farach-Carson MC, Butler WT, Evidence for the formation of a complex between osteopontin and osteocalcin, J. Bone Miner. Res 7 (1992) 877–885. [DOI] [PubMed] [Google Scholar]
- Qin Z, Gautieri A, Nair AK, Inbar H, Buehler MJ, Thickness of Hydroxyapatite Nanocrystal Controls Mechanical Properties of the Collagen − Hydroxyapatite Interface, Langmuir 28 (2012) 1982–1992. [DOI] [PubMed] [Google Scholar]
- Reilly DT, Burstein AH, The Mechanical Properties of Cortical Bone, J. Bone Jt. Surg 56 (1976) 1001–1022. [PubMed] [Google Scholar]
- Sodek J, Ganss B, McKee MD, Osteopontin, Crit. Rev. Oral Biol. Med 11 (2000) 279–303. [DOI] [PubMed] [Google Scholar]
- roga GE, Vashishth D, Effects of bone matrix proteins on fracture and fragility in osteoporosis, Curr. Osteoporos. Rep 10 (2012) 141–150. [DOI] [PMC free article] [PubMed] [Google Scholar]
- Turner CH, Burr DB, Basic Biomechanical Measurements of Bone: A Tutorial, Bone 14 (1993) 595–608. [DOI] [PubMed] [Google Scholar]
- Wang X, Nyman JS, A novel approach to assess post-yield energy dissipation of bone in tension. J. Biomech 40 (2007) 674–677. [DOI] [PMC free article] [PubMed] [Google Scholar]
- Zioupos P, Currey JD, Sedman AJ. An examination of the micromechanics of failure of bone and antler by acoustic emission tests and Laser Scanning Confocal Microscopy. Med Eng Phys 1994. May;16(3):203–12. [DOI] [PubMed] [Google Scholar]
Associated Data
This section collects any data citations, data availability statements, or supplementary materials included in this article.