

Abstract
Objective
This systematic review aimed to critically analyze the literature to determine how high-intensity intermittent training (HIIT) affects recreational endurance runners in the short- and long-term.
Methods
Electronic databases were searched for literature dating from January 2000 to October 2015. The search was conducted using the key words “high-intensity intermittent training” or “high-intensity interval exercise” or “interval running” or “sprint interval training” and “endurance runners” or “long distance runners”. A systematic approach was used to evaluate the 783 articles identified for initial review. Studies were included if they investigated HIIT in recreational endurance runners. The methodological quality of the studies was evaluated using the Physiotherapy Evidence Database (PEDro) scale (for intervention studies) and the modified Downs and Black Quality Index (for cross-sectional studies).
Results
Twenty-three studies met the inclusionary criteria for review. The results are presented in 2 parts: cross-sectional (n = 15) and intervention studies (n = 8). In the 15 cross-sectional studies selected, endurance runners performed at least 1 HIIT protocol, and the acute impact on physiological, neuromuscular, metabolic and/or biomechanical variables was assessed. Intervention studies lasted a minimum of 4 weeks, with 10 weeks being the longest intervention period, and included 2 to 4 HIIT sessions per week. Most of these studies combined HIIT sessions with continuous run (CR) sessions; 2 studies' subjects performed HIIT exclusively.
Conclusion
HIIT-based running plans (2 to 3 HIIT sessions per week, combining HIIT and CR runs) show athletic performance improvements in endurance runners by improving maximal oxygen uptake and running economy along with muscular and metabolic adaptations. To maximize the adaptations to training, both HIIT and CR must be part of training programs for endurance runners.
Keywords: Endurance, High-intensity training, Intermittent exercises, Interval running, Long-distance runners, Running
1. Introduction
Running has no age or gender restrictions, and it does not require expensive equipment or workout facilities. These are just some of the reasons that make running an increasingly popular sport. As the popularity of races such as the New York, London, and Madrid marathons shows, there is a growing number of recreational runners becoming involved in competition. Runners essentially pursue 2 objectives: (1) to improve their athletic performances and (2) to be healthy enough to keep training and achieving their aims.
With respect to the first objective, recent reviews have highlighted the potential of varying quantities of both high-intensity intermittent training (HIIT) and continuous high-volume, low-intensity training on performance in athletes.1, 2, 3 Although there is no doubt that both types of training can effectively improve cardiac and skeletal muscle metabolic function4, 5 and that a dose of both types of training is an important constituent of an athlete's training program, endurance runners often think “more is better” and so accumulate great volumes of running kilometers,6 spending most of their time training at low or moderate intensities.6
A growing body of literature highlights the role of mean training intensity over a season in optimizing athletic performance.1, 4, 5, 7, 8 A clear example for endurance runners was reported by Billat et al.,9 who showed that male Kenyan runners training at higher speeds had a significantly better 10 km performance than Kenyan athletes training at lower speeds, despite the elite status of both groups. In this context, as a type of training that results in athletes running faster, previous studies have remarked on the importance of HIIT1, 2, 3, 4, 5, 7, 8, 10, 11, 12, 13, 14, 15, 16 for maximizing performance in endurance athletes. Although there is no universal definition, HIIT generally refers to repeated short to long bouts of high-intensity exercise—performed at close to 100% maximal oxygen uptake (VO2max)—interspersed with recovery periods, and it is considered one of the most effective forms of exercise for improving the physical performance of athletes.1, 4, 5, 7, 8
Compared with lower-intensity cyclic workloads, intensive running requires activation of a larger motor unit, with increased recruitment of fast oxidative and glycolytic muscle fibers and an increase in the intensity of chemical processes in the muscle.17, 18 Additionally, increases in running speed lead to greater levels of neuromuscular engagement (mainly in the hamstring muscles).19 Likewise, some differences have been observed between HIIT protocols (with different durations of work and relief intervals) in both physiological and neuromuscular impact.20, 21, 22, 23, 24, 25, 26 Coaches must themselves decide how to manage HIIT inclusion in running plans for endurance athletes, so knowledge about the acute changes induced by HIIT protocols and the long-term adaptations induced by HIIT-based interventions in endurance runners plays a key role in the training prescription.
Because there is strong evidence that a greater training distance per week is a risk factor for lower extremity running injuries,27 HIIT also seems to be an “interesting option” for avoiding injuries (regarding the second aim mentioned at the beginning of this section, “to be healthy enough to keep training and achieving their aims”). The incidence of running-related injuries on an annual basis is high, occurring in 40% to 50% of runners.28 Even though it is widely accepted that injuries in endurance runners are multifactorial, it is also well known that running-related injuries are often attributable to training errors.29 Because of a lack of studies evaluating injury occurrence, the effects of more strenuous runs on markers related to risk of injury are still unknown, so this review mainly focuses on the effects of HIIT on endurance performance.
To the best knowledge of the authors, 14 reviews have so far been written about HIIT,1, 2, 3, 4, 5, 7, 8, 10, 11, 12, 13, 14, 15, 16 of which only 212, 13 were systematically performed by and included information about literature search strategies. Five of these 14 studies focused on sprint interval training (SIT), with work periods at maximal intensities,10, 11, 12, 13, 14 whereas the other 9 considered different HIIT regimens at submaximal intensities. As for the type of population, 3 studies focused on active healthy people,12, 13, 15 whereas the other 11 related to trained athletes. Among them, only Billat7, 8 focused on endurance runners, with 2 works published in 2001. Therefore, a systematic review that summarizes findings and new evidence about how HIIT affects recreational endurance runners from a multidisciplinary perspective (physiological, neuromuscular, and biomechanical) in the short and long term is needed, and this is the main purpose of the current work.
2. Methods
2.1. Search strategy
Electronic databases, including PubMed, ScienceDirect, Web of Science, and SPORTDiscuss, were searched for literature dating from January 2000 to October 2015. The keywords used were “high-intensity intermittent training” or “high-intensity interval exercise” or “interval running” or “sprint interval training” and “endurance runners” or “long distance runners”. The search was limited based on text availability (full-text available), publication date (from January 2000 to October 2015), species (humans), language (English), and age (≥18 years). Duplicates between searches were removed. Results of the search procedures are summarized in Fig. 1.
Fig. 1.
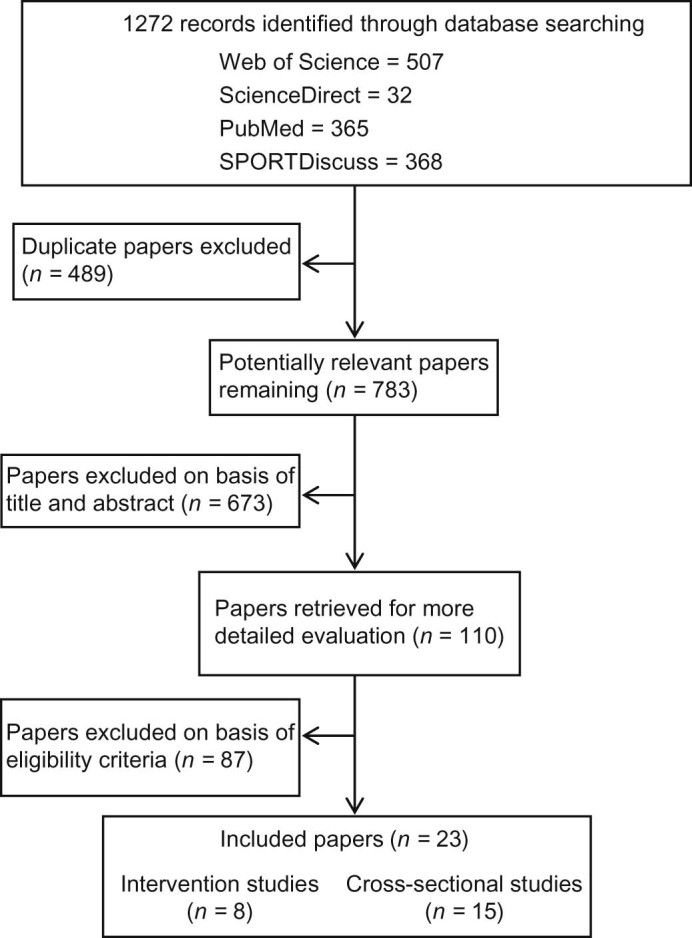
Flowchart illustrating the different phases of the search and selection of the studies.
2.2. Selection criteria
Studies were included in the review if they met the following criteria: (1) published in peer-reviewed journals; (2) included participants 18 years or older; (3) involved recreational endurance runners; and (4) used run-based testing sessions and, in the case of intervention studies, run-based training programs. Studies were excluded if they (1) did not meet the minimum requirements of an experimental study design (e.g., case reports), (2) did not meet the minimum requirements regarding training design (e.g., lack of information on volume, frequency, and/or intensity of training), (3) were not written in English, or (4) involved untrained subjects, team sport athletes, or nonendurance runners. Additionally, review articles were not included in this systematic review. Based on the inclusion and exclusion criteria, 2 independent reviewers (FGP and PALR) screened the citations of potentially relevant publications. If the citation showed any potential relevance, it was screened at the abstract level. When abstracts indicated potential inclusion, full-text articles were reviewed. A third-party consensus meeting was held with a third author (VMSH) if the 2 reviewers were not able to reach agreement on inclusion of an article.
2.3. Quality assessment
For cross-sectional studies (those focused on examining the acute effects of HIIT protocols on physiological, metabolic, neuromuscular, and biomechanics measurements), quality was assessed using the modified version of the Quality Index developed by Downs and Black.30 The original scale was reported to have good test–retest (r = 0.88) and inter-rater (r = 0.75) reliability and high internal consistency (Kuder–Richardson Formula 20 (KR-20) = 0.89). The modified version of the Downs and Black Quality Index is scored from 1 to 14, with higher scores indicating higher-quality studies.
For intervention studies (those focused on the impact of HIIT-based running programs on physiological, metabolic, neuromuscular, and biomechanics measurements), methodological quality was assessed using the Physiotherapy Evidence Database (PEDro) scale,31 an 11-item scale that rates randomized controlled trials from 0 to 10, with 6 representing the cutoff score for high-quality studies. One question was used to establish external validity and was not included in the score. Only studies with PEDro scores of 6 or higher were considered for the systematic review.31 Maher et al.31 demonstrated fair-to-good inter-rater reliability with an intraclass correlation coefficient of 0.68 when using consensus ratings generated by 2 or 3 raters. Eight studies met the inclusion criteria.32, 33, 34, 35, 36, 37, 38, 39 Consensus was achieved on scores given to the 8 articles.
For both cross-sectional and intervention studies, 2 independent reviewers (FGP and PALR) performed quality assessments of the included studies, and disagreements were resolved through a consensus meeting or a rating by a third assessor (VMSH).
3. Results
The results for cross-sectional and longitudinal studies are presented separately. Table 1 (cross-sectional studies, n = 15) and Table 2 (intervention studies, n = 8) summarize the essential parameters of the selected studies.
Table 1.
Studies (n = 15) examining the acute effects of HIIT on physiological, metabolic, neuromuscular, and biomechanics measurements in recreationally trained endurance runners (cross-sectional studies).
| Study | Subject description | Study design | Exercise protocol | Outcome measure | Result |
|---|---|---|---|---|---|
| Latorre-Román et al. (2014)41 |
n = 16 M 29.6 ± 7.0 years BMI 23 ± 2 kg/m2 VO2max 56 ± 3 mL/kg/min - Nonelite - ≥6 years experience |
Unilateral crossover All participants performed the running protocol - A field-based study (on a track) |
4 × 3 × 400 m 12 runs of 400 m, grouped into 4 sets of 3 runs, with 1 min passive recovery between runs and 3 min between sets |
Physiological response: - BLa and HR Neuromuscular response: - CMJ and HS Athletic performance: - Running pace |
- CMJ and HS performances are equal despite high level of exhaustion - CMJ performance (resting vs. 1st set): postactivation potentiation |
| Tanner et al. (2014)40 |
n = 10 M 39.3 ± 6.0 years 76.6 ± 8.0 kg VO2max 59 ± 6 mL/kg/min - Recreational - 4–8 session/week |
Repeated measures All participants completed 5 trials in random order - Laboratory conditions |
- HIIT: 6 runs of 3.5 min at 90%VO2max, with 2 min of recovery at 30%VO2max - CR: 30 min at LT - Body weight–only circuit session |
Physiological response: - HR and hormone response (cortisol and testosterone) Athletic performance: - Running speed - %VO2max |
- ↑ cortisol concentration after the HIIT, compared with others - ↑ testosterone postexercise in both running-based exercise trials (over 50% higher than pre-exercise) |
| García-Pinillos et al. (2016)47 |
n = 18 (16 M, 2 F) 30.9 ± 11.0 years BMI 22 ± 2 kg/m2 vVO2max 17 ± 1 km/h - Recreationally trained - 4–6 session/week |
Repeated measures All participants completed 2 trials in random order - A field-based study (on a track) |
- HIIT: 10 × 400 m, 90 s recovery between runs - HIIT: 40 × 100 m, 30 s recovery between runs - A passive recovery between runs - Both protocols were carried out > vVO2max |
Physiological response: - BLa and HR Neuromuscular response: - Postural control, jumping test, SSC Athletic performance: - Running pace |
- Despite equal training volumes (4 km), 40 × 100 m enabled runners to train at a higher pace (+3.13 km/h) - 40 × 100 m equal vertical jump ability, postural control or SSC - 10 × 400 m: ↓ postural control and caused ↑ vertical jumping tests - Equal HR and BLa response |
| Hernández-Torres et al. (2009)43 |
n = 15 M 22.8 ± 5.0 years BMI 20 ± 2 kg/m2 VO2max 77 ± 3 mL/kg/min - 5–6 session/week - >1 year training |
Repeated measures All participants completed 2 trials in random order: CR vs. HIIT - Laboratory conditions |
2 single exercise sessions of equal duration (90 min) and distance (14 km) - CR: ~45%VO2max - HIIT: 22 reps of ~40%VO2max for 3 min and ~75%VO2max for 1 min |
Physiological response: - VO2 and CO2 - BLa and HR - Blood lipids Metabolic response: - EE and RER |
- HIIT ↑ higher level of intensity than CR (%HRmax = +13.8%; %VO2max = +14.83%; RER = 5.83%), and ↑ EE - Different effects on the lipids response: HIIT: ↑ blood TC and HDL-C; CR: ↑blood TC and LDL-C - Main difference CR vs. HIIT: energetic metabolic pathway activates |
| Seiler and Hetlelid (2005)22 |
n = 9 M 30.0 ± 4.0 years 72 ± 5 kg 181 ± 6 cm VO2max 72 ± 5 mL/kg/min - Trained athletes |
Repeated measures All participants completed 3 treadmill HIITs in random order - Laboratory conditions |
6 × 4 min work bouts with either 1, 2, or 4 min recovery periods were performed in each session - Self-paced: the highest possible average running speed for the work intervals |
Physiological response: - BLa and HR - Gas exchange Athletic performance: - Running velocity |
- Running velocity: ↑ recovery time (1–2 min) resulted in a ↑ 2% average pace; resting 4 min = work intensity - VO2: 3–6 min bouts are performed at 90%–100%VO2max; no differences between protocols were found - BLa: 4 mmol/L after 1st run and 6–7 mmol/L at the end |
| Kaikkonen et al. (2012)21 |
n = 13 M 35.0 ± 5.0 years 76.6 ± 5.6 kg VO2max 54 ± 3 mL/kg/min - Recreational - 4–5 session/week |
Repeated measures All participants completed 3 treadmill HIITs in random order - Laboratory conditions |
3 HIITs for equal distance (3 km) - HIIT1:2 × 6 × 250 m/rec 30 s/5 min at 85%vmax - HIIT2: 2 × 3 × 500 m/rec 1 min/5 min at 85%vmax - HIIT3: 2 × 6 × 250 m/rec 30 s/5 min at 105%vmax |
Physiological response: - VO2, CO2, and EPOC - BLa, HR, and HRV Athletic performance: - Running velocity |
- HIIT3 caused ↑ HR, EPOC, VO2max, and BLa |
| García-Pinillos et al. (2015)42 |
n = 30 M 38.2 ± 8.0 years BMI 22 ± 3 kg/m2 VO2max 58 ± 4 mL/kg/min - Recreational - 5–8 session/week |
Unilateral crossover All participants performed the HIIT - A field-based study (on a track) |
4 × 3 × 400 m 12 runs of 400 m, grouped into 4 sets of 3 runs, with 1 min passive recovery between runs, and 3 min between sets |
Physiological response: - BLa, HR Neuromuscular response: - CMJ and HS Athletic performance: - Running pace |
- High exhaustion level (RPE = 18; HRpeak = 182 bpm; HRrec = 155 bpm; and BLa = 14 mmol/L) - Despite that, in trained subjects equal strength and power levels and work capacity |
| Collins et al. (2000)45 |
n = 7 M 25.4 ± 4.0 years 68.8 ± 7.4 kg 180 ± 7 cm VO2max 72 ± 3 mL/kg/min - >1 year of training - >40 km per week |
Repeated measures All participants completed 3 treadmill HIITs in random order - Laboratory conditions |
3 HIIT sessions with running economy tests at 3.33 and 4.47 m/s - 10 × 400 m, 1 min rec - 10 × 400 m, 2 min rec - 10 × 400 m, 3 min rec - Protocols were carried out at vVO2max |
Physiological response: - VO2, and RER - RE (based on VO2) Kinematic data: - 2D analysis Athletic performance: - Running pace |
- After HIIT sessions at 100%VO2max the VO2 ↑ independent of the recovery condition - ↓ RE after HIIT - Irrespective of the duration of recovery, running kinematics equal |
| Vuorimaa et al. (2000)23 |
n = 10 M 22 ± 3 years 66.7 ± 7.0 kg 178 ± 5 cm VO2max 72 ± 3 mL/kg/min - Trained runners - National level |
Repeated measures All participants completed 2 treadmill HIITs in random order - Laboratory conditions |
- HIIT1: 14 × 60 s runs with 60 s rest at vVO2max - HIIT2: 7 × 120 s runs with 120 s rest at vVO2max |
Physiological parameters: - VO2, VO2max, AOD - HR and BLa Muscular performance parameters: - CMJ - Stride length |
- Despite high levels of fatigue, runners equal in CMJ and stride length - Both protocols showed high aerobic energy releases (70% and 80%, respectively) - Small AOD during both HIITs - VO2peak, relative aerobic energy release and BLa ↑ when the duration of running bouts was doubled |
| Millet et al. (2003)46 |
n = 7 M 21.0 ± 3.0 years 64.7 ± 6.0 kg VO2max 72 ± 3 mL/kg/min - Endurance athletes - 40–60 km/week |
Repeated measures All participants completed 2 HIITs in random order |
2 HIIT sessions consisting of 3 × n intervals (n × 30 s = Tlim) - HIIT100%: 30 s work intervals at 100%vVO2max with 30 s rec at 50%vVO2max - HIIT105%: identical, but work intervals at 105%vVO2max |
Physiological parameters: - VO2, VO2max, and HR Performance variables: - Time (s) ≥ 90%vVO2max - Time (s) ≥ 90%HRmax |
- VO2peak and running pace ↓ HIIT100% than in HIIT105% - HRpeak and RPE ↓ in HIIT100% than in HIIT105% - Time > 90%VO2max ↑ HIIT105% than in HIIT100%; time spent > 90%HRmax ↑ HIIT105% than in HIIT100% |
| Wallner et al. (2014)25 |
n = 8 M 24.5 ± 3.0 years BMI 22 ± 1 kg/m2 VO2max 55 ± 3 mL/kg/min - Trained male runners |
Repeated measures All participants completed 3 HIITs in random order - Laboratory conditions |
3 HIITs were performed at vVO2max (10 s work, 20 s passive rec, during 30 min) - at 50% VLTP - at 55% VLTP - at 60% VLTP |
Physiological parameters: - VO2 and VO2max - HR and BLa Performance variables: - VLTP |
- Short HIITs with passive rest phases gave an overall aerobic metabolic profile similar to CR - Mean VO2 ↑ in ascending order of intensity. - BLa equals level at the end of warm-up |
| Demarie et al. (2000)44 |
n = 15 (3 F, 12 M) ~45 ± 7 years F: 51 ± 3 kg M: 72 ± 6 kg - Subelite - VO2max 56 ± 4 mL/kg/min |
Repeated measures All participants completed 3 sessions - A field-based study (on a track) |
- CR: up to exhaustion at 90%–95%vVO2max - HIIT with a 2:1 work–rest ratio. Exercise periods at 90%–95%vVO2max during 50%Tlim, whereas rec periods at 50%vVO2max. during 50%Tlim |
Physiological parameters: - Gas exchange - HR and BLa Performance variables: - Time at vVO2max - Tlim |
- PeakVO2 ↑ during HIIT - ↑ time running > 90%vVO2max during HIIT - HIIT resulted better than CR to stimulate aerobic metabolism with ↑Tlim, longer time at vVO2max and obtaining ↑ VO2peak with lower BLa |
| Billat et al. (2001)24 |
n = 7 M 51 ± 6 years 71 ± 4 kg 175 ± 5 cm VO2max 52 ± 6 mL/kg/min - Trained male athletes - 50–70 km/week |
Repeated measures All participants completed 3 HIITs in random order - A field-based study (on a track) |
Runs until exhaustion: - HIIT1: 15 s runs alternating between 90% and 80% vVO2max - HIIT2: 15 s runs alternating between 100% and 70% vVO2max - HIIT3: 15 s runs alternating between 110% and 60%vVO2max |
Physiological parameters: - Gas exchange (VO2peak and VO2max) - HR and BLa Performance variables: - Time at vVO2max - Tlim |
- In all HIITs, runners reached HRpeak and VO2peak - HIIT3 ↑ BLa, ↓ distance at vVO2max, and ↓ total distance - HIIT1 and HIIT2 ↑ time at VO2max - HIIT2 ↑ time HRmax, was performed at ↑ velocity, and equal to or ↓ BLa |
| Seiler and Sjursen (2004)26 |
n = 12 (9 M, 3 F) 28 ± 5 years 68 ± 10 kg 176 ± 8 cm VO2max 65 ± 6 mL/kg/min - Trained male - >4 years training (>3 session/week) |
Repeated measures All participants completed 4 HIITs sessions in random order - Laboratory conditions |
The work–rest ratio was 1:1, and the total work was 24 min for each session - 24 × 1 min - 12 × 2 min - 6 × 4 min - 4 × 6 min - Self-selected running pace (as fast as possible) |
Physiological measurements: - Gas exchange data - HR and BLa Perceived exertion: - RPE Performance measurements: - Running velocity |
- Velocity ↓ increasing in duration - 24 × 1 obtained the ↓ VO2peak and the ↑ VO2 during recovery; no differences between the others - HR and BLa equal across HIITs (92%–95%HRmax and 4.5 mmol/L) - RPE was equal (averaged 16–17) - Physiological response to short HIIT is different to HIITs lasting 2–6 min |
| O'Brien et al. (2008)20 |
n = 17 (14 M, 3 F) 22 ± 4 years 74 ± 11 kg VO2max 57 ± 9 mL/kg/min - Moderately trained runners |
Repeated measures All participants completed 3 HIITs in a balanced random order - Laboratory conditions |
- HIIT1: 10 × 1 min at vVO2max (1:1, resting at 50% vVO2max) - HIIT2: 5 × 2 min at vVO2max (1:1, resting at 50% vVO2max) - CR: 20 min at 75% vVO2max |
Physiological measurements: - VO2max, vVO2max, and RER Performance measurements: - Time above vVO2max |
- HIIT1 and HIIT2 resulted in ↑ VO2 than CR with no differences between them - Time > 90%VO2max was ↑ in HIIT1; no participant exceeded 90%VO2max in CR |
Notes: ↑ to increase or to obtain a higher value; ↓ to impair or to obtain a lower value; ~ approximately.
Abbreviations: 2D = two dimensional; AOD = accumulated oxygen deficit; BLa = blood lactate accumulation; BMI = body mass index; bpm = beats per minute; CMJ = countermovement jump; CR = continuous run; EE = energy expenditure; EPOC = postexercise oxygen consumption; F = female; HDL-C = high-density lipoprotein cholesterol; HIIT = high-intensity intermittent training; HR = heart rate; HRmax = maximum heart rate; HRpeak = peak heart rate; HRrec = heart rate recovery; HRV = heart rate variability; HS = handgrip strength test; LT = lactate trhreshold; LDL-C = low-density lipoprotein cholesterol; M = male; RE = running economy; rec = recovery; rep = repetition; RER = respiratory exchange ratio; RPE = rate of perceived exertion; SSC = stretch-shortening cycle; Tlim = time to exhaustion sustained at VO2max; TC = total cholesterol; vmax = maximal velocity of the graded maximal test; VLTP = velocity associated to lactate turn points; VO2 = oxygen consumption; VO2max = maximal oxygen uptake; VO2peak = peak oxygen uptake; vVO2max = velocity associated to VO2max.
Table 2.
Studies (n = 8) examining the impact of HIIT-based running programs on physiological, metabolic, neuromuscular, and biomechanics measurements in recreationally trained endurance runners (intervention studies).
| Study | Subject description | Training program (treatment and control groups) | Outcome measure | Result |
|---|---|---|---|---|
| Bangsbo et al. (2009)33 |
n = 17 M 34 ± 2 years 74 ± 2 kg 182 ± 2 cm VO2max 63 ± 2 mL/kg/min - Moderately trained male endurance athletes (running 4–5 day/week) |
- Intervention period: for a 6- to 9-week period - Groups: speed endurance group (SIT, n = 12) and control group (CG, n = 5) - Training: - SET: 25% ↓ in the weekly training but including SIT (2–3 time/week, 8–12 running bouts repeated 30 s at 95% of maximal speed with 3 min passive recovery), HIIT (4 × 4 min running at ~85% of HRmax separated by 2 min of passive recovery), and 1–2 sessions of CR (75%–85% of HRmax) - CG: continued the endurance training (~55 km/week) |
Physiological measurements: - VO2max and RER - HR and blood samples (BLa and K+) - Muscle analysis: ion transport proteins and enzymes Performance measurements: - Incremental test - Repeated sprint test - 3 and 10 km |
- The inclusion of SIT and HIIT with ↓ in training volume not only resulted in ↑ short-term work capacity but also ↑ 3 and 10 km performance in endurance runners - The improvements were associated with an ~70% higher expression of Na+-K+ pump and lower plasma K+ concentrations during exhaustive running |
| Denadai et al. (2006)36 |
n = 17 M 37 ± 4 years 63 ± 4 kg 166 ± 5 cm VO2max 59 ± 6 mL/kg/min - Trained endurance runners training a mean weekly volume of ~80 km divided into 6 training sessions |
- Intervention period: for 4 weeks - Groups: 95% or 100%vVO2max groups - Training: 2 HIIT sessions per week (at 95%–100%vVO2max), 1 session at VLTP (2 × 20 min with 5 min of rest at 60% vVO2max) and 3 CR (45–60 min at 60%–70%vVO2max) - 95%vVO2max: 4 intervals (60%Tlim at 95%vVO2max; recovery = 30%Tlim at 50% vVO2max) - 100%vVO2max group: 5 intervals (identical to previous, but according to 100%vVO2max) |
Physiological measurements: - VO2max and RER - HR and BLa Performance measurements: - Incremental test - Submaximal test - 1.5 and 5 km time trials |
- vVO2max, RE, and performance (1.5 and 5 km) can be ↑ using a 4-week training program consisting of 2 HIIT sessions at 100%vVO2max and 4 submaximal run sessions per week (95%vVO2max) - CG did not present significant improvement on the vVO2max, RE, and 1.5 km running performance |
| Esfarjani and Laursen (2007)37 |
n = 17 M 19 ± 2 years 73 ± 3 kg 172 ± 4 cm VO2max 51 ± 2 mL/kg/min - Moderately trained male runners with 2–3 years of run training |
- Intervention period: for 10 weeks - Groups: 2 intervention groups (HIIT-based, EG1 and EG2) and 1 control group (CR-based, CG) - Training: - HIIT groups (EG1, and EG2): 2 HIIT sessions and 2 CR (60 min at 75%vVO2max) each week EG1: 5–8 intervals at vVO2max for a duration equal to 60%Tlim, with a 1:1 work–rest ratio EG2: 7–12 × 30 s bouts at 130%vVO2max with 4.5 min of recovery - CG: 4 × 60 min CR (75%vVO2max) per week |
Physiological measurements: - VO2max and RER - HR and BLa Performance measurements: - Incremental test - 3000 m time trial |
- HIIT-based running plan ↑ 3 km running performance time (−7.3%), concomitant with ↑VO2max (+9.1%), vVO2max (+6.4%), Tlim (+35%), and VLT (+11.7%). - SIT improved 3 km performance (−3.4%) with simultaneous ↑ in VO2max (+6.2%), vVO2max (+7.8%), and Tlim (+32%), but not VLT (+4.7%) - ↑ performance and physiological variables tended to be greater using more prolonged HIIT at vVO2max when compared with SIT |
| Gliemann et al. (2015)35 |
n = 160 HIIT group: n = 132 (58 M, 74 F) 49 ± 1 years 73.7 ± 1.1 kg VO2max 52 ± 1 mL/kg/min CG: n = 28 (15 M, 13 F) 46 ± 2 years 73.7 ± 2.5 kg VO2max 52 ± 4 mL/kg/min - Recreational >2-year training (>3 session/week) |
- Intervention period: for 8 weeks - Groups: CG and HIIT group (replacing 2 of 3 weekly sessions with 10–20–30 training) - Training - CG: same plan (CR-based, HR between 75% and 85% of HRmax) - HIIT group: 1 × CR + 2 × 10–20–30 training per week. (10–20–30: 3–4 × 5 min running periods interspersed by 2 min of rest; each 5 min running period consisted of 5 consecutive 1 min intervals divided into 30, 20, and 10 s at an intensity corresponding to ∼30%, ∼60%, and ∼90%–100% of maximal running speed |
Physiological measurements: - VO2max and RER - Blood pressure - HR and BLa - Blood variables: glucose, cholesterol, insulin, cortisol - Muscle morphology Performance measurements: - Test to exhaustion - 5000 m time trial |
- 8 weeks of 10–20–30 training was effective in improving VO2max and 5 km performance (–38 s) and lowering blood pressure (∼5 mmHg) - Muscle fiber area, fiber type, and capillarization were not changed after 10–20–30 training |
| Gunnarsson and Bangsbo (2012)34 |
n = 18 (12 M, 6 F) 34 ± 2 years 75 ± 4 kg 179 ± 2 cm VO2max 52 ± 1 mL/kg/min - Moderately trained runners (3–4 weekly running sessions, ~30 km/week) |
- Intervention period: for 7 weeks - Groups: CG and HIIT (10–20–30 training) - Training: 10–20–30 training concept (identical to the previous) - CG: continued with their regular endurance training (CR-based) - HIIT: all regular training sessions were replaced with 3 weekly 10–20–30 training sessions. In the first 4 weeks, 10–20–30 conducted 3 × 5 min intervals and, in the remaining 3 weeks, 4 × 5 min intervals per session |
Physiological measurements: - VO2max and RER - Blood pressure, HR, BLa - Blood variables: glucose, cholesterol, insulin, cortisol - Muscle morphology Performance measurements: - Incremental test - 1.5 and 5 km trials |
- After 7 weeks of 10–20–30 training, with a ~50% ↓ in training volume, VO2max ↑ by 4% and performance in a 1.5 km and a 5 km run ↑ by 21 s and 48 s, respectively. - Fasting blood and plasma values = CG, while HIIT group ↓ values at post-test in cholesterol and LDL - Resting HR remained unchanged in both groups, but blood pressure was reduced in the HIIT group after intervention - Muscle morphology equal in both groups; same occurred in BLa |
| Smith et al. (2003)38 |
n = 27 M 25 ± 1 years 72 ± 2 kg 179 ± 2 cm VO2max 61 ± 1 mL/kg/min - Well-trained male endurance runners |
- Intervention period: for 4 weeks - Groups: CG (n = 9), HIIT1 (60%Tmax, n = 9) and HIIT2 (70%Tmax, n = 9) - Training: HIIT groups completed 2 HIIT session/week at vVO2max and their respective Tmax duration; work–rest ratio of 1:2 was used during HIIT; HIIT groups performed 1 CR (30 min at 60%vVO2max) per week - HIIT1: 6 intervals per HIIT session - HIIT2: 5 intervals per HIIT session - CG: Maintained current training level (low intensity, long duration training) |
Physiological measurements: - VO2max, RER, VT, and RE - HR and BLa Subjective ratings: - sleep, fatigue, stress, and muscle soreness Performance measurements: - Treadmill test - 3 and 5 km |
- HIIT1 showed a 17 s improvement in 3 km, compared to a 7 s improvement of HIIT2; this change in HIIT1 was related to changes in VO2max and RE, and these runners improved in VT (6.8%) and Tmax (50 s) compared to 1.7% and 16 s improvements in HIIT2 |
| Vezzoli et al. (2014)32 |
n = 20 M CR group: 50 ± 6 years 69 ± 10 kg 174 ± 7 cm HIIT group: 45 ± 8 years 72 ± 9 kg 176 ± 6 cm - National level, 45 km/week |
- Intervention period: For 8 weeks - Groups: 2 groups, 3 times nonconsecutively per week: CR-based (n = 10) or HIIT-based (n = 10) - Training: 3 different types of training sessions were scheduled, with the total distance covered in each session being controlled: - CR: (1) 64.5 min at 70%GET, (2) 58.5 min at 80%GET, and (3) 54 min at 90%GET - HIIT: (1) 18 × (1 min at 120%GET and 2 min at 65%GET), (2) 18 × (1 min at 130% GET and 2 min at 65%GET), and (3) 18 × (1 min at 140%GET and 2 min at 65%GET) |
Physiological measurements: - VO2max, RER, and VT - HR and BLa - Blood pressure Indexes of oxidative stress in blood and urine samples |
- CR and HIIT induced similar beneficial effects in master runners, ↓ resting levels of oxidative stress biomarkers - Resting lipid peroxidation levels were ↓ after training both in CR and HIIT - No changes in PC resting values in both CR and HIIT - The data showed ↓ 25% in urinary 8-OH-dG excretion in both CR and HIIT groups - The defences against oxidative damage were lowered only in CR, not in HIIT |
| Zatoń and Michalik (2015)39 |
n = 17 (6 F, 11 M) CG: 34 ± 15 years 70 ± 10 kg 174 ± 7 cm EG: 34 ± 9 years 76 ± 7 kg 176 ± 12 cm - Amateur long-distance runners >1 year of experience |
- Intervention period: for 8 weeks - Groups: 2 groups completing 8 weeks of CR-based (CG, n = 9) or HIIT-based (EG, n = 8) - Training: CG performed 3–4 CR session/week; EG performed 2 HIIT and 1 CR session/week - CG: continued to train as normal - EG: HIIT, 4 × 20–30 s repetitions of maximal intensity running (covering a distance of 90–200 m); rest between each repetition was based on a 1:2 work–rest ratio and ranged from 40 s to 60 s; number of sets performed ranged from 2 to 4 |
Physiological measurements: - VO2max - HR - Blood variables during graded exercise test: BLa, pH, partial pressure of O2 and CO2 (pO2 and pCO2) Performance measurements: - Cooper test |
- HIIT develops physiological function similar to a CR-based training protocol in amateur long-distance runners - HIIT training ↑ VO2max, minute ventilation, tidal volume, distance covered in the Cooper test, and ↑ postexercise recovery as well as RE - CG ↑ VO2max and tidal volume with a larger ↓ in minute ventilation compared with EG - Relative VO2max and relative HR ↓ in both groups, which suggests improved RE in both groups |
Notes: ↑ to increase or to obtain a higher value; ↓ to impair or to obtain a lower value; ~ approximately.
Abbreviations: 8-OH-dG = 8-hydroxy-2-deoxy-guanosine; BLa = blood lactate accumulation; CG= control group; CR = continuous run; EG = experimental group; F = female; GET = gas exchange threshold; HIIT = high-intensity intermittent training; HR = heart rate; HRmax = maximum heart rate; M = male; PC = phosphocreatine; RE = running economy; RER = respiratory exchange ratio;. SET = speed endurance training; SIT = sprint interval training; Tlim = time to exhaustion sustained at VO2max; Tmax = time for which vVO2max can be maintained; VLTP = velocity associated to lactate turn points; VO2max = maximal oxygen uptake; vVO2max = velocity associated to VO2max; VT = ventilatory threshold; VLT = velocity associated to lactate threshold.
3.1. Cross-sectional studies
Results from the Downs and Black scale are shown in Table 3. Scores for the Downs and Black scale ranged from 9 to 12 of a possible 14. Of particular note was that no study included a sample size representative of the entire population (Item 12) or considered confounding factors (Item 25).
Table 3.
Modified Downs and Black scale.39
| Study | Item 1 | Item 2 | Item 3 | Item 6 | Item 7 | Item 10 | Item 12 | Item 15 | Item 16 | Item 18 | Item 20 | Item 22 | Item 23 | Item 25 | Total score (out of 14) |
|---|---|---|---|---|---|---|---|---|---|---|---|---|---|---|---|
| Latorre-Román et al. (2014)41 | 1 | 1 | 1 | 1 | 1 | 1 | 0 | 1 | 1 | 1 | 1 | 1 | 0 | 0 | 11 |
| Tanner et al. (2014)40 | 1 | 1 | 1 | 1 | 1 | 0 | 0 | U | 1 | 1 | 1 | 1 | 1 | 0 | 10 |
| García-Pinillos et al. (2016)47 | 1 | 1 | 1 | 1 | 1 | 1 | 0 | 1 | 1 | 1 | 1 | 1 | 1 | 0 | 12 |
| Hernández-Torres et al. (2009)43 | 1 | 1 | 1 | 1 | 1 | 1 | 0 | U | 1 | 1 | 1 | 1 | 1 | 0 | 11 |
| Seiler and Hetlelid (2005)22 | 1 | 1 | 1 | 1 | 1 | 1 | 0 | 1 | 1 | 1 | 1 | 1 | 1 | 0 | 12 |
| Kaikkonen et al. (2012)21 | 1 | 1 | 1 | 1 | 1 | 0 | 0 | U | 1 | 1 | 1 | 1 | 1 | 0 | 10 |
| García-Pinillos et al. (2015)42 | 1 | 1 | 1 | 1 | 1 | 1 | 0 | 1 | 1 | 1 | 1 | 1 | 0 | 0 | 11 |
| Collins et al. (2000)45 | 1 | 1 | 1 | 1 | 1 | 0 | 0 | U | 1 | 1 | 1 | 1 | 1 | 0 | 10 |
| Vuorimaa et al. (2000)23 | 1 | 1 | 1 | 1 | 1 | 0 | 0 | U | 1 | 1 | 1 | 1 | 1 | 0 | 10 |
| Millet et al. (2003)46 | 1 | 1 | 1 | 1 | 1 | 0 | 0 | U | 1 | 1 | 1 | 1 | 1 | 0 | 10 |
| Wallner et al. (2014)25 | 1 | 1 | 1 | 1 | 1 | 1 | 0 | U | 1 | 1 | 1 | 1 | 1 | 0 | 11 |
| Demarie et al. (2000)44 | 1 | 1 | 1 | 1 | 1 | 0 | 0 | U | 1 | 1 | 1 | 1 | 0 | 0 | 9 |
| Billat et al. (2001)24 | 1 | 1 | 1 | 1 | 0 | 0 | 0 | U | 1 | 1 | 1 | 1 | 1 | 0 | 9 |
| Seiler and Sjursen (2004)26 | 1 | 1 | 1 | 1 | 1 | 0 | 0 | 1 | 1 | 1 | 1 | 1 | 1 | 0 | 11 |
| O'Brien et al. (2008)20 | 1 | 1 | 1 | 1 | 1 | 0 | 0 | U | 1 | 1 | 1 | 1 | 1 | 0 | 10 |
Notes: 0 = no; 1 = yes; U = unable to determine. Item 1: clear aim/hypothesis; Item 2: outcome measures clearly described; Item 3: patient characteristics clearly described; Item 6: main findings clearly described; Item 7: measures of random variability provided; Item 10: actual probability values reported; Item 12: participants prepared to participate representative of entire population; Item 15: blinding of outcome measures; Item 16: analysis completed was planned; Item 18: appropriate statistics; Item 20: valid and reliable outcome measures; Item 22: participants recruited over same period; Item 23: randomised; Item 25: adjustment made for confounding variables.
As for the cross-sectional studies selected in Table 1 (n = 15), some focused on describing the response to a specific HIIT running protocol,40, 41, 42 whereas others made a comparison between the responses to HIIT and a continuous run (CR),20, 43, 44 or between different HIIT running protocols.21, 22, 23, 24, 25, 26, 45, 46, 47 In the study by García-Pinillos et al.,47 participants performed typical running workouts, varying in intensity (in terms of average running pace), duration of work, and relief intervals but with similar density and total distance (4 km). Similarly, Kaikkonen et al.21 utilized running protocols with the same volume (3 km) but different intensity (85%–105% velocity associated to VO2max (vVO2max)) and different durations of work and rest periods. On the other hand, Seiler and Hetlelid22 and Collins et al.45 focused on the manipulation of resting time but maintained work intervals, with workouts performed at a self-selected pace, whereas Millet et al.,46 Wallner et al.,25 and Billat et al.24 maintained constant work and rest intervals but modified the intensity (30–30 s during Tlim, 10–20 s during 30 min, and 15–15 s up to exhaustion, respectively). Finally, Vuorimaa et al.23 and Seiler and Sjursen26 compared HIIT protocols with identical volume and work–rest ratios but differing work and rest intervals (at a vVO2max and self-selected pace, respectively).
Most studies used heart rate (HR) and blood lactate accumulation (BLa) to control the exhaustion level reached and to monitor the physiological and metabolic response to HIITs, whereas some of them also included hormone response,40 energy expenditure,43 lipids response,43 gas exchange analysis,20, 21, 22, 23, 24, 25, 26, 43, 44, 45, 46 and running economy (RE).45 Biomechanical variables were controlled in some of the aforementioned works,23, 45 whereas the impact of HIIT protocols at a neuromuscular level was assessed in 4 studies.23, 41, 42, 47
3.2. Intervention studies
PEDro scores for the 8 selected articles ranged from 6 to 7 out of a maximum of 11 (Table 4). One article48 was excluded because of the score obtained. Concealment of allocation is not entirely relevant in studies of this nature; given the nature of endurance training and the sample selection methods used, it is difficult for researchers to keep themselves and participants unaware of the treatment and groups involved. Blinding of subjects and therapists (i.e., trainers) was also not applicable in this case.
Table 4.
Physiotherapy evidence database scale (PEDro).31
| Study | Item 1 | Item 2 | Item 3 | Item 4 | Item 5 | Item 6 | Item 7 | Item 8 | Item 9 | Item 10 | Item 11 | Total score (out of 11) |
|---|---|---|---|---|---|---|---|---|---|---|---|---|
| Bangsbo et al. (2009)33 | 1 | 1 | 0 | 1 | 0 | 0 | 0 | 1 | 1 | 1 | 1 | 7 |
| Denadai et al. (2006)36 | 1 | 1 | 0 | 1 | 0 | 0 | 0 | 1 | 1 | 1 | 1 | 7 |
| Esfarjani and Laursen (2007)37 | 1 | 0 | 0 | 1 | 0 | 0 | 0 | 1 | 1 | 1 | 1 | 6 |
| Gliemann et al. (2015)35 | 1 | 0 | 0 | 1 | 0 | 0 | 0 | 1 | 1 | 1 | 1 | 6 |
| Gunnarsson and Bangsbo (2012)34 | 1 | 0 | 0 | 1 | 0 | 0 | 0 | 1 | 1 | 1 | 1 | 6 |
| Smith et al. (2003)38 | 1 | 1 | 0 | 1 | 0 | 0 | 0 | 1 | 1 | 1 | 1 | 7 |
| Vezzoli et al. (2014)32 | 1 | 0 | 0 | 1 | 0 | 0 | 0 | 1 | 1 | 1 | 1 | 6 |
| Zatoń and Michalik (2015)39 | 0 | 1 | 0 | 1 | 0 | 0 | 0 | 1 | 1 | 1 | 1 | 6 |
| Laffite et al. (2003)48* | 0 | 0 | 0 | 0 | 0 | 0 | 0 | 1 | 1 | 1 | 1 | 4 |
Notes: 0 = item was not satisfied; 1 = item was satisfied. Item 1: eligibility criteria were specified; Item 2: subjects were randomly allocated to groups; Item 3: allocation was concealed; Item 4: the groups were similar at baseline regarding the most important prognostic indicators; Item 5: there was blinding of all subjects; Item 6: there was blinding of all therapists who administered the therapy; Item 7: there was blinding of all assessors who measured at least one key outcome; Item 8: measurements of at least one key outcome were obtained from more than 85% of the subjects initially allocated to groups; Item 9: all subjects for whom outcome measuments were available received the treatment or control condition as allocated , or where this was not the case, data for at least one key outcome were analyzed by “intention to treat”; Item 10: the results of between groups statistical comparisons are reported for at least one key outcome; Item 11: the study prevides both point measurements and measurements of variability for at least one key outcome.
This article was excluded because of the score obtained.
From the 8 articles included in Table 2, 7 used a high-volume, low-moderate intensity continuous training program for the control group.32, 33, 34, 35, 37, 38, 39 Likewise, 3 studies included 2 HIIT-based intervention groups,36, 37, 38 with one of them36 not including a control group. All these studies lasted a minimum of 4 weeks, with 10 weeks being the longest intervention period,37 and included up to 2,35, 36, 37, 38 3,32, 34, 39 or 433 HIIT sessions per week. Most of these studies combined HIIT sessionswith CR sessions for intervention groups, with only 2 studies exclusively performing HIIT32, 34 (In both studies this included 3 sessions per week). To check the effectiveness of the training programs, all these studies included gas exchange analysis during an incremental running test. Likewise, HR and BLa were used to control possible changes in the acute response to running protocols. Moreover, among the outcome measures, 1 study included some indexes of oxidative stress,32 whereas others included muscle proteins and enzymes33 or parameters related to muscle morphology.35 Blood analysis, in addition to BLa, was performed in 4 of these studies,33, 34, 35, 39 whereas all studies assessed the athletic performance of participants.
4. Discussion
The purpose of this systematic review was to critically analyze the literature to determine how HIIT affects recreational endurance runners from a multidisciplinary perspective (physiological, neuromuscular, and biomechanical) in the short and long term. The main findings from the cross-sectional studies included in this review are (1) at a neuromuscular level, trained endurance runners are able to maintain an adequate muscular performance after a HIIT workout, whereas high-intensity CR impairs muscular performance; (2) at a physiological level, the main difference between CR and HIIT is the energetic metabolic pathway that is activated (there is a greater activation of anaerobic lactic metabolism during HIIT); and (3) at a biomechanical level, HIIT sessions including runs for 1–2 min and performed at intensity close to VO2max do not consistently perturb the running kinematics of trained male runners. On the other hand, the major outcomes from intervention studies included in this review are as follows: (1) HIIT-based training programs are effective in improving athletic performance in recreational endurance runners; (2) exercise bouts at an intensity close to or above the intensity corresponding to VO2max appear to be more effective in improving performance and VO2max compared with moderate-intensity exercise training; (3) HIIT-based running plans appear to be effective in improving RE in trained endurance runners; and (4) HIIT causes an increased oxidative capacity of a greater number of muscle fibers and a reduced plasma K+ concentration, which contributes to the maintenance of muscle function during intense exercise and delays the appearance of fatigue. However, caution should be exercised when interpreting these findings, owing to the heterogeneity that exists among study protocols. In the next section, acute responses to HIIT (including cross-sectional studies) and long-term adaptations to HIIT interventions (including HIIT-based training programs) are discussed separately.
4.1. Acute responses to HIIT-based running protocols
Many variables, at least 9, can be manipulated to prescribe different HIIT sessions, and, among them, the intensity and duration of work and relief intervals are the key influencing factors.3, 4, 5 Then the number of intervals and the number of series and between-series recovery durations and intensities determine the total work performed. From the analysis of cross-sectional studies included in this review, the authors state that the manipulation of each variable in isolation likely has a direct impact on metabolic, cardiopulmonary, and/or neuromuscular responses. When more than 1 variable is manipulated simultaneously, responses are more difficult to predict because the factors are inter-related, making it unclear which combination of work-interval duration and intensity, if any, is most effective in allowing an individual to spend prolonged time at vVO2max while “controlling” for the level of anaerobic engagement7 and/or neuromuscular load.8
4.1.1. Acute neuromuscular changes after HIIT-based running exercises
The available evidence about neuromuscular engagement after run-based HIIT is limited. In the current review, 4 of the revised manuscripts23, 41, 42, 47 examined the neuromuscular response to a HIIT workout in recreational endurance runners, and all of them did this through indirect measures related to muscular performance (i.e., jumping, balancing, and grip-strength testing). Whereas Latorre-Román et al.41 and García-Pinillos et al.42 examined the impact induced by a single HIIT protocol, García-Pinillos et al.47 and Vuorimaa et al.23 compared the changes induced by different HIIT workouts, but none of these studies made a comparison with a CR protocol. Despite differences in the running protocols, all were performed at a velocity close to vVO2max, accumulated longer work periods than 10 min at the aforementioned velocity, and, consequently, led to high levels of exhaustion in terms of BLa, rate of perceived exertion, and mean and peak HR.
In general, all these studies agree on the lack of impairment in muscular performance parameters for trained endurance runners performing a HIIT workout. Some of these studies41, 42, 47 even discussed the presence of the postactivation potentiation phenomenon, whereby there is a significant improvement in vertical jump performance after running. It is known that endurance training causes, on the one hand, a greater amount of phosphorylation of regulatory myosin light chains in slow fibers and, on the other hand, a greater resistance to fatigue, which allows for the prevalence of potentiation and may explain the postactivation potentiation presence in endurance athletes.49 Therefore, the ability to sustain adequate muscular performance and to tolerate fatigue during HIIT seems to be typical for endurance runners.
Nevertheless, none of these studies included a comparison with CR, so the effects of CR at a neuromuscular level remain unknown. Contradictory results can be found in recent literature; although some previous works have reported 8%–16% reductions in jumping test performance (drop jump and repeated jump tests) after a marathon50 and a negative influence of intensive aerobic running (6 km at velocity related to lactate threshold) on some muscle contractile characteristics (i.e., an impaired excitation–contraction coupling), a previous work by Vuorimaa et al.51 investigated acute changes in muscle activation and muscular power performance after 40 min of CR at an intensity of 80%vVO2max in elite long-distance runners and showed an enhanced jumping performance postexercise.
4.1.2. Acute effect of HIIT-based running protocols on physiological parameters
Compared with CR, there is no doubt that differences in the impact of HIIT-based runs exist at a physiological level.20, 40, 43, 44 A different hormone response, in terms of salivary cortisol and testosterone concentrations postexercise, was found after CR (30 min at lactate threshold intensity) and HIIT (6 × 3.5 min at 90%VO2max), with increased concentrations after HIIT compared with CR.40 O'Brien et al.20 found that despite total work durations of CR and HIIT protocols being similar (~20 min), HIITs with intervals decreasing from 100% to 50%vVO2max resulted in greater mean average VO2 than CR, with CR runners spending 1–7 min above 90%VO2max and no participant exceeding 90%VO2max. Similar results were found during runs up to exhaustion44 (both CR and HIIT, with work periods performed ~90%–95%vVO2max), with higher VO2max values reached during HIIT and longer times above 90%VO2max, so that HIIT was more effective than CR in stimulating aerobic metabolism, with a longer time to exhaustion, a longer time at vVO2max, and higher VO2max with lower BLa. Besides supporting these findings, Hernández-Torres et al.43 added that energy expenditure was higher during HIIT (based on higher VO2 values) and reported different effects on the lipids response; both HIIT and CR increased total cholesterol, where high-density lipoprotein cholesterol increased with HIIT and low-density lipoprotein cholesterol increased with CR. Taken together, the intermittent profile of HIIT workouts allows a high stimulation of aerobic metabolism (even greater than in CR) as well as a greater activation of anaerobic lactic metabolism. Thus, the main difference between CR and HIIT is the energetic metabolic pathway that is activated.
Different physiological responses to CR and HIIT might be expected, but what about between different HIIT protocols? Whereas some studies found differences in the physiological response to the compared protocols,20, 21, 22, 23, 24, 25, 26 others did not.45, 47 Differences in protocols make comparisons difficult. It seems clear that during short HIIT-based protocols with fixed durations of work and relief intervals (30–30 s;46 15–15 s;24 10–20 s25), an increased intensity in terms of running pace elicits greater VO2max, BLa, peak HR, and rate of perceived exertion and a longer time above 90%vVO2max. But what happens during longer intervals? Some studies have compared the response to different HIIT protocols. By using short HIITs (100 m runs at ~130%vVO2max), a study by García-Pinillos et al.47 reported a physiological impact similar in terms of BLa and HR response to that of a longer HIIT (based on 400 m runs at ~105% vVO2max). However, when doubling the duration of work and relief intervals (from 1–2 min) but maintaining running intensity (at vVO2max) and the work–rest ratio (1:1), the physiological demands changed significantly with increased aerobic energy release, BLa, and VO2max.20, 23 In a similar study performed at a self-selected pace, Seiler and a Sjursen26 concluded that a higher number of shorter runs increases VO2max during recovery and decreases it during exercise, but protocols with intervals lasting 2–6 min showed a similar VO2 kinetic. Additionally, duration and intensity of relief intervals during HIIT workouts are influencing factors. In Seiler and Hetlelid's study,22 longer work bouts (lasting 4 min) were undertaken, and changes in recovery periods (1, 2, or 4 min) induced a 2% increase in average work intensity with no differences in VO2. Likewise, RE impairment with changes in substrate utilization—an increased dependency on fat oxidation—has been reported after HIIT (based on 400 m runs) and independent of recovery time (1, 2, or 30 min45). Taken together, HIIT protocols involving short work periods (<1 min) and work–rest ratios approximately 1:1–1:2 and that are performed close to maximum intensities (with indications such as “complete the protocol as fast as you can”) enable athletes, compared with longer HIIT or CR protocols, to train at an increased running pace (widely above vVO2max) and to elicit similar, or even greater, mean average VO2.
4.1.3. Acute fatigue-induced changes in biomechanics of running during HIIT
The effect of exertion on running kinematics has been extensively studied.45, 52, 53, 54, 55, 56, 57, 58, 59 However, most of these studies were performed under laboratory conditions and with athletes performing prolonged treadmill runs53, 54, 60 or running-induced fatigue protocol on treadmills.55, 56, 61 The generalization of results from studies that analyze running on a treadmill may become controversial if treadmill and overground running biomechanics are eventually not proven to be equivalent.62, 63
The evidence about changes induced by HIIT running protocols is quite limited. From all the studies included in this review, only 2 studies23, 45 assessed the HIIT-induced changes to the biomechanics of running. Both agreed that HIIT sessions including runs for 1–2 min performed at intensity close to VO2max did not consistently perturb the running kinematics of trained male runners.
In turn, after CR protocols, some studies found fatigue-induced changes during running at kinematic level, for example, increased trunk inclination peak angle,59 decreased knee flexion angle at foot strike,54 increased step length with a corresponding decrease in cadence,53 and changes in foot strike pattern.57, 58 Thus, based on the biomechanical response to CR and HIIT protocols, and being especially cautious because of the wide variety of running protocols used, the authors suggest that CR causes greater impairments to running kinematics than HIIT protocols, including runs for 1–2 min and performed at intensity close to VO2max.
Cross-sectional studies have limitations because the outcomes from correlative analyses do not allow the identification of a cause-and-effect relationship. Accordingly, intervention studies have to be conducted to detect cause-and-effect relationships. The subsequent section will discuss intervention studies that examined the effects of HIIT-based running programs on parameters related to endurance performance (neuromuscular, physiological, and biomechanical parameters).
4.2. Long-term adaptations to HIIT-based running programmes
In addition to the elevated number of variables that can influence the acute effect of every single HIIT session (see earlier), determining the effectiveness of an intervention requires parameters such as duration (weeks or months), frequency (sessions per week), methodology (type of workouts), and periodization (progress of the training load) to be taken into consideration. Additionally, as we mentioned earlier, when coaches prescribe training programs, they essentially pursue 2 objectives: (1) to improve athletic performance and (2) to avoid injuries, so these elements will be covered in this section.
4.2.1. Changes in athletic performance after HIIT interventions
Despite differences in training programs conducted by these studies,32, 33, 34, 35, 36, 37, 38, 39 all agree that athletic performance improved after HIIT intervention. Esfarjani and Laursen37 underwent the longest intervention included in this review (10 weeks) by combining CR with HIIT (at 100%vVO2max, G1) or SIT (30 s runs at 130%vVO2max, G2) in 4 sessions per week; performance in a 3 km time trial increased by 7.3% and 3.4% (G1 and G2, respectively). After 9 weeks of combining low-moderate intensity CR with HIIT and SIT sessions in a total of 6 sessions per week, Bangsbo et al.33 found that performance in 3 km and 10 km time trials increased (3.3% and 3.1%, respectively). Even during shorter interventions,36, 38 the combination of habitual CR sessions with 2 HIIT sessions per week over 4 weeks has shown improvements in 1.5 km (2.0%), 3 km (1.1%–2.7%), and 5 km time trials (1.5%–2.3%). All these studies implemented traditional endurance training sessions with HIIT-based workouts, but other authors went further and prescribed running plans exclusively using HIITs. Gunnarsson and Bangsbo34 replaced the regular endurance-training program (high-volume and low-intensity) with a HIIT-based intervention (10–20–30 training concept) 3 times per week and reported 6% and 4% improvements in 1.5 km and 5 km time trials, respectively, after 7 weeks of intervention. Based on these results, the presence of at least 2 sessions of HIIT workouts in a running plan allows trained endurance runners to improve their athletic performance. It is also important to examine the duration of work intervals during HIIT. Some of these studies included SIT (all-out efforts lasting 20–30 s with long resting periods of 3–5 min),33, 37 others aerobic HIIT with long work intervals (2–4 min at intensity of ≤100%vVO2max),33, 36, 37, 38 and others32, 34, 35, 39 HIIT with short work intervals (lasting 20–60 s) at intensities >vVO2max. Based on these findings, the authors suggest that HIIT and SIT must be a part of running plans for endurance athletes, but training periodization should take the progressive overload principle into consideration. For example, during a traditional periodization (increasing intensities and decreasing volumes), HIIT should move from long runs to shorter and faster runs, whereas SIT should be progressively included from short sprints to 25–30 s all-out efforts.
Despite the suggested association between increased running speed and running injury,52, 64 none of these studies has directly measured or monitored injury risk factors during HIIT intervention. Only Smith et al.38 monitored subjective ratings of sleep, fatigue, stress, and muscle soreness, with no changes reported during the 4-week intervention. Therefore, it seems that consensus exists about the benefits of HIIT interventions for endurance performance, even though more longitudinal studies covering the effects of HIIT-based training programs on injury risk factors for endurance runners are needed. Moreover, why does endurance performance improve when running intensities during workouts are increased? To answer this question, long-term neuromuscular and physiological adaptations to HIIT interventions are examined next.
4.2.2. Changes in gas exchange measurements after HIIT-based running plans
Related to VO2max is the concept of RE, the energetic cost of running at a given speed.65 Most of these studies33, 35, 36, 38 considered RE to be an influencing factor in endurance performance and hypothesized that including repeated bouts of faster runs (HIIT) in their running plans would lead to improvements in RE for endurance-trained runners. However, the results reported by these studies are equivocal. Whereas Gliemann et al.35 found no change in RE after 8 weeks of combining HIIT (10–20–30 training concept, 2 sessions per week) and CR (1 session per week), other studies reported RE improvements after 436, 38 and 933 weeks of training programs that included HIIT sessions. When one looks at the training programs performed in those studies, the equivocal results obtained may depend on 2 factors: the weekly running distance and the intensity of the HIIT. As suggested by Denadai et al.,36 improvements in RE with HIIT may result from improved muscle oxidative capacity and associated changes in motor unit recruitment patterns. Ensuring a minimum weekly mileage is important in improving muscle oxidative capacity, and Gliemann et al.35 reduced it to approximately 15 km/week, although the studies reporting RE improvement reached greater weekly mileage. As for the intensity of the HIIT, the importance of neuromuscular characteristics (motor unit recruitment and contractile properties) in determining RE and performance has recently been pointed out by Nummela et al.,66 whereas Gliemann et al.35 based their running plan on a 10–20–30 training concept performed on average at 85%HRmax and under 100%vVO2max.34 The HIIT workouts included in the studies reported that RE improvements were seen at vVO2max or above. The findings of Denadai et al.36 support this rationale, with RE improving after the training program that included HIIT at 100%vVO2max but not after HIIT at 95%vVO2max. These data suggest that to improve RE in trained endurance runners, coaches should pay special attention to weekly mileage (combining HIIT and CR may be a good way to ensure a minimum mileage) and intensity of HIITs (close to or above 100%vVO2max).
4.2.3. Muscular adaptations to HIIT-based running plans
Improved global oxygen consumption and delivery also correspond with changes in muscle fiber, in which Type I fibers have greater oxidative capacity than Types IIA and IIX fibers. Interval training, by affecting glycolytic capacity, may also lead to increased mitochondrial activity in Type II fibers and thus show characteristics similar to those of Type I fibers.67 Training at maximal and near-maximal exercise intensities also seems to be effective in creating muscular adaptations such as increasesin the activity of oxidative enzymes and expression of Na+-K+ pump subunits and lactate and H+ transporters.32, 33, 34, 35 Moreover, HIIT causes repeated VO2 fluctuations related to changes in exercise intensity as opposed to CR, where VO2 is nearly constant during the exercise. Because of this, a higher exercise-induced oxidative stress could be expected; however, HIIT- and CR-based training programs induced similar beneficial effects in endurance runners, reducing the resting levels of oxidative stress biomarkers in plasma and urine.32 Therefore, because all these studies reported athletic performance improvements after a HIIT intervention longer than 7 weeks but did not all find VO2max or RE improvements, muscular adaptations to a HIIT period may play a critical role in the performance improvement of endurance runners.
On the other hand, no changes in muscle morphology occurred after 7–8 weeks of run-based endurance training34, 35 in either CR- or HIIT-based training programs. Likewise, capillary-to-fiber ratio and capillary density were unaltered after 7–8 weeks of HIIT-based running protocols (10–20–30 training concept).34, 35 These data suggest that HIIT running protocols are less effective in improving capillarization than prolonged running and that 10–20–30 training evokes weaker angiogenic stimuli than moderate-intensity exercise training. Because muscle capillarization is important for the delivery of oxygen and nutrients to the exercising muscle (a higher capillary density can increase muscle-to-blood exchange surface, decrease oxygen diffusion distance, and increase red blood cell mean transit time), these findings lead the authors to support the idea that both HIIT and CR must be part of training programs for endurance runners to maximize the physiological adaptations to training.
4.2.4. Changes induced in blood variables—at rest and after exhausting runs
Most of the intervention studies included in this review collected BLa at the end of an exhaustive running protocol,33, 34, 38, 39 with some of these studies reporting no adaptations after HIIT intervention,34, 39 so it seems that improved short-term performance can occur without changes in some of the key H+ transport proteins. Bangsbo et al.33 found changes in BLa clearance (but not in peak BLa) in athletes who had completed the HIIT intervention, whereas the CR group remained unchanged. Because maximal muscle oxidative capacity is related to BLa removal ability, the authors suggest that the differences in BLa clearance might be due to an oxidative capacity improvement during the HIIT period. From this thinking, either the lack of changes in BLa together with the performance improvement (similar BLa despite a greater athletic performance) reported by some studies34, 39 or the reduction of BLa after a running protocol performed at the same relative intensity38 is an indication of improved buffer capacity and H+ clearance in working muscle. Hence, training at high intensity can delay the accumulation of lactate in the blood, which may be due to an increased oxidative capacity of a greater number of muscle fibers and/or a reduced plasma K+ concentration (Plasma K+ contributes to the maintenance of muscle function during intense exercise33). The training protocols used by these studies are different; although results must be interpreted with caution, increased intensity in a running plan seems to be effective in improving oxidative capacity when compared with a CR-based plan.
Regarding resting blood variables, 2 studies34, 35 examined changes in blood hemoglobin and plasma iron, glucose, myoglobin, creatine kinase, cortisol, insulin, and triglycerides induced by intervention training programs. Although intense aerobic training is generally associated with improved blood lipid profile and insulin sensitivity, the results reported by these studies are equivocal, probably because the athletes were already trained at the beginning of the intervention.
5. Conclusion
Because HIIT running sessions lead, in the short term, to increased cortisol and testosterone concentrations, greater mean VO2, longer times above 90%VO2max, higher energy expenditure, and different effects on lipids response—and there being no reported “extra” neuromuscular strain or consistent perturbations in running kinematics (when compared with moderate-intensity CR)—they are an efficient option for endurance runners in response to demands of higher average intensities and lower weekly running distances (for injury prevention and performance improvements, respectively). Because of this, some studies have checked the effectiveness of HIIT-based running plans (minimum of 4-week program, at least 2 HIIT sessions per week, and mostly combining HIIT and CR workouts) and have shown athletic performance improvements in trained endurance runners by improving VO2max and RE along with muscular and metabolic adaptations (increased oxidative capacity of a greater number of muscle fibers and reduced plasma K+ concentration).
From a practical point of view, the authors support the idea that both HIIT and CR must be part of training programs for endurance runners to maximize adaptations to training. Additionally, the authors suggest that the inclusion of 2 to 3 HIIT sessions in a running plan, accumulating work periods longer than 10 min and working at close to or above vVO2max per session, lets recreational endurance runners improve their athletic performance. But what type of HIIT? In general, a good practice for endurance runners would include HIIT protocols involving short work periods (<1 min) with work–rest ratios of approximately 1:1 to 1:2, performed at close to all-out intensities, which enable athletes to elicit similar or greater mean average VO2 and to train at an increased running pace (above 100%vVO2max) when compared with longer HIIT or CR protocols. Nevertheless, the authors highlight that although HIIT and SIT, together with CR, must be a part of running plans for endurance athletes, the HIIT-based workload will vary according to training periodization, which must be based on the progressive overload principle.
Authors' contributions
FGP revised literature and drafted the manuscript; VMSH critically revised the manuscript; PALR revised literature and helped to draft the manuscript. All authors have read and approved the final version of the manuscript, and agree with the order of presentation of the authors.
Competing interests
None of the authors declare competing financial interests.
Acknowledgments
Authors would like to thank the University of Jaén for its support to the present study.
Footnotes
Peer review under responsibility of Shanghai University of Sport.
References
- 1.Laursen P.B. Training for intense exercise performance: high-intensity or high-volume training? Scand J Med Sci Sports. 2010;20(Suppl. 2):S1–10. doi: 10.1111/j.1600-0838.2010.01184.x. [DOI] [PubMed] [Google Scholar]
- 2.Laursen P.B., Jenkins D.G. The scientific basis for high-intensity interval training optimising training programmes and maximising performance in highly trained endurance athletes. Sports Med. 2002;32:53–73. doi: 10.2165/00007256-200232010-00003. [DOI] [PubMed] [Google Scholar]
- 3.Tschakert G., Hofmann P. High-intensity intermittent exercise: methodological and physiological aspects. Int J Sports Physiol Perform. 2013;8:600–610. doi: 10.1123/ijspp.8.6.600. [DOI] [PubMed] [Google Scholar]
- 4.Buchheit M., Laursen P.B. High-intensity interval training, solutions to the programming puzzle. Part II: anaerobic energy, neuromuscular load and practical applications. Sports Med. 2013;43:927–954. doi: 10.1007/s40279-013-0066-5. [DOI] [PubMed] [Google Scholar]
- 5.Buchheit M., Laursen P.B. High-intensity interval training, solutions to the programming puzzle: part I: cardiopulmonary emphasis. Sports Med. 2013;43:313–338. doi: 10.1007/s40279-013-0029-x. [DOI] [PubMed] [Google Scholar]
- 6.Esteve-Lanao J., San Juan A.F., Earnest C.P., Foster C., Lucia A. How do endurance runners actually train? Relationship with competition performance. Med Sci Sports Exerc. 2005;37:496–504. doi: 10.1249/01.mss.0000155393.78744.86. [DOI] [PubMed] [Google Scholar]
- 7.Billat L.V. Interval training for performance: a scientific and empirical practice. Special recommendations for middle- and long-distance running. Part I: aerobic interval training. Sports Med. 2001;31:13–31. doi: 10.2165/00007256-200131010-00002. [DOI] [PubMed] [Google Scholar]
- 8.Billat L.V. Interval training for performance: a scientific and empirical practice. Special recommendations for middle- and long-distance running. Part II: anaerobic interval training. Sports Med. 2001;31:75–90. doi: 10.2165/00007256-200131020-00001. [DOI] [PubMed] [Google Scholar]
- 9.Billat V., Lepretre P.M., Heugas A.M., Laurence M.H., Salim D., Koralsztein J.P. Training and bioenergetic characteristics in elite male and female Kenyan runners. Med Sci Sports Exerc. 2003;35:297–304. doi: 10.1249/01.MSS.0000053556.59992.A9. [DOI] [PubMed] [Google Scholar]
- 10.Girard O., Mendez-Villanueva A., Bishop D. Repeated-sprint ability—part I: factors contributing to fatigue. Sports Med. 2011;41:673–694. doi: 10.2165/11590550-000000000-00000. [DOI] [PubMed] [Google Scholar]
- 11.Bishop D., Girard O., Mendez-Villanueva A. Repeated-sprint ability—part II: recommendations for training. Sports Med. 2011;41:741–756. doi: 10.2165/11590560-000000000-00000. [DOI] [PubMed] [Google Scholar]
- 12.Gist N.H., Fedewa M.V., Dishman R.K., Cureton K.J. Sprint interval training effects on aerobic capacity: a systematic review and meta-analysis. Sports Med. 2014;44:269–279. doi: 10.1007/s40279-013-0115-0. [DOI] [PubMed] [Google Scholar]
- 13.Sloth M., Sloth D., Overgaard K., Dalgas U. Effects of sprint interval training on VO2max and aerobic exercise performance: a systematic review and meta-analysis. Scand J Med Sci Sports. 2013;23 doi: 10.1111/sms.12092. e341–52. [DOI] [PubMed] [Google Scholar]
- 14.Bishop D.J. Fatigue during intermittent-sprint exercise. Clin Exp Pharmacol Physiol. 2012;39:836–841. doi: 10.1111/j.1440-1681.2012.05735.x. [DOI] [PubMed] [Google Scholar]
- 15.Boutcher S.H. High-intensity intermittent exercise and fat loss. J Obes. 2011;2011 doi: 10.1155/2011/868305. 868305. [DOI] [PMC free article] [PubMed] [Google Scholar]
- 16.Iaia F.M., Bangsbo J. Speed endurance training is a powerful stimulus for physiological adaptations and performance improvements of athletes. Scand J Med Sci Sports. 2010;20(Suppl. 2):S11–23. doi: 10.1111/j.1600-0838.2010.01193.x. [DOI] [PubMed] [Google Scholar]
- 17.Skof B., Strojnik V. Neuromuscular fatigue and recovery dynamics following prolonged continuous run at anaerobic threshold. Br J Sports Med. 2006;40:219–222. doi: 10.1136/bjsm.2005.020966. [DOI] [PMC free article] [PubMed] [Google Scholar]
- 18.Millet G.Y., Lepers R. Alterations of neuromuscular function after prolonged running, cycling and skiing exercises. Sports Med. 2004;34:105–116. doi: 10.2165/00007256-200434020-00004. [DOI] [PubMed] [Google Scholar]
- 19.Higashihara A., Ono T., Kubota J., Okuwaki T., Fukubayashi T. Functional differences in the activity of the hamstring muscles with increasing running speed. J Sports Sci. 2010;28:1085–1092. doi: 10.1080/02640414.2010.494308. [DOI] [PubMed] [Google Scholar]
- 20.O'Brien B.J., Wibskov J., Knez W.L., Paton C.D., Harvey J.T. The effects of interval-exercise duration and intensity on oxygen consumption during treadmill running. J Sci Med Sport. 2008;11:287–290. doi: 10.1016/j.jsams.2007.05.004. [DOI] [PubMed] [Google Scholar]
- 21.Kaikkonen P., Hynynen E., Mann T., Rusko H., Nummela A. Heart rate variability is related to training load variables in interval running exercises. Eur J Appl Physiol. 2012;112:829–838. doi: 10.1007/s00421-011-2031-z. [DOI] [PubMed] [Google Scholar]
- 22.Seiler S., Hetlelid K.J. The impact of rest duration on work intensity and RPE during interval training. Med Sci Sports Exerc. 2005;37:1601–1607. doi: 10.1249/01.mss.0000177560.18014.d8. [DOI] [PubMed] [Google Scholar]
- 23.Vuorimaa T., Vasankari T., Rusko H. Comparison of physiological strain and muscular performance of athletes during two intermittent running exercises at the velocity associated with VO2max. Int J Sports Med. 2000;21:96–101. doi: 10.1055/s-2000-8867. [DOI] [PubMed] [Google Scholar]
- 24.Billat V.L., Slawinksi J., Bocquet V., Chassaing P., Demarle A., Koralsztein J.P. Very short (15s-15s) interval-training around the critical velocity allows middle-aged runners to maintain VO2max for 14 minutes. Int J Sports Med. 2001;22:201–208. doi: 10.1055/s-2001-16389. [DOI] [PubMed] [Google Scholar]
- 25.Wallner D., Simi H., Tschakert G., Hofmann P. Acute physiological response to aerobic short-interval training in trained runners. Int J Sports Physiol Perform. 2014;9:661–666. doi: 10.1123/ijspp.2013-0385. [DOI] [PubMed] [Google Scholar]
- 26.Seiler S., Sjursen J.E. Effect of work duration on physiological and rating scale of perceived exertion responses during self-paced interval training. Scand J Med Sci Sports. 2004;14:318–325. doi: 10.1046/j.1600-0838.2003.00353.x. [DOI] [PubMed] [Google Scholar]
- 27.van Gent R.N., Siem D., van Middelkoop M., van Os A.G., Bierma-Zeinstra S.M.A., Koes B.W. Incidence and determinants of lower extremity running injuries in long distance runners: a systematic review. Br J Sports Med. 2007;41:469–480. doi: 10.1136/bjsm.2006.033548. [DOI] [PMC free article] [PubMed] [Google Scholar]
- 28.Fields K.B., Sykes J.C., Walker K.M., Jackson J.C. Prevention of running injuries. Curr Sports Med Rep. 2010;9:176–182. doi: 10.1249/JSR.0b013e3181de7ec5. [DOI] [PubMed] [Google Scholar]
- 29.Nielsen R.O., Buist I., Sørensen H., Lind M., Rasmussen S. Training errors and running related injuries: a systematic review. Int J Sports Phys Ther. 2012;7:58–75. [PMC free article] [PubMed] [Google Scholar]
- 30.Downs S.H., Black N. The feasibility of creating a checklist for the assessment of the methodological quality both of randomised and non-randomised studies of health care interventions. J Epidemiol Community Health. 1998;52:377–384. doi: 10.1136/jech.52.6.377. [DOI] [PMC free article] [PubMed] [Google Scholar]
- 31.Maher C.G., Sherrington C., Herbert R.D., Moseley A.M., Elkins M. Reliability of the PEDro scale for rating quality of randomized controlled trials. Phys Ther. 2003;83:713–721. [PubMed] [Google Scholar]
- 32.Vezzoli A., Pugliese L., Marzorati M., Serpiello F.R., La Torre A., Porcelli S. Time-course changes of oxidative stress response to high-intensity discontinuous training versus moderate-intensity continuous training in masters runners. PLoS One. 2014;9:e87506. doi: 10.1371/journal.pone.0087506. [DOI] [PMC free article] [PubMed] [Google Scholar]
- 33.Bangsbo J., Gunnarsson T.P., Wendell J., Nybo L., Thomassen M. Reduced volume and increased training intensity elevate muscle Na+-K+ pump alpha2-subunit expression as well as short- and long-term work capacity in humans. J Appl Physiol. 2009;107:1771–1780. doi: 10.1152/japplphysiol.00358.2009. [DOI] [PubMed] [Google Scholar]
- 34.Gunnarsson T.P., Bangsbo J. The 10-20-30 training concept improves performance and health profile in moderately trained runners. J Appl Physiol. 2012;113:16–24. doi: 10.1152/japplphysiol.00334.2012. [DOI] [PubMed] [Google Scholar]
- 35.Gliemann L., Gunnarsson T.P., Hellsten Y., Bangsbo J. 10-20-30 training increases performance and lowers blood pressure and VEGF in runners. Scand J Med Sci Sports. 2015;25 doi: 10.1111/sms.12356. e479–89. [DOI] [PubMed] [Google Scholar]
- 36.Denadai B.S., Ortiz M.J., Greco C.C., de Mello M.T. Interval training at 95% and 100% of the velocity at VO2max: effects on aerobic physiological indexes and running performance. Appl Physiol Nutr Metab. 2006;31:737–743. doi: 10.1139/h06-080. [DOI] [PubMed] [Google Scholar]
- 37.Esfarjani F., Laursen P.B. Manipulating high-intensity interval training: effects on, the lactate threshold and 3000 m running performance in moderately trained males. J Sci Med Sport. 2007;10:27–35. doi: 10.1016/j.jsams.2006.05.014. [DOI] [PubMed] [Google Scholar]
- 38.Smith T.P., Coombes J.S., Geraghty D.P. Optimising high-intensity treadmill training using the running speed at maximal O2 uptake and the time for which this can be maintained. Eur J Appl Physiol. 2003;89:337–343. doi: 10.1007/s00421-003-0806-6. [DOI] [PubMed] [Google Scholar]
- 39.Zatoń M., Michalik K. Effects of interval training-based glycolytic capacity on physical fitness in recreational long-distance runners. Hum Mov. 2015;16:71–77. [Google Scholar]
- 40.Tanner A.V., Nielsen B.V., Allgrove J. Salivary and plasma cortisol and testosterone responses to interval and tempo runs and a bodyweight-only circuit session in endurance-trained men. J Sports Sci. 2014;32:680–689. doi: 10.1080/02640414.2013.850594. [DOI] [PubMed] [Google Scholar]
- 41.Latorre-Román P.Á., García-Pinillos F., Martínez-López E.J., Soto-Hermoso V.M. Concurrent fatigue and postactivation potentiation during extended interval training in long-distance runners. Mot Rev Educ Física. 2014;20:423–430. [Google Scholar]
- 42.García-Pinillos F., Soto-Hermoso V.M., Latorre-Román P.A. Acute effects of extended interval training on countermovement jump and handgrip strength performance in endurance athletes: postactivation potentiation. J Strength Cond Res. 2015;29:11–21. doi: 10.1519/JSC.0000000000000591. [DOI] [PubMed] [Google Scholar]
- 43.Hernández-Torres R.P., Ramos-Jiménez A., Torres-Durán P.V., Romero-Gonzalez J., Mascher D., Posadas-Romero C. Effects of single sessions of low-intensity continuous and moderate-intensity intermittent exercise on blood lipids in the same endurance runners. J Sci Med Sport. 2009;12:323–331. doi: 10.1016/j.jsams.2007.12.002. [DOI] [PubMed] [Google Scholar]
- 44.Demarie S., Koralsztein J.P., Billat V. Time limit and time at VO2max during a continuous and an intermittent run. J Sports Med Phys Fitness. 2000;40:96–102. [PubMed] [Google Scholar]
- 45.Collins M.H., Pearsall D.J., Zavorsky G.S., Bateni H., Turcotte R.A., Montgomery D.L. Acute effects of intense interval training on running mechanics. J Sports Sci. 2000;18:83–90. doi: 10.1080/026404100365144. [DOI] [PubMed] [Google Scholar]
- 46.Millet G.P., Libicz S., Borrani F., Fattori P., Bignet F., Candau R. Effects of increased intensity of intermittent training in runners with differing VO2 kinetics. Eur J Appl Physiol. 2003;90:50–57. doi: 10.1007/s00421-003-0844-0. [DOI] [PubMed] [Google Scholar]
- 47.García-Pinillos F., Párraga-Montilla J.A., Soto-Hermoso V.M., Latorre-Román P.A. Changes in balance ability, power output, and stretch-shortening cycle utilization after two high-intensity intermittent training protocols in endurance runners. J Sport Health Sci. 2016;5:430–436. doi: 10.1016/j.jshs.2015.09.003. [DOI] [PMC free article] [PubMed] [Google Scholar]
- 48.Laffite L.P., Mille-Hamard L., Koralsztein J.P., Billat V.L. The effects of interval training on oxygen pulse and performance in supra-threshold runs. Arch Physiol Biochem. 2003;111:202–210. doi: 10.1076/apab.111.3.202.23455. [DOI] [PubMed] [Google Scholar]
- 49.Hamada T., Sale D.G., Macdougall J.D. Postactivation potentiation in endurance-trained male athletes. Med Sci Sports Exerc. 2000;32:403–411. doi: 10.1097/00005768-200002000-00022. [DOI] [PubMed] [Google Scholar]
- 50.Nicol C., Komi P.V., Marconnet P. Fatigue effects of marathon running on neuromuscular performance. Scand J Med Sci Sports. 2007;1:10–17. [Google Scholar]
- 51.Vuorimaa T., Virlander R., Kurkilahti P., Vasankari T., Häkkinen K. Acute changes in muscle activation and leg extension performance after different running exercises in elite long distance runners. Eur J Appl Physiol. 2006;96:282–291. doi: 10.1007/s00421-005-0054-z. [DOI] [PubMed] [Google Scholar]
- 52.Benson L.C., O'Connor K.M. The effect of exertion on joint kinematics and kinetics during running using a waveform analysis approach. J Appl Biomech. 2015;31:250–257. doi: 10.1123/jab.2014-0138. [DOI] [PubMed] [Google Scholar]
- 53.Hanley B., Mohan A.K. Changes in gait during constant pace treadmill running. J Strength Cond Res. 2014;28:1219–1225. doi: 10.1519/JSC.0b013e3182a38796. [DOI] [PubMed] [Google Scholar]
- 54.Mizrahi J. Effect of fatigue on leg kinematics and impact acceleration in long distance running. Hum Mov Sci. 2000;19:139–151. [Google Scholar]
- 55.Derrick T.R., Dereu D., McLean S.P. Impacts and kinematic adjustments during an exhaustive run. Med Sci Sports Exerc. 2002;34:998–1002. doi: 10.1097/00005768-200206000-00015. [DOI] [PubMed] [Google Scholar]
- 56.Abt J., Sell T., Chu Y., Lovalekar M., Burdett R., Lephart S. Running kinematics and shock absorption do not change after brief exhaustive running. J Strength Cond Res. 2011;25:1479–1485. doi: 10.1519/JSC.0b013e3181ddfcf8. [DOI] [PubMed] [Google Scholar]
- 57.Latorre-Román P.Á., Jiménez M.M., Hermoso V.M.S., Sánchez J.S., Molina A.M., Fuentes A.R. Acute effect of a long-distance road competition on foot strike patterns, inversion and kinematics parameters in endurance runners. Int J Perform Anal Sport. 2015;15:588–597. [Google Scholar]
- 58.Larson P., Higgins E., Kaminski J., Decker T., Preble J., Lyons D. Foot strike patterns of recreational and sub-elite runners in a long-distance road race. J Sports Sci. 2011;29:1665–1673. doi: 10.1080/02640414.2011.610347. [DOI] [PubMed] [Google Scholar]
- 59.Koblbauer I.F., van Schooten K.S., Verhagen E.A., van Dieën J.H. Kinematic changes during running-induced fatigue and relations with core endurance in novice runners. J Sci Med Sport. 2014;17:419–424. doi: 10.1016/j.jsams.2013.05.013. [DOI] [PubMed] [Google Scholar]
- 60.Dierks T.A., Davis I.S., Hamill J. The effects of running in an exerted state on lower extremity kinematics and joint timing. J Biomech. 2010;43:2993–2998. doi: 10.1016/j.jbiomech.2010.07.001. [DOI] [PubMed] [Google Scholar]
- 61.Castro A., LaRoche D.P., Fraga C.H.W., Gonçalves M. Relationship between running intensity, muscle activation, and stride kinematics during an incremental protocol. Sci Sports. 2013;28 e85–92. [Google Scholar]
- 62.Schache A.G., Blanch P.D., Rath D.A., Wrigley T.V., Starr R., Bennell K.L. A comparison of overground and treadmill running for measuring the three-dimensional kinematics of the lumbo–pelvic–hip complex. Clin Biomech (Bristol, Avon) 2001;16:667–680. doi: 10.1016/s0268-0033(01)00061-4. [DOI] [PubMed] [Google Scholar]
- 63.García-Pérez J.A., Pérez-Soriano P., Llana S., Martínez-Nova A., Sánchez-Zuriaga D. Effect of overground vs treadmill running on plantar pressure: influence of fatigue. Gait Posture. 2013;38:929–933. doi: 10.1016/j.gaitpost.2013.04.026. [DOI] [PubMed] [Google Scholar]
- 64.Schubert A.G., Kempf J., Heiderscheit B.C. Influence of stride frequency and length on running mechanics: a systematic review. Sports Health. 2014;6:210–217. doi: 10.1177/1941738113508544. [DOI] [PMC free article] [PubMed] [Google Scholar]
- 65.Saunders P.U., Pyne D.B., Telford R.D., Hawley J.A. Factors affecting running economy in trained distance runners. Sports Med. 2004;34:465–485. doi: 10.2165/00007256-200434070-00005. [DOI] [PubMed] [Google Scholar]
- 66.Nummela A.T., Paavolainen L.M., Sharwood K.A., Lambert M.I., Noakes T.D., Rusko H.K. Neuromuscular factors determining 5 km running performance and running economy in well-trained athletes. Eur J Appl Physiol. 2006;97:1–8. doi: 10.1007/s00421-006-0147-3. [DOI] [PubMed] [Google Scholar]
- 67.Joyner M.J., Coyle E.F. Endurance exercise performance: the physiology of champions. J Physiol. 2008;586:35–44. doi: 10.1113/jphysiol.2007.143834. [DOI] [PMC free article] [PubMed] [Google Scholar]