

Abstract
Aim
To discuss the aims, methods, and results of a population-based cross-sectional prevalence survey of children ≤15 years, in South India and compare it with a study conducted earlier, in the same area. We also discuss the changing trends in the domain of childhood blindness in India.
Methods
A population-based cross-sectional prevalence survey of children ≤15 years, in Pavagada and Madhugiri taluks of Tumkur district in Karnataka state in south India, was conducted in 2 phases. One trained medical-social-worker and one field-investigator identified eligible children and brought them to a makeshift clinic in the village school, where they were examined by an ophthalmologist. Children with minor problems were treated on the field and those with major conditions were referred to the pediatric ophthalmologist in the tertiary hospital. The prevalence of specific diseases were calculated in percentages.
Results
The prevalence of childhood ocular morbidity (COM) was 6.54%. Refractive errors (2.77%) constituted the major cause of COM. The prevalence of blindness (best corrected visual acuity of <3/60 in the better eye) was 0.09%. Whole-globe anomalies (25%) and uveal coloboma (25%) constituted the main cause of blindness.
Conclusion
A major proportion of the blindness was due to unavoidable causes. Unlike several earlier studies, corneal blindness is no longer the main cause of blindness. This shows that there is a changing trend in the pattern of childhood blindness in India. The current data demonstrate the need for low vision rehabilitative services and a review of public health strategy in India.
Introduction
Nineteen million childrens, around the world are visually impaired and 1.4 million are blind [1]. The control of blindness in children becomes important for the following reasons: (a) Many of the conditions associated with blindness are also causes of child mortality; for example, vitamin A deficiency, measles, prematurity, congenital rubella syndrome, and meningitis [2]. (b) Since children have a life time of blindness ahead of them, number of blind years is second only to cataract blindness [2]. (c) Loss of vision has a significant impact on the child’s psychological, educational and socio-economic conditions, not only during childhood, but extending into adulthood [3].
Population-based studies are required to plan an economically prudent and targeted approach to the problem of childhood ocular morbidity (COM), to design robust preventive eye care measures and healthcare management. There are limited population-based data on the epidemiology of childhood blindness owing to the methodological challenges in obtaining accurate information on rare and heterogeneous ocular disorders [3].
With these factors in mind, the Pavagada Pediatric Eye Disease Studies (PPEDS) 1 and 2 were initiated. The objectives, methodology and participant characteristics [4] and the results of PPEDS 1 [5] have been published.
In this paper, we describe the methodology and results of the PPEDS 2 and try to draw a comparison and a meaningful conclusion between the studies. We also discuss the changing trends in the domain of childhood blindness in India.
Objectives
The aims of this study were to determine the prevalence of childhood blindness and ocular morbidity among children ≤15 years of age in 2 socio-economically backwards taluks (sub-districts) in south India.
Materials and methods
This is a population-based cross-sectional descriptive study of children ≤15 years of age, conducted from August 2012 to December 2013. It was approved by the Institutional Review Board of the hospital and conducted within the tenets of the Declaration of Helsinki.
Setting
The study was conducted in Pavagada and Madhugiri taluks in Tumkur district of Karnataka state in south India (Fig. 1), with a combined population of 512,007 (2011 census). The eye hospital in Pavagada was able to give secondary level eye care on a routine basis and tertiary level eye care was given by a tertiary eye care hospital situated in a nearby city.
Fig. 1.

Showing the geographical location of the study area in the country and the state
Participants
Children ≤15 years of age, residing in the study area were eligible to participate in the study. Selection of participants was undertaken by a medical-social-worker and field-investigator who mapped and enumerated all occupied residential households in the defined study area. The study was conducted in two phases. In the first phase, eligible children from the households surveyed were identified and brought to the makeshift clinic in a school, on the day of the examination. One ophthalmologist performed all the ophthalmic examination procedures. The medical-social-worker and field-investigator were trained to measure the visual acuity using an illiterate E Log Mar chart or Lea symbols and the stereo-acuity using Lang stereo test. Children who were unable to respond to the E chart/Lea symbols were assessed for the ability to fix and follow light and objects. The ophthalmologist then, evaluated the extraocular movements, did a Hirschberg’s test, cover test at ½ meter and 3 m distance, and an external examination of the eye and adnexa using the magnification of the 20D lens. The following children were taken up for cycloplegic refraction and a detailed evaluation: Children aged 2 years and not co-operative for visual acuity recording/did not fix and follow light/objects, 3–4-year-old children who could not read the 3/7.5 line [6], 5-year-old children who could not read the 3/6 line [6], children ≥6 years who could not read the 3/4.8 line, failed stereopsis test, limitation of extraocular movements, strabismus, ptosis, microphthalmia, anomalous head position, lacrimal and lid anomalies, nystagmus, heterochromia, anisocoria, and afferent pupillary defect. Dilatation was achieved with 1% cyclopentolate in each eye repeated three times at 5 min intervals. For children under 1 year, a combination of 0.5% cyclopentolate and 2.5% phenylephrine were used. Cycloplegia was considered complete if the pupil was dilated to ≥6 mm and light reflex was absent. Cycloplegic auto-refraction was then performed. Manual retinoscopy with streak retinoscope was performed in children who did not co-operate for auto-refraction. The slit lamp examination of the anterior segment was followed by fundus examination with the indirect ophthalmoscope. The principal cause of ocular morbidity/blindness was assigned after completion of the ocular examination and major site of ocular morbidity/blindness was noted. When there were co-existing eye diseases, a clinical decision during the examination was made by the ophthalmologist as to the primary cause of the ocular morbidity/blindness. Refractive error was recorded as the cause of visual impairment in eyes improving to 3/4.8 or better with refractive correction. Children with major eye diseases like strabismus, nystagmus, amblyopia, abnormal fundus, media opacities like cataract, corneal opacity or vitreous hemorrhage and previous surgery were referred to a pediatric ophthalmologist. Children whose vision improved with refractive error correction in either eye were prescribed and provided spectacles within 2 weeks of the examination.
In the second phase, children who required the services of a pediatric ophthalmologist were brought to the peripheral rural hospital on the day when the specialist was available, who then suggested the appropriate management.
Sample size calculation
The sample size was calculated using the formula 4pq/l2 where p = prevalence of the factor of interest, q = 1-p or 100-p if it is expressed as a percentage, and I is the acceptable margin of error. The major disorder of interest for sample size calculation was ocular morbidity [9.39 % (95% CI 8.006–10.93)] [prevalence of ocular morbidity taken from personal communication—Babu RB. The Madhugiri pediatric eye disease study. April 2010]. Taking 8% (lower limit of CI) as the prevalence, 10% acceptable margin of error and design effect of 1.5, the sample size was determined to be 8115.
Sampling frame
The percentage of children in the total population was about 25.33% (2011 census). To be able to screen 8115 children, the total population (including adults) to be surveyed in the study area was about 32,048. In order to do a comparative study between the rural and urban populations, we took half the sample from the urban area and the other half from the rural area. Therefore the rural and urban population to be studied was 16,024 (including adults), in each group. The average household size in the study area was estimated to be 4.8. Thus, the total numbers of households to be covered in each group was 3338 amounting to a total of 6676 households.
Enumeration of villages
There are 145 and 297 villages in Pavagada and Madhugiri, respectively, and a total of 42 urban wards (20 in Pavagada and 22 in Madhugiri). These villages/urban wards were standardized according to the size. Villages/urban wards with <200 households were clubbed together, the total number not exceeding 400 households. Those with household size ranging from 200 to 400 were retained as they were and those with 400+ households were divided into two or more units.
The number of standardized villages in the 2 taluks were 355. Of the 355 standardized villages, we chose 30 standardized villages (15 from Pavagada and 15 from Madhugiri). Twenty-five urban clusters were selected from the list of 41 standardized urban wards (12 urban wards from Pavagada and 13 from Madhugiri). The names of all the 355 villages and 41 urban wards were written in pieces of paper, shuffled and 30 villages/25 urban wards were picked randomly. The route map for the survey was then made and the villages/urban wards were coded. About 165 children were enumerated per cluster.
Definitions used in the study
Urban ward
The definition adopted was as follows: (a) All statutory places with a municipality, corporation, cantonment board, or notified town area. (b) A place satisfying the following three criteria simultaneously: 1. A minimum population of 5000. 2. At least 75% of male working population engaged in non-agricultural pursuits. 3. A density of population of at least 400 persons per sq. km [7].
Rural cluster (village)
All that do not come under the urban cluster definition were considered rural.
Ocular morbidity was defined as ocular pathology requiring clinical intervention or follow-up [8].
Blindness was defined as the best corrected visual acuity less than 3/60 and visual field 10 degree or worse in the better eye (WHO).
Moderate visual impairment was defined as presenting visual acuity less than 6/18 to 6/60 in the better eye (ICD-10) [9].
Severe visual impairment was defined as the presenting visual acuity less than 6/60 to 3/60 in the better eye (ICD-10) [9].
Amblyopia was defined as decreased visual acuity of less than 6/12 or worse, in one or both eyes, due to abnormal binocular interaction and/or pattern vision deprivation with no apparent organic lesion, which can be corrected by appropriate treatment [10].
Xerophthalmia
Encompasses the clinical spectrum of ocular manifestations of vitamin A deficiency from milder stages of night blindness and Bitot’s spots, to potentially blinding stages of corneal xerosis, ulceration and necrosis (keratomalacia) [11].
Bitot spots
Advanced dryness of the conjunctiva composed of desquamated keratinized epithelium, cheesy or foamy in appearance due to vitamin A deficiency [12].
Refractive errors
Myopia was defined as a spherical equivalent refractive error of more than −0.5 D & hyperopia of more than +2 D [13].
Strabismus
Misalignment of the visual axis causing an outward, inward, upward, or downward deviation of either eye.
Pediatric cataract
Lens opacity in one or both eyes, in children less than 15 years, due to any etiology, dense enough to cause vision less than 6/9 was considered as a pediatric cataract.
Anophthalmus
Anophthalmia refers to complete absence of the globe in the presence of ocular adnexa (eyelids, conjunctiva, and lacrimal apparatus) [14].
Microphthalmos
For the purposes of this study, we considered children with a corneal diameter of <9 mm as microphthalmos, since we did not have access to ultrasound machine to measure the axial length of the eye.
Coloboma occurs due to the failure of closure of embryonic fissure.
Retinal degenerations or dystrophies
Inherited photoreceptor and/or retinal pigment epithelial dysfunction of obscure origin.
Statistical analysis
The overall prevalence of blindness, ocular morbidity and various eye anomalies, according to the anatomical site was calculated in percentages. Ninety-five percent confidence limits were calculated for prevalence rates assuming a binomial distribution, using the formula, p ± 1.96 √(p(1 − p))/n, where p is the prevalence of the ocular morbidity and n is the total population screened. The prevalence of the various eye disorders, ocular morbidity and blindness between the two studies were compared using the p-value and a value <0.05 was considered significant.
The dissimilarities and similarities between the studies have been highlighted in Table 1.
Table 1.
Dissimilarities and similarities in the methodology between Pavagada Pediatric Eye Disease Studies 1 and 2
| PPEDSa 1 | PPEDSa 2 |
|---|---|
| Dissimilarities | |
| Time period: Study was undertaken from July 2008 to April 2009. | Time period: Study was undertaken from August 2012 to December 2013. |
| Aim: To determine the prevalence of childhood blindness and ocular morbidity in a rural pediatric population in South India | Aim: 1. To determine the prevalence of childhood blindness and ocular morbidity in a rural pediatric population in South India. 2. To ascertain the role of consanguinity in the causation of blindness. 3. To find out the barriers to access of eye care. |
| Sample size calculation: The major disorder of interest for estimation of the sample size was considered to be strabismus. (0.43%) | Sample size calculation: The major disorder of interest for sample size calculation was ocular morbidity. (9.39%) |
| Sample size: 29,850 out of which 23,100 children were screened | Sample size: 8115. 9052 were enumerated out of which 8553 children were screened. |
| Sampling frame: Ninety-four standardized villages and nine urban wards | Sampling frame: Thirty standardized villages and 25 urban wards. Equal number of urban and rural population was selected so as to be able to compare the two |
| Each eligible child from the households surveyed was given an 11 digit unique study identification number which consisted of Taluk [1 digit]/Hobli [2 digits]/village [3 digits]/structure [3 digits]/household [1 digit]/childbirth order [1 digit] e.g.,: 10100100111. | Each eligible child from the households surveyed was given a 10 digit unique study identification number which consisted of Taluk [1digit]/Hobli [2 digits]/village [2 digits]/structure [3 digits]/household [1 digit]/childbirth order [1 digit] e.g.,: 1010100111. |
| The study was conducted in 3 phases. 1st phase: Field workers were used to screen children with eye diseases. 2nd phase: The children with eye diseases were seen by a general ophthalmologist in a peripheral rural hospital. 3rd phase: Children with major eye diseases like cataracts, strabismus and retinal dystrophies were seen a pediatric ophthalmologist once a month. | The study was conducted in 2 phases. 1st phase: Enumeration and identification of children were done by a medical social worker and a field investigator. One single ophthalmologist then examined all the eligible children in makeshift eye clinics. Minor eye diseases like refractive errors, conjunctivitis were treated by the general ophthalmologist. 2nd phase: Children with major eye diseases were seen by the pediatric ophthalmologist in the tertiary eye care hospital. |
| Field work: Ten field workers were trained, validated and used for screening. They were given preformed questionnaires and taught to record vision and do a basic torch light examination of the eyes. If the answer to any one question was ‘yes’ (in the questionnaire), they were asked to refer the child for a detailed ophthalmic examination in the peripheral rural hospital. No ophthalmologist was present at this stage. | Field work: One medical-social-worker and one field-investigator did the identification and enumeration of the children. They assisted the ophthalmologist in the field in assessing the vision. They were not involved in examination of the children. The medical-social-worker and field-investigator asked the mothers of the children with eye disease to fill up a questionnaire, to assess the barriers to eye care. The questions were readout to mothers who were illiterate |
| Response rate: 77.39% | Response rate: 94.49% |
| Similarities | |
| 1. Study was conducted in the same geographical location. However, there was an overlap of 7 urban wards (3 from Pavagada and 4 from Madhugiri) and 21 villages (12 from Pavagada and 9 from Madhugiri) in both the studies | |
| 2. Study design was the same: both were population-based cross-sectional descriptive studies | |
| 3. In both the studies, children less than or equal to 15 years of age were the eligible candidates | |
| 4. The villages were standardized in the same manner | |
| 5. The disease definitions used were the same | |
aPavagada Pediatric Eye Disease Study
Results
A total number of 9052 children were enumerated (though the sample size was 8115, the medical-social-worker and field-investigator enumerated about 165 children in each village/urban ward). A total of 499 childrens refused an eye examination; hence 8553 children were examined (response rate—94.49%).
The demographic and baseline characteristics of the study population, the children who refused an eye examination and the children with eye diseases are shown in Table 2.
Table 2.
Showing the demographic and baseline characteristics of the study population
| A. Demographic and baseline characteristics of the screened population in PPEDSa 2 | ||||
|---|---|---|---|---|
| Variable age (n = 9052) | Gender n (%) | Total | Column (%) | |
| Male | Female | |||
| 0–5 years | 1484 (51.77) | 1382 (48.22) | 2866 | 31.66 |
| 6–10 years | 1662 (51.51) | 1564 (48.48) | 3226 | 35.63 |
| 11–15 years | 1516 (51.21 | 1444 (48.78) | 2960 | 32.69 |
| Total | 4662(51.50) | 4390(48.49) | 9052 | 100 |
| B. Demographic and baseline characteristics of the children who refused examination in PPEDSa 2 | ||||
|---|---|---|---|---|
| Age (n = 499) | Gender n (%) | Total | Column (%) | |
| Male | Female | |||
| 0–5 years | 102 (52.31%) | 93 (47.69%) | 195 | 39.08% |
| 6–10 years | 53 (45.30) | 64 (54.70) | 117 | 23.45% |
| 11–15 years | 96 (51.34%) | 91 (48.66%) | 187 | 37.47% |
| Total | 251 (50.30%) | 248 (49.70) | 499 | 100 |
| C. Demographic and baseline characteristics of study subjects with eye diseases in PPEDSa 2 | ||||
|---|---|---|---|---|
| Variable age (n = 559) | Gender n (%) | Total | Column (%) | |
| Male | Female | |||
| 0–5 years | 36 (50.70) | 35 (49.29) | 71 (2.48%)b | 12.70 |
| 6–10 years | 132 (60.27) | 87 (39.72) | 219 (6.79%)b | 39.18 |
| 11–15 years | 127 (47.21) | 142 (52.78) | 269 (9.09%)b | 48.12 |
| Total | 295 (52.77) | 264 (47.22) | 559 (6.17%)b | 100 |
aPavagada Pediatric Eye Disease Study
bThe percentage is of the number of children with eye disease, as compared to the number of children screened in each age group
There was almost equal distribution of males and females (50.3% males and 49.7% females) in children with eye diseases. The prevalence of ocular morbidity was 6.54%. The most common cause of ocular morbidity was refractive errors (2.77%), in PPEDS 2. Table 3 shows the prevalence of ocular morbidity, blindness and various eye anomalies (according to the anatomical site) in PPEDS 1 and 2. There was significant difference in the prevalence of disorders of the lid and adnexa (p = < 0.001), strabismus (p = 0.014) and refractive errors (p = < 0.001) between PPEDS 1 and 2. There was great variability and no specific pattern in the male to female ratio in children with specific eye diseases (for e.g., there were nine males and four females in children with whole-globe anomalies, four males and 11 females in children with uveal disease, three males and four females in children with lens disorders and three males and one female in children with retinal disorders). The prevalence of blindness (BCVA of <3/60 in the better eye) in PPEDS 2, was 0.09% (0.9/1000). The causes of blindness in PPEDS 1 and 2 are shown in Fig. 2. The most common cause of blindness in PPEDS 1 was retina (44%) and whole-globe anomalies (25%) and uveal coloboma (25%) in PPEDS 2. Out of the eight children with blindness in PPEDS 2, four were males and four were females.
Table 3.
Showing the prevalence of various eye disorders in PPEDSa 1 and 2, according to site of anomaly
| Major site of anomaly | Total no. of children with problems | Prevalence in % (95% CI) | P-value | ||
|---|---|---|---|---|---|
| PPEDSa 1 n = 23,087 | PPEDSa 2 n = 8553 | PPEDSa 1 | PPEDSa 2 | ||
| Whole-globe anomaly | 21 | 13 | 0.09 (0.05–0.13) | 0.15 (0.07–0.23) | 0.141 |
| Microphthalmos | 15 | 6 | 0.06 (0.03–0.10) | 0.07 (0.01–0.13) | 0.874 |
| Disorders of lids and Adnexa | 26 | 35 | 0.11 (0.07–0.16) | 0.41 (0.27–0.54) | < 0.001 |
| Bitot spots | 232 | 70 | 1.00 (0.88–1.13) | 0.82 (0.63–1.01) | 0.130 |
| Corneal opacities | 31 | 8 | 0.13 (0.09–0.19) | 0.09 (0.03–0.16) | 0.359 |
| Anomalies of Lens | 23 | 7 | 0.10 (0.06–0.14) | 0.08 (0.02–0.14) | 0.648 |
| Pediatric cataract | 13 | 5 | 0.06 (0.03–0.09) | 0.06 (0.01–0.11) | 0.944 |
| Uveal disease | 41 | 15 | 0.18 (0.12–0.23) | 0.18 (0.09–0.26) | 0.967 |
| Retinal disease | 23 | 4 | 0.10 (0.06–0.14) | 0.05 (0.00–0.04) | 0.153 |
| Optic nerve disease | 3 | 2 | 0.01 (0.00–0.02) | 0.02 (0.00–0.06) | 0.882* |
| Disorders of strabismus | 105 | 58 | 0.45 (0.37–0.54) | 0.68 (0.50–0.85) | 0.014 |
| Refractive errors | 120 | 237 | 0.52 (0.43–0.61) | 2.77 (2.42–3.12) | <0.001 |
| Prevalence of blindness | 18 | 8 | 0.08 (0.04–0.11) | 0.09 (0.03–0.16) | 0.668 |
| Prevalence of ocular morbidity | 615 | 559 | 2.66 (2.46–2.87) | 6.54 (6.01–7.06) | <0.001 |
aPavagada Pediatric Eye Disease Study
*Yates’ p-value
The bold entries indicate significant p-value
Fig. 2.
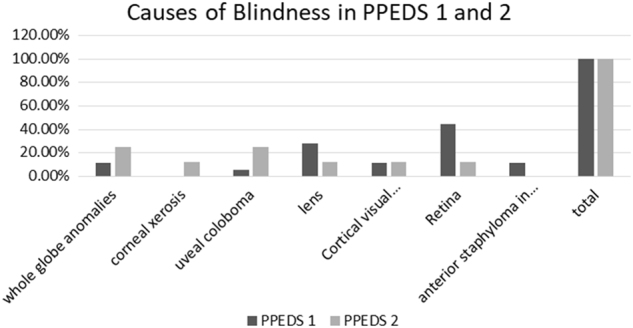
showing the various causes of blindness in the Pavagada pediatric eye disease study 1 and 2
There were 21 children (0.25%) (9 males and 12 females) with moderate visual impairment (presenting visual acuity (PVA) of <6/18 to 6/60 in the better eye), which were all due to uncorrected refractive errors. One male child (0.04%) with status post penetrating keratoplasty, had severe visual impairment (PVA of <6/60 to 3/60 in the better eye). Nine children (0.11%) (5 males and 4 females) had a PVA of <3/60. Out of this one male child with subluxed lenses in both the eyes, improved with aphakic correction and had a BCVA of 6/15 in the better eye. Out of the 31 children with a PVA of <6/18 in the better eye, 12 children did not improve with correction. In 19 children the BCVA in the better eye was >6/18. That means 61.29% of the children had avoidable visual impairment.
Discussion
When we planned PPEDS 1, we were keen on using trained field workers and not ophthalmologists, for screening. This way, the qualified ophthalmologist could use his/her time more optimally in secondary or tertiary care hospitals. Unfortunately we were not successful in this endeavor. Though PPEDS 1 was planned to be in three stages, it could not be conducted in three stages, since a large proportion (60%) of the children referred by the field workers did not come to the peripheral rural hospital and had to be evaluated in the field by the pediatric ophthalmologist. Hence, when we conducted PPEDS 2, we modified our field activity plan so that all children were seen by the same ophthalmologist in make shift clinics in the village schools or in the mobile ophthalmic van. This way, we observed that the response rate was significantly higher (77.39% in PPEDS 1 vs 94.49% in PPEDS 2).
The difference in prevalence of ocular morbidity in PPEDS 1 and 2 (2.66% in PPEDS 1 and 6.54% in PPEDS 2) was statistically significant (p = < 0.001). The main diseases which contributed to this difference were disorders of lid and adnexa (p = < 0.001), strabismus (p = 0.014), and refractive errors (p = < 0.001). This difference could be attributed to the fact that, in PPEDS 1, we used trained field workers to do the first level of screening and in PPEDS 2, all children were examined by an ophthalmologist. There could be a possibility that the field workers may have missed minor diseases like blepharitis and conjunctivitis, thus erroneously decreasing the prevalence of the disorders of lid and adnexa. Intermittent and small angle strabismus can be better detected with a cover test which was done by an ophthalmologist in PPEDS 2 and was not done by the field workers in PPEDS 1. However, the prevalence of blindness in both the studies were almost the same (0.08% in PPEDS 1 and 0.09% in PPEDS 2, with a p-value of 0.668). This shows that, though the field workers missed detecting minor eye diseases, they were able to detect major eye diseases leading to blindness.
The causes of childhood blindness can be divided into unavoidable and avoidable causes. Unavoidable causes include congenital abnormalities, optic atrophy, and retinal dystrophies [15]. The preventable (corneal scarring due to vitamin A deficiency) and treatable causes (childhood cataracts) make up the avoidable causes of childhood blindness. Avoidable causes of blindness have been reported to be more commonly prevalent in the lower income countries [16, 17], whereas unavoidable causes of blindness are more common in the higher income countries [3, 18]. In the 1990s, the most common causes of childhood blindness in Asia and Africa were corneal scar, cataract, glaucoma, and optic atrophy [19–21]. A study conducted on 1318 blind school students in India (lower middle income country) in 1995 [17, 22] showed corneal causes (due to vitamin A deficiency) to be the most common cause of childhood blindness. A more recent study published in 2012, conducted in blind schools in Andhra Pradesh shows whole-globe anomalies to be the main cause of blindness [23]. There is no data available on population-based studies on childhood blindness in India in the 1990s. The more recent population-based studies from India by Dandona et al. [24], and Dorairaj et al. [25], show lens anomalies as the main cause of blindness. Another study by Nirmalan et al. [8] shows refractive error to be the main cause of blindness.
In a study conducted in Bangladesh (lower middle income country), un-operated pediatric cataract was the single most common cause of childhood blindness followed by corneal scarring [16]. In Pakistan (lower middle income), corneal blindness remains the main cause for childhood blindness [26]. A study conducted in Vietnam (lower middle income), which included a population-based sample and a sample from the schools for the blind, found uncorrected refractive errors and retinal causes as the major cause of blindness[27]. In a recent study conducted in Malaysia (upper middle income), diseases of the retina were a major cause of visual impairment with retinopathy of prematurity being an important avoidable cause [28].
Among the lower income countries, a study conducted in Nepal showed amblyopia and congenital cataracts to be the most common cause of blindness with 2/3 of the blindness being due to avoidable causes [29]. A 2003 blind school study conducted in Ethiopia (lower income) showed corneal blindness due to vitamin A deficiency and measles to be the most common cause of childhood blindness [30]. In a more recent study in 2011, in Ethiopia, congenital cataract was the most common cause of blindness [31]. The above discussion shows that there is a change in pattern of blindness in some of the lower middle income countries. The main cause of blindness in PPEDS 1 and 2 were unavoidable blindness (retinal dystrophies in PPEDS 1 and whole-globe anomalies and uveal coloboma in PPEDS 2). With a reduction in the preventable causes of blindness, there will be a relative increase in the unavoidable causes of blindness [32]. From the available data, it is evident that the pattern of blindness is emerging toward unavoidable blindness in the middle income countries, but remains to be avoidable blindness in lower income countries.
The causes of visual impairment across population-based studies conducted in India [8, 24, 25, 33, 34] were uncorrected refractive errors. In PPEDS 2, 61.29% of the children with PVA of <6/18 in the better eye, improved with refractive correction. This proves that there is an unmet need in this area, in terms of eye care.
Limitations of the study
This study is limited to a small geographical area in the southern part of the country and the results cannot be extrapolated to the entire country. This study will however be helpful to target appropriate service delivery to this area.
One of the aims of the national program of control of blindness (NPCB) in India is to eliminate causes of avoidable blindness by 2020 [35]. Though provision of low vision service is one of the aims of the NPCB, the major constraints in the delivery are, lack of awareness among eye care professionals, non-availability of good quality low cost, low vision devices and low vision training programs [36]. In view of the change in the pattern of childhood blindness, the government of India and other developing countries should consider an appropriate change in the current delivery of services, with more emphasis being laid on rehabilitative and low vision services. There is definitely a need for review of public health childhood vision programs in India.
Summary
What was known before
This is a population-based cross-sectional study to measure the prevalence of childhood blindness and ocular morbidity in two backward taluks in south India.
An earlier study (Pavagada Pediatric Eye Disease Study-1 [PPEDS 1]) conducted in this area was conducted in 3 phases. First phase used trained field workers to do the screening. In the second phase, children with eye diseases were seen by a general ophthalmologist in a peripheral rural hospital and in the 3rd phase, children with major eye diseases like cataracts, strabismus and retinal dystrophies were seen a pediatric ophthalmologist once a month.
Though planned to be in 3 stages, it could not be conducted in 3 stages, since a large proportion (60%) of the children referred by the field workers did not come to the peripheral rural hospital and had to be evaluated in the field by the pediatric ophthalmologist.
The ocular morbidity in PPEDS 1 was 2.66%.
What this study adds
Identifying children with eye disease and then asking them to come to the hospital for treatment results in a low-response rate. It is better for the doctor to go the villages and treat minor eye diseases in the field itself.
Using trained field workers may result in missing out minor eye disease like blepharitis (The ocular morbidity was 2.66% in PPEDS 1 and 6.54% in PPEDS 2, p = < 0.001).
However, the prevalence of blindness in both the studies were almost the same (0.08% in PPEDS 1 and 0.09% in PPEDS 2, with a p-value of 0.668). This shows that, though the field workers missed detecting minor eye diseases, they were able to detect major eye diseases leading to blindness.
Acknowledgements
We would like to sincerely thank the following people and organizations Swami Japanandaji, Chairman and all the staff of Shree Sharada Devi Eye Hospital and Research Centre, Pavagada, Karnataka, India. GKB Optolabs Private limited and GKB Hi Tech Lenses Private Limited, Bangalore, India, for providing free spectacles to the children found to have refractive errors in this project.
Compliance with ethical standards
Conflict of interest
The authors declare that they have no conflict of interest.
Footnotes
Sources of support: This project was supported by the Indian Council of Medical Research (ICMR) vide Ref: 5/4/6/2/09 – NCD-11 dated 22.03.2011.Pavagada Pediatric Eye Disease Study/Beyond Blindness
References
- 1.World Health Organisation. Visual impairment and blindness. 2014. Accessed 29 November 2017. http://www.who.int/mediacentre/factsheets/fs282/en/
- 2.Gilbert C, Foster A. Childhood blindness in the context of vision 2020 – the right to sight. Bull World Health Organ. 2001;79:227–32. [PMC free article] [PubMed] [Google Scholar]
- 3.Solebo AL, Jugnoo R. Epidemiology, aetiology and management of visual impairment in children. Arch Dis Child. 2014;99:375–9. doi: 10.1136/archdischild-2012-303002. [DOI] [PubMed] [Google Scholar]
- 4.Kemmanu V, Hegde K, Devagirkar S, et al. The Pavagada Pediatric Eye Disease Study: objectives, methodology and participant characteristics. Ophthalmic Epidemiol. 2013;20:176–87. doi: 10.3109/09286586.2013.783080. [DOI] [PubMed] [Google Scholar]
- 5.Kemmanu V, Hegde K, Giliyar SK, et al. Prevalence of childhood blindness and ocular morbidity in a rural pediatric population in Southern India: the Pavagada Pediatric Eye Disease Study-1. Ophthal Epidemiol. 2016;23:185–92. doi: 10.3109/09286586.2015.1090003.. [DOI] [PubMed] [Google Scholar]
- 6.American Academy of Ophthalmology Pediatric Ophthalmology/Strabismus Panel. Preferred Practice Pattern® Guidelines. Pediatric Eye Evaluations. San Francisco, CA: American Academy of Ophthalmology; 2007. [Google Scholar]
- 7.www.censusindia.gov.in. Accessed on 4.09.2016
- 8.Nirmalan PK, Vijayalakshmi P, Sheeladevi S, et al. The Kariapatti pediatric eye evaluation project: baseline ophthalmic data of children aged 15 years or younger in Southern India. Am J Ophthalmol. 2003;136:703–9. doi: 10.1016/S0002-9394(03)00421-5. [DOI] [PubMed] [Google Scholar]
- 9.Vashist P, Senjam SS, Gupta V, Gupta N, Kumar A. Definition of blindness under National Programme for Control of Blindness: do we need to revise it? Indian J Ophthalmol. 2017;65:92–6. doi: 10.4103/ijo.IJO_869_16. [DOI] [PMC free article] [PubMed] [Google Scholar]
- 10.Gunter K von Noorden, Emilio C Campos. Binocular Vision and Ocular motility. Theory and Management of Strabismus. 6th ed. Chapter 14. p. 246. Mosby: USA, 2002.
- 11.The Epidemiology of Eye Diseases. 2nd ed. Gordon J Johnson, Darwin C Minassian, Robert A Weale, Sheila K west, editors. Chapter 15. p. 245. Talyor & Francis: London, UK, 2003.
- 12.The Epidemiology of Eye Diseases. 2nd ed. Gordon J Johnson, Darwin C Minassian, Robert A Weale, Sheila K west, editors. Chapter 15. p. 246. Talyor & Francis: London, UK, 2003.
- 13.Negrel DA, Maul E, Pokharel GP, Zhao J, Ellwein LB. Refractive error study in children: sampling and measurement methods for a multi-country survey. Am J Ophthalmol. 2000;129:421–6. doi: 10.1016/S0002-9394(99)00455-9. [DOI] [PubMed] [Google Scholar]
- 14.Bardakjian T, Weiss A, Schneider AS. Anopthalmia/Microphthalmia Overview. GeneReviews. In: Pagon RA, Bird TD, Dolan CR, Stephens K, editors. GeneReviews [Internet] Seattle (WA): University of Washington, Seattle; 2007. [Google Scholar]
- 15.Gilbert CE, Anderton L, Dandona L, et al. Prevalence of blindness and visual impairment in children—a review of available data. Ophthalmic Epidemiol. 1999;6:73–81. doi: 10.1076/opep.6.1.73.1571. [DOI] [PubMed] [Google Scholar]
- 16.Muhit MA, Shah SP, Gilbert CE, et al. Causes of severe visual impairment and blindness in Bangladesh: a study of 1935 children. Br J Ophthalmol. 2007;91:1000–4. doi: 10.1136/bjo.2006.108019. [DOI] [PMC free article] [PubMed] [Google Scholar]
- 17.Mehari ZA. Pattern of childhood ocular morbidity in rural eye hospital, Central Ethiopia. BMC Ophthalmol. 2014;14:50. doi: 10.1186/1471-2415-14-50. [DOI] [PMC free article] [PubMed] [Google Scholar]
- 18.Kong L, Fry M, Al-Samarraie M, et al. An update on progress and the changing epidemiology of causes of childhood blindness worldwide. J AAPOS. 2012;16:501–7. doi: 10.1016/j.jaapos.2012.09.004. [DOI] [PubMed] [Google Scholar]
- 19.Rahi JS, Sripathi S, Gilbert CE, et al. Childhood blindness in India: causes in 1318 blind school students in nine states. Eye. 1995;9:545–50. doi: 10.1038/eye.1995.137. [DOI] [PubMed] [Google Scholar]
- 20.Gilbert CE, Wood M, Waddel K, et al. Causes of childhood blindness in east Africa: results in 491 pupils attending 17 schools for the blind in Malawi, Kenya and Uganda. Ophthalmic Epidemiol. 1995;2:77–84. doi: 10.3109/09286589509057086. [DOI] [PubMed] [Google Scholar]
- 21.Gilbert C, Foster A. Childhood blindness in the context of vision 20-20 – The right to sight. Bull World Health Organ. 2001;79:227–32. [PMC free article] [PubMed] [Google Scholar]
- 22.Rahi JS, Sripathi S, Gilbert CE, Foster A. Childhood blindness due to vitamin A deficiency in India: regional variations. Arch Dis Child. 1995;72:330–3. doi: 10.1136/adc.72.4.330. [DOI] [PMC free article] [PubMed] [Google Scholar]
- 23.Krishnaiah S, Subba Rao B, Lakshmi Narasamma K, Amit G. A survey of severe visual impairment in children attending schools for the blind in a coastal district of Andhra Pradesh in South India. Eye. 2012;26:1065–70. doi: 10.1038/eye.2012.88.. [DOI] [PMC free article] [PubMed] [Google Scholar]
- 24.Dandona R, Dandona L. Childhood blindness in India: a population based perspective. Br J Ophthalmol. 2003;87:263–5. doi: 10.1136/bjo.87.3.263. [DOI] [PMC free article] [PubMed] [Google Scholar]
- 25.Dorairaj SK, Bandrakalli P, Shetty C, et al. Childhood Blindness in a rural population in Southern India: Prevalence and eitiology. Ophthalmic Epidemiol. 2008;15:176–82. doi: 10.1080/09286580801977668. [DOI] [PubMed] [Google Scholar]
- 26.Khandekar R, Kishore H, Mansu RM, et al. The status of childhood blindness and functional low vision in the Eastern Mediterranean region in 2012. Middle East Afr J Ophthalmol. 2014;21:336–43. doi: 10.4103/0974-9233.142273. [DOI] [PMC free article] [PubMed] [Google Scholar]
- 27.Limburg H, Gilbert C, Hon DN, et al. Prevalence and causes of blindness in children in Vietnam. Ophthalmology. 2012;119:355–61. doi: 10.1016/j.ophtha.2011.07.037. [DOI] [PubMed] [Google Scholar]
- 28.Patel DK, Tajunisah I, Gilbert C, et al. Childhood blindness and severe visual impairment in Malaysia: a nationwide study. Eye. 2011;25:436–42. doi: 10.1038/eye.2011.19. [DOI] [PMC free article] [PubMed] [Google Scholar]
- 29.Adhikari S, Shrestha MK, Adhikari K, et al. Causes of visual impairment and blindness in children in three ecological regions of Nepal: Nepal Pediatric Ocular Diseases Study. Clin Ophthalmol. 2015;9:1543–7. doi: 10.2147/OPTH.S89431. [DOI] [PMC free article] [PubMed] [Google Scholar]
- 30.Kello AB, Gilbert C. Causes of severe visual impairment and blindness in schools for the blind in Ethiopia. Br J Ophthalmol. 2003;87:526–30. doi: 10.1136/bjo.87.5.526. [DOI] [PMC free article] [PubMed] [Google Scholar]
- 31.Demissie BS, Solomon AW. Magnitude and causes of childhood blindness and severe visual impairment in Sekoru District, Southwest Ethiopia: a survey using the key informant method. Trans R Soc Trop Med Hyg. 2011;105:507–11. doi: 10.1016/j.trstmh.2011.04.007. [DOI] [PubMed] [Google Scholar]
- 32.Gudlavalleti VSM. Magnitude and Temporal Trends in Avoidable Blindness in Children (ABC) in India. Indian J Pediatr. 2017;84:924–9. doi: 10.1007/s12098-017-2405-2.. [DOI] [PubMed] [Google Scholar]
- 33.Murthy GVS, Gupta SK, Ellwein LB, Mun˜oz SR, Pokharel GP, Sanga L, Bachani D. Refractive error in children in an urban population in New Delhi. Invest Ophthalmol Vis Sci. 2002;43:623–31. [PubMed] [Google Scholar]
- 34.Dandona R, Dandona L, Srinivas M, Sahare P, Narsaiah S, Mun˜oz SR, Pokharel GP, Ellwein LB. Refractive Error in Children in a Rural Population in India. Invest Ophthalmol Vis Sci. 2002;43:615–22. [PubMed] [Google Scholar]
- 35.npcb.nic.in. Accessed on 6 Sept 2016.
- 36.Khan SA. Setting up low vision services in the developing world. Comm Eye Health. 2004;17:17–20. [Google Scholar]