

Abstract
Acute liver failure is a devastating consequence of hepatotoxic liver injury that can lead to the development of hepatic encephalopathy. There is no consensus on the best model to represent these syndromes in mice, and therefore the aim of this study was to classify hepatic and neurological consequences of azoxymethane- and thioacetamide-induced liver injury. Azoxymethane-treated mice were euthanized at time points representing absence of minor and significant stages of neurological decline. Thioacetamide-treated mice had tissue collected at up to 3 days following daily injections. Liver histology, serum chemistry, bile acids, and cytokine levels were measured. Reflexes, grip strength measurement, and ataxia were calculated for all groups. Brain ammonia, bile acid levels, cerebral edema, and neuroinflammation were measured. Finally, in vitro and in vivo assessments of blood–brain barrier function were performed. Serum transaminases and liver histology demonstrate that both models generated hepatotoxic liver injury. Serum proinflammatory cytokine levels were significantly elevated in both models. Azoxymethane-treated mice had progressive neurological deficits, while thioacetamide-treated mice had inconsistent neurological deficits. Bile acids and cerebral edema were increased to a higher degree in azoxymethane-treated mice, while cerebral ammonia and neuroinflammation were greater in thioacetamide-treated mice. Blood–brain barrier permeability exists in both models but was likely not due to direct toxicity of azoxymethane or thioacetamide on brain endothelial cells. In conclusion, both models generate acute liver injury and hepatic encephalopathy, but the requirement of a single injection and the more consistent neurological decline make azoxymethane treatment a better model for acute liver failure with hepatic encephalopathy.
Key words: Drug-induced liver injury, Animal models of hepatic injury and repair
INTRODUCTION
Acute liver failure is a consequence of a rapid hepatic insult that leads to a loss of liver function and various hepatic and extrahepatic complications. One significant and difficult to manage complication from acute liver failure is the development of neurological complications termed hepatic encephalopathy. Hepatic encephalopathy is defined as brain dysfunction caused by liver insufficiency or portosystemic shunting that can manifest as a wide array of neurological abnormalities, ranging from subclinical alterations to coma1. Mortality is increased in patients with acute liver failure with hepatic encephalopathy due to the development of cerebral edema and subsequent brain herniation that occurs in over 20% of patients2. In order to develop novel therapeutic approaches for the management of hepatic encephalopathy resulting from acute liver failure, appropriate animal models that mimic clinical aspects of this syndrome are necessary. While animal models do exist for hepatic encephalopathy, there is not a definitive model accepted for use in mice to generate toxin-induced acute liver failure with hepatic encephalopathy.
Mouse models of acute liver failure and hepatic encephalopathy need to produce morbidity from acute liver failure, have reproducibility and reversibility of pathology, have a sufficient therapeutic window, and develop progressive hepatic encephalopathy3. Hepatic encephalopathy has four defined stages of neurological decline based on the West-Haven criteria. Grade 0 represents normal consciousness, intellect, and behavior; grade 1 patients present with a mild lack of awareness and a shortened attention span; grade 2 is characterized by lethargy and minimal disorientation; grade 3 is classified by somnolence and lack of awareness; and grade 4 is characterized by coma. While many of these clinical characteristics are not easily examined in mice, measures of murine reflexes and neuromuscular impairment can be assessed to show similar disease progression compared to the West-Haven criteria4,5. Besides these neurobehavioral changes, elevation of ammonia, cerebral edema, and neuroinflammation should occur, as these are present during hepatic encephalopathy due to acute liver failure6,7.
Acute liver failure with hepatic encephalopathy predominantly occurs in Western Europe and the US as a result of acetaminophen toxicity, with transplant-free survival approaching 70%8,9. However, acetaminophen toxicity in mice leads to a rapid and significant liver injury that peaks at 12 h when administered at 300 mg/kg, followed by hepatic regeneration that can fully repair the liver at 72 h10. With the rapid resolution of liver impairment, these mice fail to develop significant, consistent, and reproducible symptoms of overt hepatic encephalopathy, making this model inappropriate for the study of hepatic encephalopathy. Other models of acute liver failure with hepatic encephalopathy are needed and have been suggested for use by the International Society for Hepatic Encephalopathy and Nitrogen Metabolism, including the azoxymethane (AOM) model in mice and the thioacetamide (TAA) model in rats11. However, some concerns have been raised with the AOM model, as it is thought to generate direct extrahepatic toxicity, primarily on brain endothelial cells12. Because of this, the TAA model validated in rats has been modified and implemented in mice and has now been published as an alternative model of hepatic encephalopathy in various studies13–16.
The overall goal of this report was to compare and characterize the AOM and TAA models of acute liver failure and hepatic encephalopathy in mice using published methodology. This will be assessed through a biochemical, behavioral, and physiological investigation into both models to assess their strengths and weaknesses in modeling acute liver failure with hepatic encephalopathy.
MATERIALS AND METHODS
Materials
Hematoxylin QS was purchased from Vector Laboratories (Burlingame, CA, USA). Eosin Y was purchased from MilliporeSigma (St. Louis, MO, USA). The Ammonia Assay Kit utilized in analyzing cortical and serum ammonia levels was purchased from MilliporeSigma. Antibodies against ionized calcium-binding adapter molecule 1 (IBA1) were purchased from Wako Chemicals USA (Richmond, VA, USA). ELISA assay kits for chemokine ligand 2 (CCL2), chemokine (C-X3-C motif) ligand 1 (CX3CL1), interleukin-6 (IL-6), and interleukin-1β (IL-1β) were purchased from R&D Systems (Minneapolis, MN, USA). All other chemicals, unless otherwise stated, were purchased from MilliporeSigma and were of the highest quality grade available.
Azoxymethane and Thioacetamide Mouse Models
The animal experiments performed in this study were approved by and complied with the Baylor Scott & White IACUC regulations on animal experiments (protocol #2011-052-R). All in vivo experiments were performed in 10- to 12-week-old male C57BL/6 mice obtained from Charles River Laboratories (Wilmington, MA, USA). Mice were given free access to water and standard rodent chow and housed in constant temperature, humidity, and 12-h light–dark cycling. Any mice that underwent 20% or greater weight loss were euthanized and removed from the study. Tissue from all mice was flash frozen using liquid nitrogen and collected at designated stages of neurological decline or at defined time points. Whole blood was collected directly from the heart via cardiac puncture and centrifuged to separate serum.
In order to cause AOM-induced hepatic injury, mice were injected via a single intraperitoneal (IP) injection of AOM at 100 mg/kg. The AOM stages of neurological decline were designated at the following time points after injection for this study: 4 h after AOM injection (prior to neurological symptoms), 12 h after AOM injection (minor neurological dysfunction with weakened reflexes and mild ataxia), and 16 h after AOM injection (major neurological dysfunction with significant ataxia and reflex deficits). For the remainder of this study, these groups will be referred to as AOM 4Hr, AOM 12Hr, and AOM 16Hr.
A single injection of TAA in mice does not generate significant hepatic encephalopathy, with previous publications reporting a requirement of 3 consecutive days of TAA injections as necessary to generate significant liver injury and increased brain edema17. In this study, TAA-induced liver injury was generated via a series of one to three consecutive injections of TAA at 100 mg/kg to classify both the liver injury and the development of hepatic encephalopathy with each consecutive dose of TAA. The TAA groups used for this study were designated as the following: 6Hr and 24Hr after first injection, 6Hr and 24Hr after 2 days of daily injections, and 6Hr and 24Hr after 3 days of daily injections. For the remainder of this study, these groups will be referred to as TAA 1st Inj 6Hr, TAA 1st Inj 24Hr, TAA 2nd Inj 6Hr, TAA 2nd Inj 24Hr, TAA 3rd Inj 6Hr, and TAA 3rd Inj 24Hr.
In each model, mice were placed on heating pads, maintained at 37°C to prevent hypothermia, and monitored frequently for signs of neurological decline. To reduce the effects of hypoglycemia and dehydration, the mice were given hydrogel and rodent chow on the cage floor for ease of access and were injected subcutaneously with 5% dextrose in 250 μl of saline when needed.
Measures of Neurological and Neuromuscular Deficits
Neurological function was assessed in all groups by measuring five reflexes and ataxia and scoring them on a scale of 0 (no reflex and severe ataxia) to 2 (intact reflex and no ataxia). The reflexes tested at each observation were pinna reflex, corneal reflex, tail flexion reflex, escape response reflex, and righting reflex. The resulting neurological score was defined as the summation of reflex scores with the degree of ataxia. In AOM-injected mice, 12 h following the injection (and then every 2 h after), body temperature, weight, and neurological assessments were recorded. Because of the TAA model not being fully validated with regard to neurological decline, several time points were selected to best assess the presence of neurological decline and overt hepatic encephalopathy. In TAA-injected mice, an hour before the specified time point, body temperature, weight, and neurological assessments were assessed. In both AOM- and TAA-treated groups, an investigator blind to the treatments observed the mice.
The gait of each group of mice was measured using the DigiGait Imaging System and analyzed using the DigiGait Imager and Analysis software created by Mouse Specifics Inc. (Framingham, MA). This imaging technology records images of the underside of the experimental mice walking on top of a motorized, transparent treadmill belt and generates digital paw prints. The paw prints were analyzed using software, which provides the ataxia coefficient for fore- and hindlimbs [calculated by (maximum stride length − minimum stride length)/average stride length]. Data were recorded in all groups until the mice were unable to walk effectively.
Grip strength was recorded using a Grip Strength Meter purchased from Columbus Instruments (Columbus, OH, USA). Mice were supported under their bodies and held by their tails until they had a firm grip on the grip strength bar with their forelimbs. The mice were then gradually pulled away from the bar until they lost their grip on the bar. This was repeated three times, and the values were averaged for each mouse at each observation point.
Liver Injury Assessment
Liver damage was determined by hematoxylin and eosin (H&E) staining according to previously published protocols5. Paraffin-embedded livers were cut into 4-μm sections and mounted onto positively charged slides (VWR, Radnor, PA, USA). Slides were deparaffinized and stained with Hematoxylin QS for 1 min followed by Eosin Y for 1 min, and then rinsed in 95% ethanol. The slides were then dipped into 100% ethanol and subsequently through two xylene washes. Coverslips were mounted onto the slides using CytoSeal XYL mounting media (ThermoFisher Scientific, Waltham, MA, USA). The slides were viewed and imaged using an Olympus BX40 microscope with an Olympus DP25 imaging system (Center Valley, PA, USA).
Liver function was assessed by measuring serum alanine aminotransferase (ALT), aspartate aminotransferase (AST), and total bilirubin (TBIL) levels using a Catalyst One serum chemistry analyzer from IDEXX Laboratories, Inc. (Westbrook, MA, USA). Serum ammonia levels were measured using an Ammonia Assay Kit (MilliporeSigma) following the kit’s instructions. Serum bile acids were measured using the SNAP Bile Acids Test Kit from IDEXX Laboratories according to manufacturer’s instructions. Prothrombin time and international normalized ratio (PT/INR) was assessed using a Coag-Sense PT/INR Monitoring System purchased from Coag-Sense, Inc. (Fremont, CA, USA) from whole blood collected via cardiac puncture.
ELISA Assays
Cortex tissue from all treatment groups was homogenized using a Miltenyi Biotec gentleMACS™ Dissociator (San Diego, CA, USA), and total protein was quantified using a ThermoFisher Pierce™ BCA Protein Assay kit (Waltham, MA, USA). Capture antibodies against IL-6, IL-1β, CCL2, or CX3CL1 were incubated overnight in 96-well plates. Each ELISA was performed according to the instructions provided from R&D Systems, and the total input protein for each sample was 100 μg or serum diluted 1:10. Absorbance was read using a SpectraMax® M5 plate reader from Molecular Devices (Sunnyvale, CA, USA). Data were reported as CCL2, IL-6, IL-1β, or CX3CL1 concentration per milligram of total lysate protein or per milliliter of serum.
Brain Biochemistry and Cerebral Edema
Homogenized cortex tissue was utilized in assessing tissue ammonia levels using an Ammonia Assay Kit (MilliporeSigma) following the kit’s instructions. All values were reported as mmol of ammonia normalized to grams of lysate protein. Bile acids were measured in cortex homogenates using the SNAP Bile Acids Test Kit from IDEXX Laboratories. Reported values are nmol of bile acid normalized to milligrams of lysate protein.
Cerebral edema was assessed in all mice using the wet to dry weight method described by Baskaya et al.18. Fresh cortical samples were placed into preweighed microcentrifuge tubes and the wet weight was recorded. Tubes were left open and placed into a drying oven at 70°C for 48 h before being weighed again for the dry weight. Water content was expressed as a percentage of brain weight; calculated as [(wet weight − dry weight)/wet weight] × 100%. Increased brain water content of 1%–2% in mice is indicative of cerebral edema19,20.
Immunofluorescence
Mice were transcardially perfused with ice-cold phosphate-buffered saline (PBS) followed by 4% paraformaldehyde (PFA). Whole brains were removed and placed into PFA for 24 h then placed in a 30% sucrose solution for cryoprotection. Brains were frozen using optimal cutting temperature compound (Fisher Scientific, Suwanee, GA, USA) and sectioned in 30-μm sections using a cryostat. Free-floating immunostaining was performed on brain sections using anti-IBA1 immunoreactivity to detect morphology and relative staining of microglia. Immunoreactivity was visualized using fluorescent secondary antibodies labeled with Cy3 and counterstained with ProLong® Gold AntiFade Reagent containing 4′,6-diamidino-2-phenylindole (DAPI). Slides were viewed and imaged using a Leica Microsystems TCS SP5-X inverted confocal microscope (Buffalo Grove, IL, USA). Z-stack images of IBA1+ microglia were taken and compiled as previously described21. Quantification of IBA1 field staining was performed by converting images to grayscale, inverting their color, and quantifying the number of IBA1+ pixels to total pixel count as a measure of percent area using ImageJ software (National Institutes of Health, Bethesda, MD, USA).
Blood–Brain Barrier Permeability
Mice were administered 100 μl of Evans blue dye (25 mg/ml) at 18 h after AOM injection, at the second TAA injection at 24 h, or at the third TAA injection at 6 h. Evans blue was administered via retro-orbital injection under isofluorane anesthesia, after which the mice were allowed to recover for 20 min, while the dye circulated in their system before tissue was collected. Mice were euthanized and then perfused transcardially with 50 ml of cold PBS. Whole brains were collected, and cerebella and brainstems were removed before homogenization using a glass homogenizer and 2 ml of 50% (w/v) trichloroacetic acid. The resulting homogenates were collected in a 15-ml centrifuge tube, spun down at 1,000 × g for 5 min and then plated in a 96-well plate, and absorbance was read using a SpectraMax® M5 plate reader from Molecular Devices.
An in vitro model of the blood–brain barrier (BBB) containing brain endothelial cells, primary astrocytes, and pericytes was used. Mouse pericytes were purchased from iXCells Biotechnologies (San Diego, CA, USA). Mouse brain endothelial cell line 3 (bEnd.3) cells were purchased from the American Type Culture Collection (Manassas, VA, USA). Primary astrocytes were isolated from P3 C57BL/6 mouse pups. Mice were decapitated, and whole brains were removed, the cortex of these brains were isolated, and meninges and dura were removed. The cells were pelleted by centrifugation at 1,400 × g, resuspended in media, and plated on a 182-cm2 flask purchased from Santa Cruz Biotechnology. Once the cells grew to confluency, the astrocytes were isolated via a 2-h shake at 250 rpm and 37°C until the microglia were lifted off the flask. This left an astrocyte-rich cell layer attached to the bottom of the 182-cm2 flask.
The BBB was modeled with these three cell lines by plating astrocytes on the lower surface of a Transwell permeable membrane insert. Once the astrocytes were adherent, bEnd.3 cells were seeded to the upper surface and allowed to grow to confluence. In the meantime, mouse pericytes were seeded in a 24-well plate prior to the placing of the bEnd.3/astrocyte-containing Transwell insert into the well.
This coculture system was treated by adding AOM or TAA (both at 10 μg/ml), or recombinant IL-1β (10 ng/ml) as a positive control to the Transwell for 24 h22. Media were exchanged for a clear phenol red-free media, and then 10-kDa fluorescein isothiocyanate (FITC)–dextran (2 mg/ml) was added to the top of the well for 1 h at 37°C. The fluorescence in the bottom and top of the well was read using a SpectraMax® M5 plate reader. Fluorescence (excitation: 494 nm; emission: 520 nm) was read in the upper and lower chambers, and the permeability coefficient was determined using the following formula23: P dextran = (RFUlower/RFUupper)(V)(1/t)(1/A), where RFU is the relative fluorescence units in the upper and lower wells, V is the volume of the bottom well, t is the time that the FITC–dextran was allowed to diffuse, and A is the total surface area of the monolayer (cm2). Permeability coefficients were normalized by setting basal cell monolayers to a value of 1 to minimize variability between trials.
Statistical Analyses
All statistical analyses were performed using GraphPad Prism software (La Jolla, CA), and the results were expressed as mean ± SEM. For data passing normality tests, significance was established using the Student’s t-test when differences between two groups were analyzed and analysis of variance when differences between three or more groups were compared, followed by the appropriate post hoc test. If tests for normality failed, two groups were compared with a Mann–Whitney U-test or a Kruskal–Wallis ranked analysis when more than two groups were analyzed. Differences were considered significant for values of p < 0.05.
RESULTS
AOM or TAA Treatments Generate Severe Hepatotoxic Liver Injury
Initially, the AOM and TAA models were validated to generate progressive acute liver injury resulting in decreased hepatic function over time. H&E staining in livers from mice treated with vehicle, AOM, or TAA (Fig. 1) was performed to confirm acute liver injury in both hepatotoxin models. Indeed, as the AOM-treated mice progressed through their time course, hepatic damage consistently increased with microvesicular steatosis present in AOM 4Hr mice, and hepatocyte necrosis, dilation of hepatic sinusoids, and hemorrhage were present in the AOM 12Hr and AOM 16Hr groups (Fig. 1A). H&E staining in livers from the TAA-injected mice determined that these mice have progressive liver injury that increases with duration and number of injections. Hepatocyte necrosis is observed following the first TAA injection with widespread necrosis, hepatocyte ballooning, immune cell infiltration, and hemorrhage occurring following the second TAA injection (Fig. 1B). These data support that both models progress toward acute liver failure and that these models share similarities and differences in their histopathological profiles.
Figure 1.

Liver injury is induced by azoxymethane (AOM) or thioacetamide (TAA) treatment. (A) Hematoxylin and eosin (H&E)-stained liver sections from vehicle and AOM-treated mice throughout their time course. (B) H&E-stained liver sections from vehicle and TAA-treated mice throughout their time course.
In order to validate the histochemical findings in AOM- and TAA-treated mice, we performed serum analyses including ALT, AST, TBIL, ammonia, and bile acid concentration measurement (Table 1). In AOM- and TAA-treated mice, there were significant elevations in ALT and AST at the later stages of both models (Table 1). TBIL was slightly increased in both models with significant increases in the AOM 12Hr, AOM 16Hr, TAA 1st Inj 6Hr, and TAA 2nd Inj 24Hr groups (Table 1). Serum ammonia levels are significantly elevated in both mouse models, but the reported values are higher in TAA-treated mice compared to AOM-treated mice (Table 1). The TAA 2nd Inj 24Hr group and the AOM 16Hr group had the highest serum ammonia values, with a significantly higher value for the TAA 2nd Inj 24Hr group compared to the AOM 16Hr group (p = 0.0346). Serum bile acids are significantly elevated in all treatment groups, with the largest values reported in the AOM 16Hr and TAA 3rd Inj 6Hr groups (Table 1). PT/INR times were also calculated and are delayed compared to vehicle-treated mice in AOM 4Hr, AOM 12Hr, and AOM 16Hr mice with clotting times that were unable to be detected (Table 1). TAA-treated mice exhibited delayed but variable clotting times through the time course with no group having an undetectable PT/INR time (Table 1). These results validate the histological findings demonstrating increased liver pathology and decreased hepatic function throughout the time course of both AOM- and TAA-treated mice.
Table 1.
Serum Chemistry of Azoxymethane (AOM)- and Thioacetamide (TAA)-Treated Mice
| Treatment | ALT (U/L) | AST (U/L) | TBIL (mg/dl) | Serum Ammonia (μM) | Serum Bile Acids (μmol/L) | PT/INR (s) |
|---|---|---|---|---|---|---|
| AOM vehicle | 216.75 ± 45.50 | 31.25 ± 4.23 | 0.8 ± 0.26 | 31.65 ± 2.19 | 7 ± 2.08 | 11.55/0.93 ± 1 |
| AOM 4Hr | 299 ± 49.68 | 119.2 ± 16.94* | 2 ± 0.46 | 37.26 ± 0.47* | 20.67 ± 3.71* | 12.45/1.05 ± 0.5 |
| AOM 12Hr | 1,824.25 ± 175.75* | 205.5 ± 18.91* | 1.83 ± 0.33* | 33.22 ± 3.57 | 45.33 ± 8.11* | – |
| AOM 16Hr | 3,500 ± 500* | 201.5 ± 98.5* | 2.25 ± 0.45* | 47.98 ± 5.29* | 120 ± 20.21* | – |
| TAA vehicle | 216.75 ± 45.50 | 31.25 ± 4.23 | 0.8 ± 0.26 | 31.65 ± 2.19 | 9 ± 0.58 | 11.55/0.93 ± 0.18 |
| TAA 1st Inj 6Hr | 457.4 ± 40.74* | 100.2 ± 12.18* | 2.36 ± 0.45* | 59.76 ± 1.16* | 66.67 ± 8.33* | 11.6/0.95 ± 0.65 |
| TAA 1st Inj 24Hr | 750.75 ± 109.16* | 224.8 ± 104.81 | 2.44 ± 1.59 | 60.10 ± 1.49* | 66.67 ± 4.41* | 14.57/0.83 ± 0.38* |
| TAA 2nd Inj 6Hr | 2,290 ± 332.74* | 274.6 ± 31.18* | 1.63 ± 0.74 | 57.69 ± 1.65* | 96.67 ± 21.67* | 14.63/1.2 ± 0.61* |
| TAA 2nd Inj 24Hr | 2,656.8 ± 479.66* | 296.6 ± 73.43* | 3.06 ± 0.80* | 62.54 ± 0.80* | 90 ± 12.58* | 19.38/1.7 ± 1.61* |
| TAA 3rd Inj 6Hr | 4,457 ± 1108.17* | 342.5 ± 70.00* | 2.48 ± 0.97 | 43.77 ± 0.83* | 115 ± 16.07* | 20.18/1.7 ± 3.35* |
| TAA 3rd Inj 24Hr | 5,278.5 ± 317.91* | 339.25 ± 24.05* | 0.96 ± 0.45 | 38.24 ± 0.86* | 71.67 ± 13.02* | 13.2/1.33 ± 3.40 |
Data for all values are reported as mean ± standard error of the mean (SEM).
p < 0.05 compared to vehicle-treated mice.
Serum Cytokine Levels Are Elevated in AOM- and TAA-Treated Mice
The detection of circulating inflammatory markers in the serum is a hallmark of liver injury and can contribute to hepatic encephalopathy progression7,24. The concentration of serum CCL2 was elevated in comparison to vehicle at every stage of the AOM and TAA time course with significance noted in every treatment group (Fig. 2A). IL-6 concentrations in serum from the AOM 12Hr, AOM 16Hr, TAA 1st Inj 6Hr, TAA 2nd Inj 6Hr, TAA 2nd Inj 24Hr, TAA 3rd Inj 6Hr, and TAA 3rd Inj 24Hr groups were significantly elevated compared to vehicle. However, AOM 12Hr and AOM 16Hr had the highest elevations of this proinflammatory cytokine with over a 10-fold significant increase in AOM 16Hr compared to TAA 3rd Inj 24Hr, which was the highest TAA group (p = 0.0289) (Fig. 2B). Serum IL-1β concentrations follow a similar trend of steadily increasing in AOM-treated mice, though levels were significantly elevated only in the AOM 12Hr and AOM 16Hr groups (Fig. 2C). In TAA-treated mice, a significant increase in the concentration of IL-1β was not observed until the third injection of TAA, though values observed were significantly lower than those in the AOM-treated mice, as TAA 3rd Inj 6Hr was significantly lower than AOM 16Hr (p = 0.0112) (Fig. 2C).
Figure 2.

AOM and TAA treatments led to increased serum cytokine levels. (A) Chemokine ligand 2 (CCL2) concentrations in serum obtained from the whole blood of vehicle-, AOM- (left), and TAA-injected (right) mice during their time course. (B) Interleukin-6 (IL-6) concentrations in serum obtained from the whole blood of vehicle-, AOM- (left), and TAA-injected (right) mice during their time course. (C) IL-1β concentrations in serum obtained from the whole blood of vehicle-, AOM- (left), and TAA-injected (right) mice during their time course. Data are expressed as average ± SEM with an n = 3 or higher for all groups for the ELISA analyses. *p < 0.05 with respect to vehicle-treated mice.
AOM or TAA Treatment Leads to Behavioral and Cognitive Deficits
Behavioral and cognitive deficits are two fundamental aspects of hepatic encephalopathy that contribute to the neurological burden of the disease. In all groups, reflexes and ataxia were assessed postinjection, with observations performed throughout the progression of these models. In AOM-treated mice, there was a steady decline in neurological function in comparison to vehicle-treated mice, with the greatest decline evident in AOM 16Hr (Fig. 3A). TAA-treated mice did not present with significant neurological decline until the TAA 3rd Inj 24Hr group (Fig. 3A). Grip strength force in AOM-treated mice demonstrates a significant decrease in the AOM 4Hr, AOM 12Hr, and AOM 16Hr groups. TAA-injected mice had inconsistent grip strength, with a significant decrease shown in only the TAA 2nd Inj 24Hr and TAA 3rd Inj 6Hr groups (Fig. 3B). The ataxia coefficient measured using the DigiGait treadmill was only measured in the early stages of acute liver failure in both models. The presence of ataxia was increased in the AOM 4Hr and AOM 12Hr groups, demonstrating variability between maximum and minimum stride lengths (Fig. 3C). TAA-treated mice presented with variable ataxia coefficient measurements with a significant increase in ataxia observed in the TAA 1st Inj 6Hr and TAA 1st Inj 24Hr groups (Fig. 3C).
Figure 3.

Cognitive and neuromuscular deficits exist in AOM- and TAA-treated mice. (A) Neurological scoring during the time course of AOM- (left) and TAA-injected (right) mice. Neurological score is calculated by reflex and ataxia assessments, where a neurological score of 12 indicates normal function with the score decreasing as neurological impairment occurs. (B) Grip strength measurement calculated as force of the mice’s forelimbs (in Newtons, N) for AOM- (left) and TAA-treated (right) mice during their time course. (C) The ataxia coefficient obtained from the DigiGait Analysis Imaging software representing step-to-step variability of the respective limb in AOM- (left) and TAA-treated (right) mice during their time course. Data are expressed as average ± SEM with an n = 4 or higher for all groups for neurological score and behavioral analyses. *p < 0.05 with respect to vehicle-treated mice.
Alterations of Brain Biochemistry and Increased Cerebral Edema in AOM- and TAA-Treated Mice
Outside of neurological changes, hepatic encephalopathy is characterized by increased concentrations of ammonia and bile acids in the brain as well as by the presence of cerebral edema25–27. AOM-treated mice had a small yet significant increase in cortical ammonia concentrations in the AOM 12Hr and AOM 16Hr groups compared to vehicle-treated mice (Fig. 4A). In the TAA-treated mice, there was a large increase in cortical ammonia concentrations after the first injection of TAA, and levels remained significantly elevated through the entire TAA time course (Fig. 4A). This increase in cortical ammonia concentrations was significantly increased in the TAA 1st Inj 6Hr, TAA 2nd Inj 6Hr, TAA 2nd Inj 24Hr, and TAA 3rd Inj 6Hr groups compared to the AOM 12Hr group, the AOM group with the highest cortical ammonia values (p = 0.0017, p = 0.0176, p = 0.0331, and p = 0.0037, respectively). Cortical bile acids steadily increased through the time course in AOM-treated mice with significant increases in AOM 16Hr mice (Fig. 4B). TAA-treated mice did not have a significant increase in cortical bile acids at any of the time points measured (Fig. 4B). AOM-treated mice presented with a significant increase in cerebral cortex water content, a measure of edema, with increases throughout the AOM time course in comparison to vehicle (Fig. 4C). TAA-treated mice had an increase in cerebral edema only reaching significance in the TAA 3rd Inj 24Hr group (Fig. 4C).
Figure 4.

Cerebral ammonia, bile acids, and edema increase during AOM- and TAA-induced liver injury. (A) Cortical ammonia concentrations during the time course of AOM- (left) and TAA-treated (right) mice measured in mmol per gram of total protein. (B) Cortical bile acid concentrations measured during the time course of AOM- (left) and TAA-treated (right) mice measured in nmol per milligram protein. (C) Percentage of brain water content reported during the time course of AOM- (left) and TAA-treated (right) mice. Data are expressed as average ± SEM with an n = 3 or higher reported for all groups for each indicated assay. *p < 0.05 with respect to vehicle-treated mice.
Microglia Activation Occurs in AOM- and TAA-Treated Mice
In order to see if these changes in behavior and brain biochemistry correlated with neuroinflammation, the morphology and proliferation of microglia were assessed using IBA1 staining. Vehicle, AOM 4Hr, and AOM 12Hr groups had microglia displaying the quiescent phenotype with rounded cell bodies and extended processes (Fig. 5A). In the AOM 16Hr group, microglia displayed activation with a larger cell body with shorter processes, demonstrating an activation of these immune cells as the disease progressed (Fig. 5A). Microglia from TAA-injected mice were observed to display the activated phenotype in the TAA 2nd Inj 6Hr, TAA 2nd Inj 24Hr, and TAA 3rd Inj 6Hr groups (Fig. 5B). Quantification of IBA1 field staining from AOM-treated mice demonstrated that these mice display an increase in the percentage of IBA1 staining per field in the AOM 12Hr and AOM 16Hr groups (Fig. 5A and C). TAA-injected mice varied in the amount of microglia proliferation, with a significant increase observed in the TAA 2nd Inj 24Hr and TAA 3rd Inj 6Hr groups (Fig. 5B and C).
Figure 5.

AOM and TAA treatments led to activation of microglia. (A) Cortical ionized calcium-binding adapter molecule 1 (IBA1; red) immunofluorescence images in mice treated with vehicle or AOM during their time course that were stained with 4′,6-diamidino-2-phenylindole (DAPI) (blue). Z-stack images of individual microglia (top) and field images (bottom) are provided. (B) Cortical IBA1 (red) immunofluorescence images in mice treated with vehicle or TAA during their time course that were stained with DAPI (blue). Z-stack images of individual microglia (top) and field images (bottom) are provided. (C) Quantification of IBA1 field immunofluorescence in the cortex of vehicle-, AOM-, and TAA-treated mice. Data are expressed as average ±SEM. *p < 0.05 with respect to vehicle-treated mice.
Microglia activation can lead to the production of proinflammatory factors or the suppression of anti-inflammatory mediators. Previously, we demonstrated that CCL2 promotes microglia activation, while CX3CL1 acts to repress microglia activation during AOM-induced hepatic encephalopathy28,29. Therefore, tight control of these chemokines is important in controlling the activation of microglia. The expression of cortical CCL2 is significantly increased in AOM-treated mice in the AOM 12Hr and AOM 16Hr groups (Fig. 6A). TAA-treated mice also show a significant upregulation of cortical CCL2 levels in all groups following the second injection with significantly higher concentrations in the TAA 2nd Inj 6Hr compared to the AOM 16Hr group, the AOM group with highest cortical CCL2 concentrations (p = 0.0419) (Fig. 6A). Cortical CX3CL1 concentrations in AOM-treated mice were significantly lower in the AOM 12Hr and AOM 16Hr groups in comparison to vehicle-treated mice (Fig. 6B). TAA-treated mice had significantly lower CX3CL1 expression throughout the progression of the disease, with the greatest decrease in the TAA 3rd Inj 6Hr and TAA 3rd Inj 24Hr groups (Fig. 6B). Together, these data demonstrate that the signal to activate microglia is upregulated while the signal that represses microglia activation is downregulated in both experimental paradigms.
Figure 6.
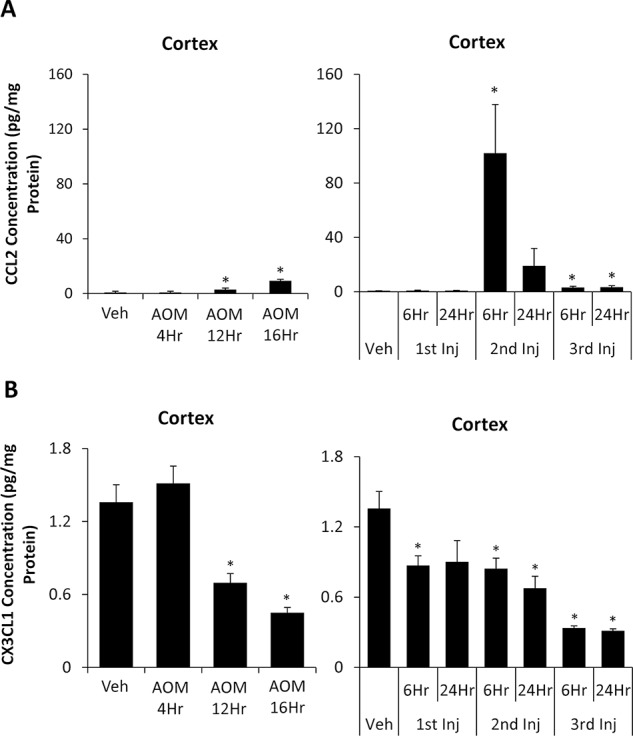
Cortical CCL2 and chemokine (C-X3-C motif) ligand 1 (CX3CL1) are dysregulated during AOM- and TAA-induced liver injury. (A) CCL2 concentrations in cortex homogenates normalized to total protein concentrations from vehicle-, AOM- (left), and TAA-injected (right) mice. (B) CX3CL1 concentrations in cortex homogenates normalized to total protein concentrations from vehicle-, AOM- (left), and TAA-injected (right) mice. Data are expressed as average ± SEM with an n = 3 or higher for all groups for ELISA assays. *p < 0.05 with respect to vehicle-treated mice.
BBB Permeability Occurs in AOM- and TAA-Treated Mice
Lastly, the function of the BBB needed to be assessed in both models to ensure that these toxins do not directly generate neurotoxicity. An appropriate model for hepatic encephalopathy will have BBB permeability but not until later stages of the disease when the combined efforts of liver inflammation, increased ammonia, bile acids, and neuroinflammation have the opportunity to exert effects on the neurovascular unit. Initially, BBB permeability was assessed in vivo in the vehicle, AOM 16Hr, TAA 2nd Inj 24Hr, and TAA 3rd Inj 6Hr groups by Evans blue extravasation in brain tissue following retro-orbital injection. Qualitatively, the amount of Evans blue is increased in brains from the AOM 16Hr, TAA 2nd Inj 24Hr, and TAA 3rd Inj 6Hr groups, but not the vehicle-treated brain (Fig. 7A). These brains were homogenized, and Evans blue dye concentration was quantified, which determined that there was a significant and similar increase in Evans blue content in all groups compared to vehicle (Fig. 7B). To ensure that these findings were due to BBB permeability caused by toxin-induced liver injury and not from direct drug toxicity on brain endothelial cells, an in vitro model of the BBB was utilized that included brain endothelial cells, astrocytes, and pericytes (Fig. 7C). Treatment of these cells with AOM or TAA modestly increased permeability of the endothelial cell layer as measured by FITC–dextran transmembrane diffusion (Fig. 7D). However, the magnitude of effect for either hepatotoxin was significantly lower than the IL-1β+ control, suggesting minimal direct toxicity of these hepatotoxins on brain endothelial cells (Fig. 7D).
Figure 7.

Blood–brain barrier (BBB) permeability is induced following AOM and TAA treatments. (A) Representative images of whole brains obtained from vehicle-, AOM 16Hr-, TAA 2nd Inj 24Hr-, and TAA 3rd Inj 6Hr-injected mice after Evans blue retro-orbital injection. (B) Quantification of Evans blue dye absorption from vehicle-, AOM 16Hr-, TAA 2nd Inj 24Hr-, and TAA 3rd Inj 6Hr-injected mice. (C) Figure demonstrating in vitro coculture model utilized for these studies. The red line indicates the Transwell insert, and the blue line indicates the well of the 24-well plate. All treatments were applied only to the top of the Transwell insert as shown by the arrow in the figure. (D) In vitro permeability measured by 10-kDa fluorescein isothiocyanate (FITC)–dextran diffusion in basal, AOM-, TAA-, or IL-1β-treated bEnd.3 cells. Data are expressed as average ± SEM with the an n = 3 or higher for all groups for each analysis. *p < 0.05 with respect to vehicle-treated mice or basal bEnd.3 cells, #p < 0.05 compared to AOM-treated bEnd.3 cells.
DISCUSSION
The major aims of this study were to classify the biochemical, behavioral, and molecular characteristics of the AOM and TAA models of acute liver failure and hepatic encephalopathy. The data presented within demonstrate that both the AOM and TAA models generate significant liver damage that correlates with increased serum cytokine levels. Both of these models generate neurological decline, motor deficits, and neuroinflammation, although the AOM model has consistent and gradual neurological decline and requires only a single dose unlike the TAA model that has inconsistent neurological dysfunction and takes two or three injections to generate overt hepatic encephalopathy. Furthermore, we demonstrate that both models generate an increase in BBB permeability, though this was likely not a result of direct toxicity of AOM or TAA on brain endothelial cells as demonstrated through in vitro studies.
Models of acute liver failure with hepatic encephalopathy have been compared and contrasted in various species and approaches by the International Society for Hepatic Encephalopathy and Nitrogen Metabolism11. Butterworth et al. describe surgical and hepatotoxin models of acute liver failure with hepatic encephalopathy and report that the anhepatic models are not validated in mice11. However, the authors do describe that the only validated hepatotoxin model in mice is the AOM model11. Other researchers have compared AOM to other models of acute liver failure and hepatic encephalopathy in mice such as the cotreatment with galactosamine and tumor necrosis factor-α, which had poorer reproducibility and a narrower therapeutic window compared to AOM treatment30. That being said, a modified TAA treatment regimen has been developed for use in mice as a model of acute liver failure with hepatic encephalopathy, which up to this point had not been comprehensively compared to the AOM model with regard to liver pathology, inflammation, neuromuscular function, and neurological decline13. Neuroinflammation has also become an increasingly important area to investigate as microglia activation has been observed during acute liver failure in a patient with hepatic encephalopathy, and therefore this study also examined this aspect of pathology7. The current study investigated the AOM and TAA models as the best possible models of toxin-induced acute liver failure and hepatic encephalopathy in mice, though new models may be later developed that better represent these syndromes.
The AOM model was first characterized as a model of hepatotoxin-induced liver failure and hepatic encephalopathy by Matkowskyj et al., and the authors found that following AOM administration, serum ALT and ammonia were elevated, and this correlated with neurological decline that culminated in coma in approximately 36 h31. A more detailed analysis of neurological dysfunction in this model was published by Bélanger et al., which determined that there was cerebral edema, elevated brain ammonia, and dysregulated amino acid levels in the cortex of normothermic mice and that a majority of these effects were not present in AOM-treated mice that were hypothermic with a 35°C body temperature32. As hypothermia occurs naturally during AOM-induced liver injury, controlling body temperature to ensure consistent progression of hepatic encephalopathy is critical in this model, which was accomplished in the present study through placing heating pads underneath the mouse cages and monitoring the temperatures of the mice. The current study found that AOM treatment generates microvesicular steatosis, dilation of hepatic sinusoids, and hepatocyte necrosis in addition to elevations of serum transaminases and bile acids with the largest increases when mice progressed toward coma. Serum ammonia levels also increase throughout the progression of this model, though the values reported in this study were lower than what has previously been reported, which we believe may be a result of the instrument and assay technique that were used. In addition to this, there were elevations of CCL2, IL-6, and IL-1β in the serum, demonstrating that this model generates substantial systemic inflammation. AOM treatment generated significant neurological deficits as shown by delayed reflexes, a loss of grip strength, and increased ataxia. In addition, this model shows elevations of cortical ammonia, cortical bile acids, cerebral edema, and neuroinflammation. The combination of these elements demonstrates that the AOM model generates all relevant criteria to serve as a model of acute liver failure and hepatic encephalopathy. Some of the downfalls of this model are that it leads to hypothermia and hypoglycemia, and these must be controlled to reduce variability between experiments. In addition, the levels of cortical ammonia and measures of cortex CCL2 are not elevated to the same magnitude as observed in TAA-treated mice, indicating that the AOM model may not be the most appropriate for studying hyperammonemia or CCL2-induced neuroinflammation.
The TAA model was first validated as a model of acute liver failure with hepatic encephalopathy using two injections of TAA, which lead to substantial hepatic necrosis, impaired liver function, neurological decline, increased brain ammonia, and cerebral edema13. Unfortunately, this model has a relatively high rate of mortality, as close to 40% of the mice do not survive following the second injection13. In the TAA model, we found that a minimum of two injections were necessary to generate significant hepatic dysfunction and hepatic encephalopathy. The livers from TAA-treated mice have a large degree of hepatocyte necrosis and hemorrhage similar to those from the AOM model. However, in livers from TAA-treated mice, hepatocyte ballooning and infiltration of immune cells were observed, and these aspects of pathology were not present during AOM-induced liver injury. Associated with this progressive liver injury were elevations of transaminases and bile acids following the second TAA injection. Similar to what was observed in AOM-treated mice, serum ammonia levels were significantly elevated following the second TAA injection, though the values reported were lower than anticipated during a model of acute liver failure. Elevations of serum CCL2 were observed, and IL-6 and IL-1β were also upregulated following TAA injection, though the levels of IL-6 and IL-1β were significantly lower than what was observed in AOM-treated mice. Significant neurological decline in the TAA model was not observed until after the third TAA injection, and grip strength and ataxia occurred at different time points following TAA injection. Cerebral edema and elevated brain ammonia were present in TAA-treated mice, though bile acids were not increased in the cortex of TAA-treated mice. Finally, microglia activation was increased and correlated to increased CCL2 expression and decreased CX3CL1 expression in TAA-treated mice following the second TAA injection. Overall, these results demonstrate that the TAA model generates significant liver damage, elevations of ammonia, and neuroinflammation. However, cerebral bile acids are not elevated, and neurological decline is inconsistent. Therefore, it appears that the TAA model generates aspects of hepatic encephalopathy, though with less consistency than the AOM model. The TAA model does generate a greater increase in brain ammonia, indicating that this model would be better suited than the AOM model for studying hyperammonemia.
Liver injury leads to systemic inflammation and an increase in bile acids, ammonia, and other metabolites that can contribute to opening of the BBB. This appears to be dependent on the severity of the hepatic injury, as in liver injury models that do not generate hepatic failure, such as ischemia–reperfusion injury, BBB permeability is not observed33. In a more severe model of liver injury involving 10% ethanol feeding for 3 weeks followed by injection of 300 mg/kg acetaminophen, there was an increase in BBB permeability as assessed via increased Evans blue dye in the brain34. These authors also report that transplantation of bone marrow cells reduced BBB permeability in alcohol diet-fed mice injected with acetaminophen, which they conclude is due to reduced tumor necrosis factor-α production, supporting the role of inflammation in opening of the BBB34. Increased permeability of the BBB is a key feature of hepatic encephalopathy and is observed in 4-week bile duct ligated rats, where multiple brain regions, including the cortex, have increased penetrance to sodium fluorescein and FITC–dextran35. Similar findings have been made using the AOM model of acute liver failure and hepatic encephalopathy. Chastre et al. show that AOM alone does not lead to an opening of the BBB, but requires a coinjection of LPS36. It should be noted that the AOM mice in this study were euthanized much earlier than the current study with mice being sacrificed at 8.3 ± 0.5 h36. This could account for why AOM-induced permeability is observed at the 18-h time point, as more inflammation and liver injury occur as this model progresses. This finding at this time point is not unique, as our lab and other investigators have seen that AOM treatment leads to the opening of the BBB at later stages of neurological decline37,38. The TAA model of acute liver failure with hepatic encephalopathy does generate edema as assessed by MRI, though the specific mechanism of this has not been previously validated13. This report demonstrated that repeated injections of TAA at the 2-day and 3-day time points increased BBB permeability using Evans blue binding in brain tissue. Other investigators have studied BBB permeability in vitro using a two-model system containing brain endothelial cells and astrocytes and found that AOM, but not TAA, induced monolayer permeability12. This report expanded upon these studies by adding pericytes into this model and found that neither toxin induced extensive permeability due to direct toxicity, giving support that the liver injury and resulting inflammation work in concert to open the BBB.
The current study does highlight that there are many different parameters that are altered during acute liver failure and the development of hepatic encephalopathy. As both of these models do generate progressive hepatic encephalopathy, there are different parameters that mirror neurological decline, while others do not across both models. Therefore, it appears that brain water percentage, Evans blue binding, serum IL-6, serum IL-1β, cortical CX3CL1, and cortex IBA1 staining are reliable measures of neurological decline in both models. While other pathological characteristics are elevated, such as serum ammonia, cortical ammonia, and cortical bile acid levels to name a few, the values do not align with neurological decline in both groups. This gives support that in the case of these two models, increased systemic and brain inflammation work in concert with BBB permeability to induce hepatic encephalopathy, while ammonia plays a less important role. Whether these findings regarding ammonia are a result of a model-specific effect due to differential effects on liver injury and metabolism, or if ammonia does not directly contribute to neurological decline in these models, requires additional studies.
In conclusion, both models do generate significant liver injury, neurological decline, elevations of ammonia, cerebral edema, neuroinflammation, and BBB permeability. TAA is unique in that it has a greater increase in cerebral ammonia, while AOM generates more consistent neurological deficits and an increase in cortical bile acid content. These characteristics of AOM, combined with its single dose, better reproducibility, low mortality, and larger therapeutic window, demonstrates that this model is a better alternative than TAA in generating toxin-induced acute liver failure with hepatic encephalopathy in mice.
ACKNOWLEDGMENTS
This study was funded by an NIH R01 award (DK082435) and a VA Merit award (BX002638) from the United States Department of Veterans Affairs Biomedical Laboratory Research and Development Service to Dr. DeMorrow. This study was also funded by a VA Career Development award (BX003486) from the United States Department of Veterans Affairs Biomedical Laboratory Research and Development Service to Dr. McMillin. The authors would like to acknowledge Dr. Bo Wang for his assistance in assessing the H&E slides and Amy Wyatt for her technical expertise. This material is the result of work supported with resources and the use of facilities at the Central Texas Veterans Health Care System, Temple, Texas. The content is the responsibility of the author(s) alone and does not necessarily reflect the views or policies of the Department of Veterans Affairs or the US government.
Footnotes
The authors declare no conflicts of interests.
REFERENCES
- 1. American Association for the Study of Liver Diseases, European Association for the Study of the Liver. Hepatic encephalopathy in chronic liver disease: 2014 practice guideline by the European Association for the Study of the Liver and the American Association for the Study of Liver Diseases. J Hepatol. 2014;61(3):642–59. [DOI] [PubMed] [Google Scholar]
- 2. Oketani M, Ido A, Nakayama N, Takikawa Y, Naiki T, Yamagishi Y, Ichida T, Mochida S, Onishi S, Tsubouchi H. Intractable Hepato-Biliary Diseases Study Group of Japan. Etiology and prognosis of fulminant hepatitis and late-onset hepatic failure in Japan: Summary of the annual nationwide survey between 2004 and 2009. Hepatol Res. 2013;43(2):97–105. [DOI] [PubMed] [Google Scholar]
- 3. Terblanche J, Hickman R. Animal models of fulminant hepatic failure. Dig Dis Sci. 1991;36(6):770–4. [DOI] [PubMed] [Google Scholar]
- 4. McMillin M, Galindo C, Pae HY, Frampton G, Di Patre PL, Quinn M, Whittington E, DeMorrow S. Gli1 activation and protection against hepatic encephalopathy is suppressed by circulating transforming growth factor beta1 in mice. J Hepatol. 2014;61(6):1260–6. [DOI] [PMC free article] [PubMed] [Google Scholar]
- 5. McMillin M, Frampton G, Grant S, Khan S, Diocares J, Petrescu A, Wyatt A, Kain J, Jefferson B, DeMorrow S. Bile acid-mediated sphingosine-1-phosphate receptor 2 signaling promotes neuroinflammation during hepatic encephalopathy in mice. Front Cell Neurosci. 2017;11:191. [DOI] [PMC free article] [PubMed] [Google Scholar]
- 6. Butterworth RF. Pathogenesis of hepatic encephalopathy and brain edema in acute liver failure. J Clin Exp Hepatol. 2015;5(Suppl 1):S96–103. [DOI] [PMC free article] [PubMed] [Google Scholar]
- 7. Butterworth RF. Hepatic encephalopathy: A central neuroinflammatory disorder? Hepatology 2011;53(4):1372–6. [DOI] [PubMed] [Google Scholar]
- 8. Bernal W, Auzinger G, Dhawan A, Wendon J. Acute liver failure. Lancet 2010;376(9736):190–201. [DOI] [PubMed] [Google Scholar]
- 9. Bernal W, Wendon J. Acute liver failure. N Engl J Med. 2013;369(26):2525–34. [DOI] [PubMed] [Google Scholar]
- 10. Bhushan B, Walesky C, Manley M, Gallagher T, Borude P, Edwards G, Monga SP, Apte U. Pro-regenerative signaling after acetaminophen-induced acute liver injury in mice identified using a novel incremental dose model. Am J Pathol. 2014;184(11):3013–25. [DOI] [PMC free article] [PubMed] [Google Scholar]
- 11. Butterworth RF, Norenberg MD, Felipo V, Ferenci P, Albrecht J, Blei AT, Members of the ICoEMoHE. Experimental models of hepatic encephalopathy: ISHEN guidelines. Liver Int. 2009;29(6):783–8. [DOI] [PubMed] [Google Scholar]
- 12. Jayakumar AR, Ruiz-Cordero R, Tong XY, Norenberg MD. Brain edema in acute liver failure: Role of neurosteroids. Arch Biochem Biophys. 2013;536(2):171–5. [DOI] [PMC free article] [PubMed] [Google Scholar]
- 13. Gomides LF, Marques PE, Faleiros BE, Pereira RV, Amaral SS, Lage TR, Resende GH, Guidine PA, Foureaux G, Ribeiro FM, and others. Murine model to study brain, behavior and immunity during hepatic encephalopathy. World J Hepatol. 2014;6(4):243–50. [DOI] [PMC free article] [PubMed] [Google Scholar]
- 14. Avraham Y, Grigoriadis N, Poutahidis T, Vorobiev L, Magen I, Ilan Y, Mechoulam R, Berry E. Cannabidiol improves brain and liver function in a fulminant hepatic failure-induced model of hepatic encephalopathy in mice. Br J Pharmacol. 2011;162(7):1650–8. [DOI] [PMC free article] [PubMed] [Google Scholar]
- 15. Jayakumar AR, Bethea JR, Tong XY, Gomez J, Norenberg MD. NF-kappaB in the mechanism of brain edema in acute liver failure: Studies in transgenic mice. Neurobiol Dis. 2011;41(2):498–507. [DOI] [PMC free article] [PubMed] [Google Scholar]
- 16. Miranda AS, Rodrigues DH, Vieira LB, Lima CX, Rachid MA, Vidigal PV, Gomez MV, Reis HJ, Guatimosim C, Teixeira AL. A thioacetamide-induced hepatic encephalopathy model in C57BL/6 mice: A behavioral and neurochemical study. Arq Neuropsiquiatr. 2010;68(4):597–602. [DOI] [PubMed] [Google Scholar]
- 17. Jayakumar AR, Tong XY, Curtis KM, Ruiz-Cordero R, Abreu MT, Norenberg MD. Increased toll-like receptor 4 in cerebral endothelial cells contributes to the astrocyte swelling and brain edema in acute hepatic encephalopathy. J Neurochem. 2014;128(6):890–903. [DOI] [PMC free article] [PubMed] [Google Scholar]
- 18. Baskaya MK, Dogan A, Rao AM, Dempsey RJ. Neuroprotective effects of citicoline on brain edema and blood-brain barrier breakdown after traumatic brain injury. J Neurosurg. 2000;92(3):448–52. [DOI] [PubMed] [Google Scholar]
- 19. Cao C, Yu X, Liao Z, Zhu N, Huo H, Wang M, Ji G, She H, Luo Z, Yue S. Hypertonic saline reduces lipopolysaccharide-induced mouse brain edema through inhibiting aquaporin 4 expression. Crit Care 2012;16(5):R186. [DOI] [PMC free article] [PubMed] [Google Scholar]
- 20. Bemeur C, Vaquero J, Desjardins P, Butterworth RF. N-acetylcysteine attenuates cerebral complications of non-acetaminophen-induced acute liver failure in mice: Antioxidant and anti-inflammatory mechanisms. Metab Brain Dis. 2010;25(2):241–9. [DOI] [PubMed] [Google Scholar]
- 21. McMillin M, Frampton G, Tobin R, Dusio G, Smith J, Shin H, Newell-Rogers K, Grant S, DeMorrow S. TGR5 signaling reduces neuroinflammation during hepatic encephalopathy. J Neurochem. 2015;135(3):565–76. [DOI] [PMC free article] [PubMed] [Google Scholar]
- 22. Alluri H, Wilson RL, Anasooya Shaji C, Wiggins-Dohlvik K, Patel S, Liu Y, Peng X, Beeram MR, Davis ML, Huang JH, and others. Melatonin preserves blood-brain barrier integrity and permeability via matrix metalloproteinase-9 inhibition. PLoS One 2016;11(5):e0154427. [DOI] [PMC free article] [PubMed] [Google Scholar]
- 23. Yuan SY, Rigor RR. Methods for measuring permeability. In: Regulation of endothelial barrier function. San Rafael (CA): Morgan & Claypool Life Sciences; 2010. [PubMed] [Google Scholar]
- 24. Wright G, Shawcross D, Olde Damink SW, Jalan R. Brain cytokine flux in acute liver failure and its relationship with intracranial hypertension. Metab Brain Dis. 2007;22(3–4):375–88. [DOI] [PubMed] [Google Scholar]
- 25. Weiss N, Barbier Saint Hilaire P, Colsch B, Isnard F, Attala S, Schaefer A, Amador MD, Rudler M, Lamari F, Sedel F, and others. Cerebrospinal fluid metabolomics highlights dysregulation of energy metabolism in overt hepatic encephalopathy. J Hepatol. 2016;65(6):1120–30. [DOI] [PubMed] [Google Scholar]
- 26. Wijdicks EF, Nyberg SL. Propofol to control intracranial pressure in fulminant hepatic failure. Transplant Proc. 2002;34(4):1220–2. [DOI] [PubMed] [Google Scholar]
- 27. Bron B, Waldram R, Silk DB, Williams R. Serum, cerebrospinal fluid, and brain levels of bile acids in patients with fulminant hepatic failure. Gut 1977;18(9):692–6. [DOI] [PMC free article] [PubMed] [Google Scholar]
- 28. McMillin M, Frampton G, Thompson M, Galindo C, Standeford H, Whittington E, Alpini G, DeMorrow S. Neuronal CCL2 is upregulated during hepatic encephalopathy and contributes to microglia activation and neurological decline. J Neuroinflammation 2014;11:121. [DOI] [PMC free article] [PubMed] [Google Scholar]
- 29. McMillin M, Grant S, Frampton G, Andry S, Brown A, DeMorrow S. Fractalkine suppression during hepatic encephalopathy promotes neuroinflammation in mice. J Neuroinflammation 2016;13(1):198. [DOI] [PMC free article] [PubMed] [Google Scholar]
- 30. Baine AM, Hori T, Chen F, Gardner LB, Uemoto S, Nguyen JH. Fulminant liver failure models with subsequent encephalopathy in the mouse. Hepatobiliary Pancreat Dis Int. 2011;10(6):611–9. [DOI] [PubMed] [Google Scholar]
- 31. Matkowskyj KA, Marrero JA, Carroll RE, Danilkovich AV, Green RM, Benya RV. Azoxymethane-induced fulminant hepatic failure in C57BL/6J mice: Characterization of a new animal model. Am J Physiol. 1999;277(2 Pt 1):G455–62. [DOI] [PubMed] [Google Scholar]
- 32. Belanger M, Cote J, Butterworth RF. Neurobiological characterization of an azoxymethane mouse model of acute liver failure. Neurochem Int. 2006;48(6–7):434–40. [DOI] [PubMed] [Google Scholar]
- 33. Miah MK, Bickel U, Mehvar R. Effects of hepatic ischemia-reperfusion injury on the blood-brain barrier permeability to [(14)C] and [(13)C]sucrose. Metab Brain Dis. 2017;32(6):1903–12. [DOI] [PubMed] [Google Scholar]
- 34. Costa-Ferro ZS, Souza BS, Leal MM, Kaneto CM, Azevedo CM, da Silva IC, Soares MB, Ribeiro-dos-Santos R, Dacosta JC. Transplantation of bone marrow mononuclear cells decreases seizure incidence, mitigates neuronal loss and modulates pro-inflammatory cytokine production in epileptic rats. Neurobiol Dis. 2012;46(2):302–13. [DOI] [PubMed] [Google Scholar]
- 35. Dhanda S, Sandhir R. Blood-brain barrier permeability is exacerbated in experimental model of hepatic encephalopathy via MMP-9 activation and downregulation of tight junction proteins. Mol Neurobiol. 2018;55(5):3642–59. [DOI] [PubMed] [Google Scholar]
- 36. Chastre A, Belanger M, Nguyen BN, Butterworth RF. Lipopolysaccharide precipitates hepatic encephalopathy and increases blood-brain barrier permeability in mice with acute liver failure. Liver Int. 2014;34(3):353–61. [DOI] [PubMed] [Google Scholar]
- 37. McMillin MA, Frampton GA, Seiwell AP, Patel NS, Jacobs AN, DeMorrow S. TGFbeta1 exacerbates blood-brain barrier permeability in a mouse model of hepatic encephalopathy via upregulation of MMP9 and downregulation of claudin-5. Lab Invest. 2015;95(8):903–13. [DOI] [PMC free article] [PubMed] [Google Scholar]
- 38. Shimojima N, Eckman CB, McKinney M, Sevlever D, Yamamoto S, Lin W, Dickson DW, Nguyen JH. Altered expression of zonula occludens-2 precedes increased blood-brain barrier permeability in a murine model of fulminant hepatic failure. J Invest Surg. 2008;21(3):101–8. [DOI] [PMC free article] [PubMed] [Google Scholar]