Abstract
Turbulence is a fundamental physical process through which energy injected into a system at large scales cascades to smaller scales. In collisionless plasmas, turbulence provides a critical mechanism for dissipating electromagnetic energy. Here we present observations of plasma fluctuations in low-β turbulence using data from NASA’s Magnetospheric Multiscale mission in Earth’s magnetosheath. We provide constraints on the partitioning of turbulent energy density in the fluid, ion-kinetic, and electron-kinetic ranges. Magnetic field fluctuations dominated the energy density spectrum throughout the fluid and ion-kinetic ranges, consistent with previous observations of turbulence in similar plasma regimes. However, at scales shorter than the electron inertial length, fluctuation power in electron kinetic energy significantly exceeded that of the magnetic field, resulting in an electron-motion-regulated cascade at small scales. This dominance should be highly relevant for the study of turbulence in highly magnetized laboratory and astrophysical plasmas.
I. INTRODUCTION
Turbulence provides a mechanism for the heating of collisionless plasmas throughout the universe. In a turbulent system, energy injected at fluid scales due to large-scale perturbations can cascade to smaller kinetic scales, where it can be more efficiently transferred to plasma particles [1,2]. Turbulence manifests as a continuum of wave-like modes and/or discrete structures, each of which can be described by an effective wave vector (k) and an apparent frequency (ω in rad/s, f in Hz) in the plasma rest frame [3]. These fluctuations are observed in both electromagnetic fields and plasma parameters, with their relative spectral properties elucidating the underlying physics of the cascade [4,5]. Due to a dearth of plasma parameters measured with sufficient speed to resolve kinetic-scale structures, the detailed physics of the turbulent cascade and subsequent particle heating processes are still under debate. Here, using such high-resolution data from NASA’s Magnetospheric Multiscale (MMS) mission, we present observational constraints of energy partitioning between magnetic field and particle kinetic energy in Earth’s magnetosheath.
Although turbulence need not be comprised of propagating wave modes [5,6], kinetic structures observed in many astrophysical plasmas can exhibit properties of either obliquely propagating kinetic Alfvén waves (KAW) [4,5,8–11] or whistler-mode waves [12–14]. To appropriately interpret observations within the context of turbulence theory, it is crucial to identify the spatial scale associated with each observed frequency (i.e., k(ω)). Due to limitations in resolving both k and ω (via Doppler shift [15]) at kinetic scales, it has been challenging to unambiguously catalog the dominant physical structures [16]. Recently, multi-spacecraft wave vector determination techniques have been applied to MMS data to recover estimates of k(ω) at kinetic scales [14,17]. However, such techniques have not yet been combined with high-resolution plasma data.
How energy is partitioned between electromagnetic fields and particles at kinetic scales is one of the most compelling open questions in turbulence (see reviews by [4] and [5]). In addition, the turbulent energy cascade rate scales with the total energy density, independent of any underlying dispersion relation [18]. Magnetic field fluctuations have often been used to quantify turbulent energy in space plasmas as these are the most commonly measured and are thought account for a large fraction of the total energy over most scales [4,5,19–21]. However, both plasma and electromagnetic field fluctuations contribute to the energy density of a turbulent system. In particular, particle-in-cell simulations of whistler-mode turbulence have predicted that fluctuations of electron kinetic energy become dominant at electron scales, altering the physics of the cascade process [13]. While turbulent spectra of some plasma parameters have been reported in both the solar wind and magnetosheath at kinetic scales [22–24], fluctuations in electron kinetic energy at these scales have not yet been observationally constrained.
The high-resolution instrumentation on NASA’s Magnetospheric Multiscale (MMS) mission [25] enables both the determination of k and the calculation of turbulent spectra from plasma parameters at kinetic scales. Here we use charged particle and magnetic field data collected in Earth’s low-β magnetosheath by MMS. We confirm that electron kinetic energy can indeed become dominant at scales smaller than the electron inertial length.
II. DATA SELECTION AND ANALYSIS
On 4 October 2016 from 12:22:34–12:25:13 UT, the four MMS spacecraft were in a tetrahedron formation (quality factor ~0.82 at orbit apogee [26]) spaced by ~ 7 km in magnetosheath at a local time of ~1600 h and radial distance of ~9.3 Earth radii (Re). The spacecraft were far downstream from the bow shock, within ~30 min or ~0.5 Re of the magnetopause that was encountered at ~13:00 UT. During this time interval, high-resolution magnetic field (7.8ms) and charged particle (30ms for electrons, 150ms for ions) data were collected by the Fluxgate Magnetometer (FGM) [27] and Fast Plasma Investigation (FPI) [28] instrument suites, respectively.
II.A. Data Overview
An overview of the selected turbulent interval is shown in Figure 1. The average plasma environment consisted of a number density of ne = ni =8 cm−3, a magnetic field strength of B=65 nT, perpendicular and parallel ion temperatures of Ti⟘= 400eV and Ti॥ = 260eV, respectively, and perpendicular and parallel electron temperatures of Te⟘ = 40eV and Te॥ = 50eV, respectively. These parameters resulted in plasma β,i.e., the ratio of plasma thermal pressure to magnetic pressure, much less than one for both protons and electrons. Gyroradii (ρ) and intertial lengths (d) for ions and electrons were ρi = 44 km, di = 81 km, ρe = 0.3 km, and de = 2 km, respectively.
Figure 1.
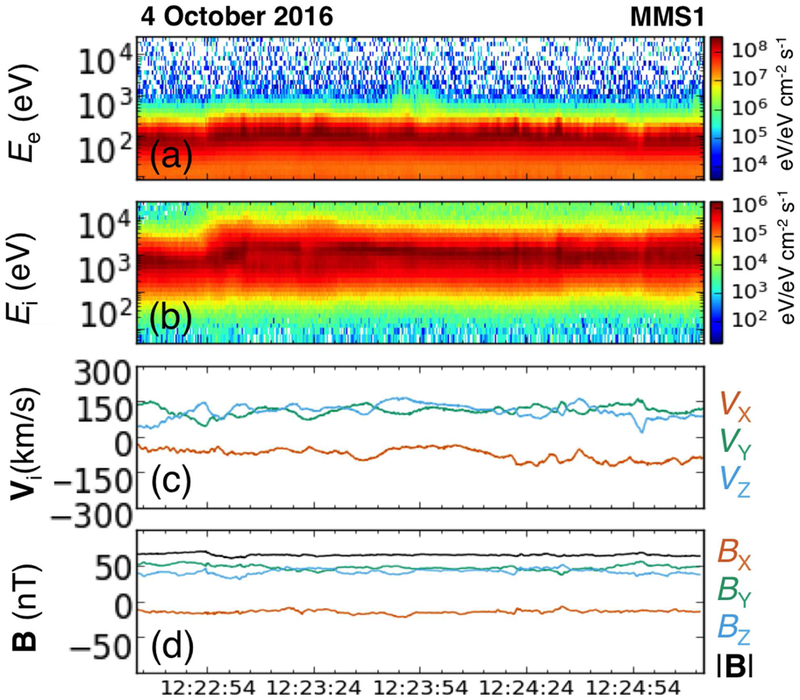
Overview of turbulence interval observed by MMS. (a) Electron energy spectrogram, (b) ion energy spectrogram, (c) ion bulk velocity, and (d) magnetic field vectors are shown from 12:22:34–12:25:13 UT on 4 October 2016 for MMS1. Small-scale fluctuations enable the estimation of an average background field and flow direction.
The average ion flow velocity over the entire interval was Vo = [−73.4±0.1, 110.9±0.3, 108.8±0.3] km/s in Geocentric Ecliptic (GSE) coordinates [29], where the uncertainty was calculated from the standard deviation of values across all spacecraft. This flow was within ~20° of the average magnetic field direction of [−0.22,0.73,0.64], with each spacecraft measuring the same average field direction to within 0.1°. As shown in Figure 1, the amplitude of measured fluctuations were small compared to their background levels (i.e., δB2/B2, δV2/V2 ≪ 1) such that average magnetic field and flow velocities were considered to be meaningful. As will be demonstrated, although relatively short in duration, this interval was of sufficient length to resolve fluid, ion, and electron scale fluctuations. Significantly longer intervals of high-resolution ‘quiet’ magnetosheath data were not available during the MMS main mission phase, where the primary scientific objective was to study magnetic reconnection [25].
II.B. Wave Vector Determination
The primary wave vector determination technique used here was developed by [30,31], where fluctuations in J×B in the spacecraft frame with Ampere’s law were used to estimate k(ωsc). This technique was successfully applied to MMS data by [32] for a monochromatic kinetic Alfvén wave, though not yet for broadband fluctuations. The J×B method has the advantage of only requiring data from a single spacecraft such that wave vectors from all four spacecraft can be evaluated independently, with the limitation that there be one dominant k at each frequency in the spacecraft frame. The validity of this single-mode assumption was evaluated via the plane-wave approximation [31]. In addition, wave vectors at scales larger than the inter-spacecraft separation were calculated via multi-spacecraft techniques [33–35] and compared with J×B-derived estimates.
The current density J was computed from particle data as ne e(Vi-Ve), where e is the charge of an electron and ion velocities were linearly interpolated to the electron sampling time. We calculated J from each spacecraft independently using FPI data. A Hanning window was applied to data before calculating Fast Fourier Transforms (FFTs). From numerical tests of the technique by [31], spectral noise significantly less than 50% of the signal was required to obtain accurate wave vector estimates. For this interval, the spectral noise of FPI data was dominated by Poisson statistics [36–39]. Taking these limitations into account, we took fsc = 7 Hz as the maximum frequency. We provide a detailed derivation of FPI spectral noise estimates in Appendix A.
We averaged the direction and magnitude of k-vectors into 0.05 Hz-spaced frequency bins up to 7 Hz for each spacecraft. The direction of k was found to be [−0.80±0.02, −0.57±0.02,0.37±0.03] with a corresponding angle with respect to the magnetic field of θ = 90.2±1.3°. Similarly, the angle between k and Vo was found to be 76.0±2.3° Uncertainties here were defined as the standard deviation across all observatories, whose individual values were obtained by averaging wave vector directions for fsc < 7 Hz. Wave vectors subsequently averaged over all four spacecraft are shown in Figure 2a and 2b. k(ωsc) remained linear for scales larger than k⟘ de ~ 1 (i.e.,fsc ≲ 4 Hz) and increased sub-linearly (i.e., k ∝ ωsc0.47±0.10) at smaller scales, where the exponent was determined via a liner fit to the data in log-log space for fsc > 4 Hz.
Figure 2.
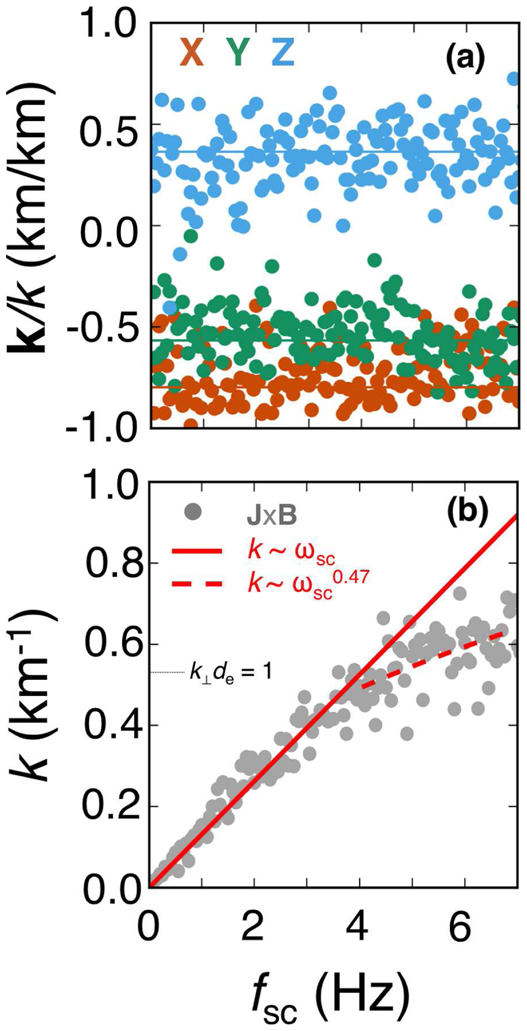
(a) The direction and (b) magnitude of wave vectors (k) determined by the J×B method as a function of frequency in the spacecraft frame in GSE coordinates. Data were averaged over all four MMS observatories. Here, k ≈ k⟘ ≫ k॥.k varies as ωsc and ωsc0.47±0.10 for fsc below and above 4 Hz, respectively.
II.3. Validation of Wave Vector Estimates
By leveraging the closely-spaced tetrahedron configuration of the four MMS observatories, we performed additional validation of the J×B-derived wave vectors. We first used estimated k-vectors and constellation-averaged magnetic field vectors with Ampere’s law to compare current densities derived by FPI and by the four-spacecraft curlometer technique [40]. In addition, we used k-filtering to solve for spectral power P(k ,ωsc).
II.3.1. Ampere’s Law
For a single dominant wave mode at a given frequency, the plane-wave approximation of Ampere’s law should hold, i.e., J = ∇ × B/μo ≈ ik(ωsc) ×B(ωsc)/μo. [31]. With independent MMS measurements of current density, it is straightforward to test this approximation. We took the inverse Fourier transform of ik(ωsc) ×B(ωsc)/μo using k(ωsc) = 0.13 ωsc and k(ωsc) = 0.26 ωsc0.47 (in units km−1) below and above fsc = 4 Hz, respectively. The average wave vector direction was taken as [−0.80, −0.57, 0.37]. This quantity was compared with current densities derived from FPI and also FGM using the four-spacecraft curlometer technique. This comparison is shown in Figure 3. There was good agreement between all three estimates of current density (correlation coefficient ~ 0.6 for the most strongly varying component), with modest discrepancies observed only in a few, isolated structures (e.g., near 12:24:30). This agreement demonstrated that the overall scaling of k was accurate, and supported the assumption that the fluctuations could be reasonably described by a single dominant wave vector direction.
Figure 3.
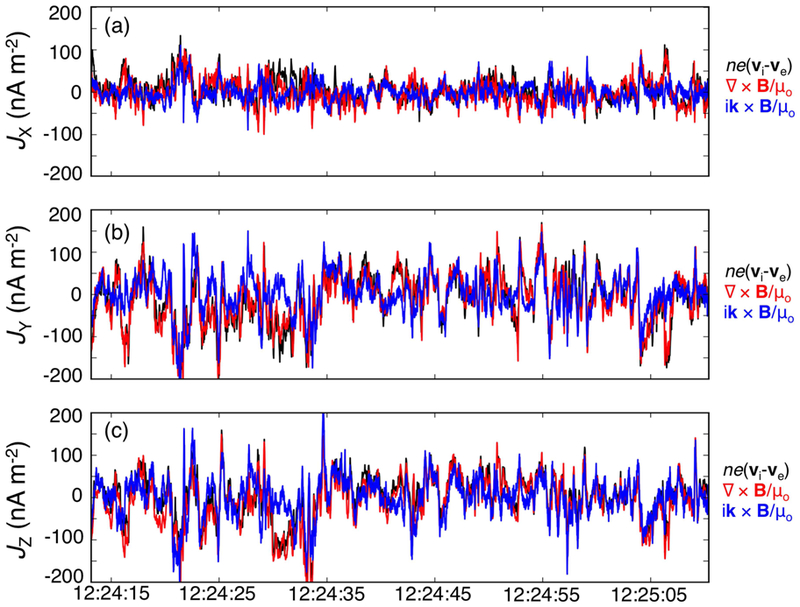
(a-c) Current density derived from (black) FPI data averaged across all four observatories, (red) the four-spacecraft gradient of the magnetic field (i.e., curlometer), and (blue) the plane-wave approximation applied to the four-spacecraft averaged magnetic field. Overall agreement between all three quantities implies accurate current densities derived from plasma instruments and a good estimation of wave vector as a function of frequency.
II.3.2. K-filtering
The ‘k-filtering’ method and the mathematically similar ‘wave-telescope’ technique use magnetic field data from multiple spacecraft to infer spectral power as a function of k and ωsc [33–35]. In these techniques, a 12×12 cross spectral density matrix is constructed in the spacecraft frame using the three components of the magnetic field at each spacecraft, and is then reduced using filter matrices that describe the propagation of the wave between each spacecraft (e.g., exp(i(k r-ωt)). The result is a power spectral matrix that is a function of k and ωsc. These techniques are capable of resolving multiple wave modes at a given frequency [35]. The minimum resolveable wavelength is set by the inter-spacecraft separation such that spatial aliasing can become an issue at higher frequencies.
To estimate wave vectors via k-filtering, we obtained sliding-window-averaged power spectra of B using a set of 1024 point (i.e., 8 sec) FFTs with a Hanning window size of 128 points (i.e., 1 sec). These spectra were input into a k-filtering algorithm with the constraint of ∇ B = 0. The resulting P(k ,ωsc) distributions are shown in Figure 4 in the k⟘1 − k⟘2 plane where k⟘1 was defined by (−Vo×B) ×B, k॥ was aligned with the average magnetic field direction, andk⟘2 complited the right-handed coordinate system. The wave vector derived from the J×B technique at each frequency was in good agreement with the location of the peak in P(k ,ωsc) at all frequencies. Because of the broadness of the peak at increasing frequency, spatial aliasing limited the comparison to below fsc = 3 Hz. Nonetheless, this analysis confirmed that the turbulent fluctuations were consistent with one dominant wave mode at each frequency in the spacecraft frame, justifying the use of the JxB method for this interval.
Figure 4.
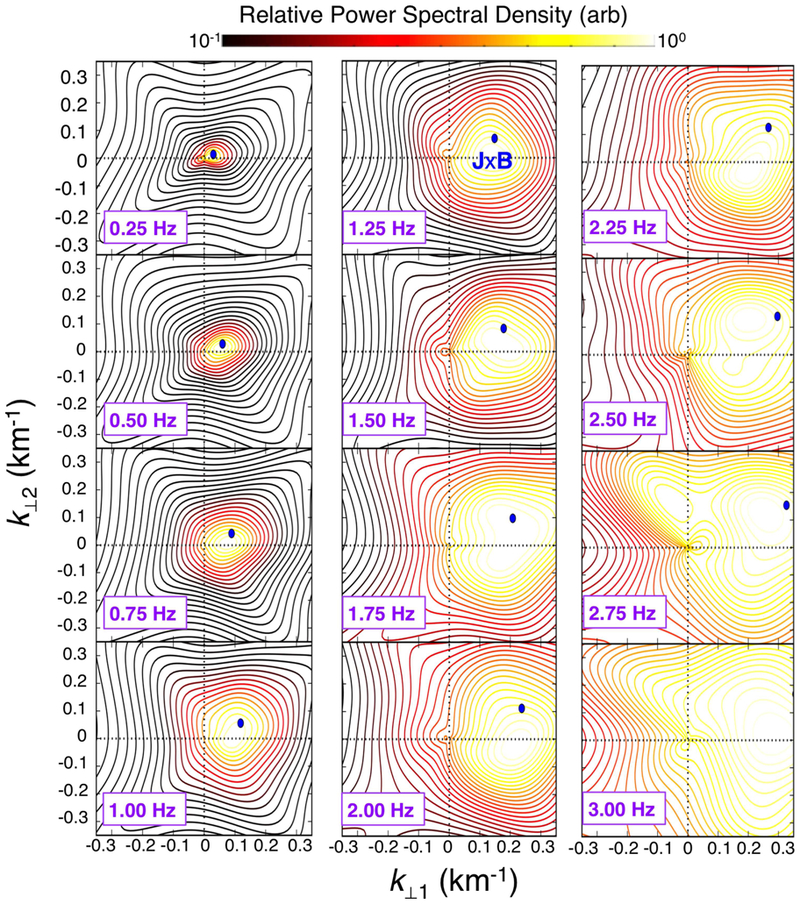
Power spectral density in the k⟘1 – k⟘2 at frequencies in the spacecraft frame between 0.25 and 3.00 Hz determined via k-filtering. The corresponding solution from the J×B method at each frequency is indicated with a solid blue dot. In each, there is good agreement between location of the peak contour and the wave vector determined via the J×B method, indicating a robust determination of k. At higher frequencies, spatial aliasing effects distorted the shape and location of the peak power spectral density.
III. RESULTS
Using k(ωsc) we Doppler-shifted the observed fluctuations to investigate the dominant dispersion relation and to transform power spectral densities into the spatial domain. These analyses provide constraints on the underlying physical processes that drive the turbulent cascade.
III.A. Dispersion Relation of Turbulent Fluctuations
Wave vectors were combined with the average flow velocity to calculate k(ω) using ωsc = ω + k(ωsc) Vo [3,15]. Instantaneous statistical uncertainties in components of the ion bulk velocity were on the order of ~1–2% [38], which were then reduced further through time-averaging. Errors in the Doppler shift were therefore dominated by the systematic uncertainty in k and Vo. This uncertainty was estimated via repeated Monte Carlo sampling of , using the normally distributed errors defined above for each quantity. The magnitude of k at each frequency was taken from the four-spacecraft-averaged values in Figure 2b. In Figure 5, k(ω) estimates are shown with dispersion relation curves of θ=89.86° and βi=0.3 obtained from two-fluid theory [41]. This comparison demonstrated qualitative agreement of the measured dispersion relation with that of highly oblique propagating fluctuations.
Figure 5.
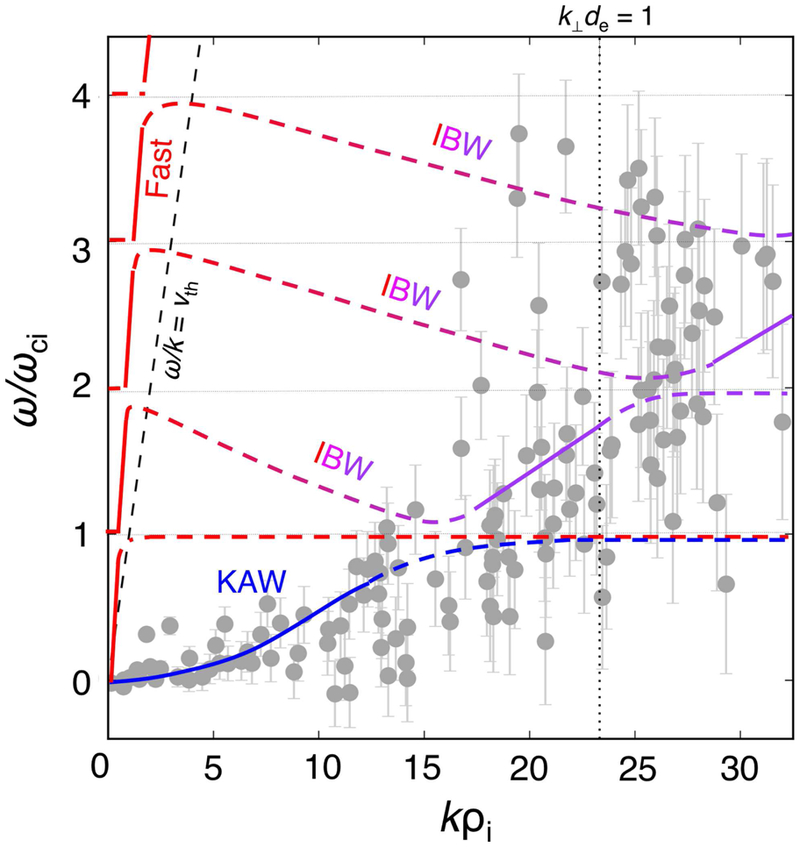
ω/ωci as a function of kρi using ωsc = ω + k Vo Doppler-shifted points using estimated wave vectors are shown as dark gray dots. Uncertainty estimates for k Vo are described in the text. The dashed line indicates the curve ω/k = vth, i.e., waves traveling at the ion thermal speed. Solid lines correspond to solutions (red = fast magnetosonic/”classical-whistler”, blue/purple = “Alfvén-whistler”) of the two-fluid dispersion relation for θ = 89.86° and βi = 0.3. At near-perpendicular propagation, i.e., θ~90°, the “classic-whistler” and “Alfvén-whistler” branches asymptote at ω = √(ωci ωce) and ω = ωce cos θ, respectively [41]. Branch cuts and dashed lines were artificially added near harmonics of the ion cyclotron frequency to illustrate kinetic scale effects, including the presence of ion Bernstein mode waves (IBW), following [47].
For context, the dispersion relations for the fast magnetosonic/”classical-whistler” and so-called “Alfvén-whistler” branches from two-fluid theory [41] are shown in Figure 6. These curves were compared with those of the generalized cold plasma dispersion relation used for simulations of whistler turbulence [13,42]. At parallel propagation, all three sets of dispersion relations had ω/k > vth and fell along the fast magnetosonic branch. At increasing angles of propagation, however, the two-fluid “Alfvén-whistler” and analytical curves moved to ω/k < vth. Here it is clear that the cold plasma dispersion relation for highly oblique whistler-mode waves is equivalent to the “Alfvén-whistler” branch of two-fluid theory rather than the “classical-whistler” branch. Regardless of nomenclature, the dispersion relation of the measured fluctuations most closely match those typically used for simulations of whistler turbulence.
Figure 6.
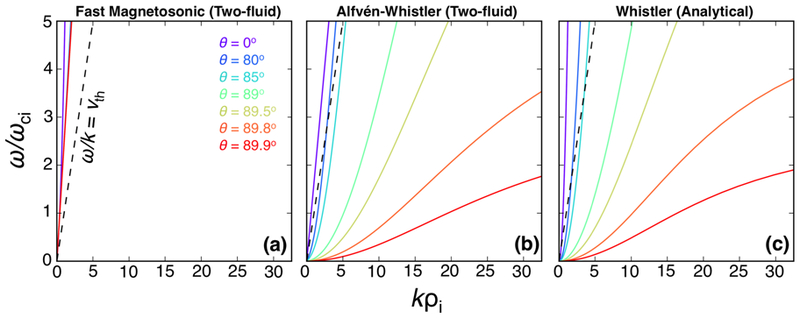
Dispersion relation as a function of propagation angle using (a) the fast-magnetosonic/”classical-whistler” branch from two-fluid theory [41], (b) the “Alfvén-whistler” branch from two-fluid theory, and (c) generalized cold plasma dispersion relation used in studies of whistler turbulence [13,42]. Plasma parameters presented in this study were used to derive each set of curves. At highly oblique propagation angles, the “Alfvén-whistler” and analytical curves transition to ω/k < vth, taking on different properties than their “classical-whistler” counterparts.
The compressibility, as shown in Figure 7, provided further constraints to be used in wave mode identification. Through calculation of <δnδBǁ> [43], we found that density and magnetic fluctuations were anti-correlated throughout the inertial and ion-kinetic ranges. The spectral noise floor of the density fluctuations exceeded the signal at fsc ~ 4 Hz such that analysis of δn at electron scales was limited. In addition, the magnetic compressibility, δBǁ2/δB2 [41], remained below ~0.5 throughout the entire kinetic range, consistent with ω/k < vth.
Figure 7.
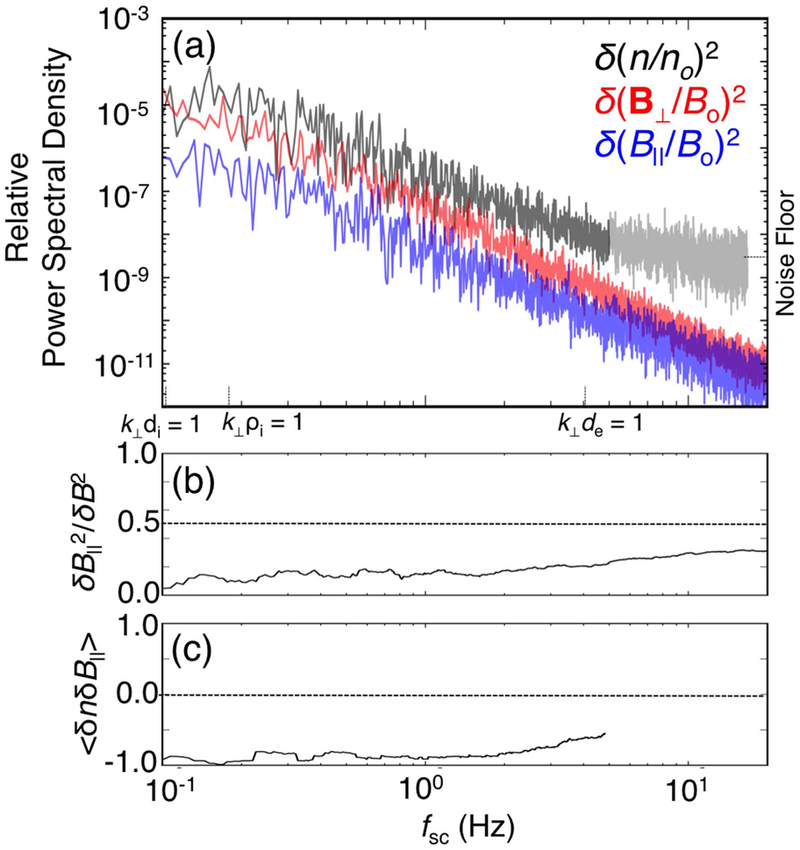
(a) Power spectral density of δn/n, δBǁ/B, δB⟘/B, (b) magnetic compressibility δBǁ2/δB2, and (c) <δnδBǁ> as a function of frequency. Although Poisson noise dominates the density fluctuation spectrum above ~4 Hz, it is clear that density and parallel magnetic field are anti-correlated throughout the ion-kinetic range. The magnetic compressibility remains below ~0.5 at both ion and electron kinetic scales. Compressibilities in (b) and (c) were smoothed with a moving average window of frequencies within a factor of 1.2 of the window center.
III.B. Spectrum of Turbulent Energy Density
With a known relationship between and ωsc, the energy density of fluctuations was estimated and spectral slopes were calculated for each spatial regime. In Figure 8 we show the energy density of the magnetic field, ion kinetic energy, and electron kinetic energy as Σj=x,y,z |δ(Bj/(√(2μo))) |2, Σj |δ(√(neme/2)Ve,j)|2, and Σj |δ(√(nimi/2)Vi,j)|2 respectively (e.g., [44]), where each quantity represents the trace of its corresponding power spectral matrix. We found local spectral indices for the magnetic energy of −1.30±0.52, −2.13±0.23, and −6.19±0.04 throughout the fluid, ion-kinetic, and electron-kinetic scales respectively. Corresponding electron kinetic energy indices were found to be −0.38±0.24, −0.66±0.27, and −4.26±0.12. For ions, spectral indices of −1.81±0.34 and −3.37±0.37 were found in the fluid and ion-kinetic scales, respectively, with lower time resolution and high spectral noise limiting estimation of properties at electron scales. The spectral noise floors were subtracted from particle data before calculating spectral indices using linear fits in log-log space. The relationship k ∝ ωsc0.47 was used to estimate spectral slopes at electron scales. As observed in Figure 8, the electron kinetic energy became larger than that of the magnetic energy for scales k⟘de > 1 This dominance of electron kinetic energy at high frequencies was independent of uncertainties in the scaling of k with ωsc.
Figure 8.
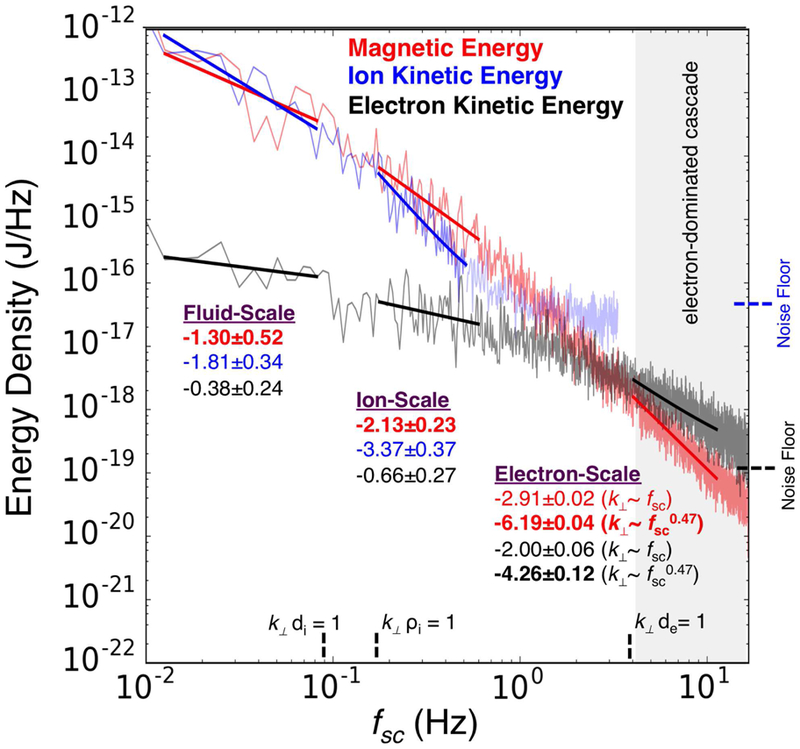
Fluctuation power of magnetic (red), ion kinetic (blue), and electron kinetic (black) energies as a function of frequency. Energies are defined as Σj=x,y,z |δ(Bj/(√(2μo))) |2, Σj |δ(√(neme/2)Ve,j)|2, and Σj |δ(√(nimi/2)Vi,j)|2, respectively, where each quantity represents the trace of its corresponding power spectral matrix. Spectral indices were calculated at fluid, ion, and electron scales over intervals marked by solid lines. Indices at the electron scales are reported for both k⟘∝ ωsc (as plotted) and k⟘ ∝ fsc0.47 scalings. Electron motion dominates the energy density spectrum above at electron scales, independent of uncertainty in the scaling of k for fsc > 4.
IV. DISCUSSION
The large magnetic field strength in the magnetosheath resulted in βe ≪ 1 even for a modest electron density and temperature. These conditions shifted the k⟘de > 1 fluctuations into the FPI frequency range with a sufficient signal to noise ratio to resolve electron-scale turbulence. Consequently, in other environments sampled by MMS with weaker magnetic fields, such as the solar wind, it may only be possible to resolve ion-scale turbulence with similar plasma instrumentation. In addition, the noise floors of FPI power spectra scale inversely with plasma number density and the duration of the observations [36,37]. A high noise floor produced by a time-stationary, homogeneous, and sparse plasma could be compensated for by increasing the duration of the measurement interval.
In two-fluid theory, the “Alfvén-whistler” branch contains both highly oblique KAW (ω < ωci) and whistler-mode (ω > ωci) waves [41,45,46]. This kinetic-scale branch was suggested to extend from the shear Alfvén branch of the plasma dispersion relation and has an asymptote at ω = ωce cosθ However, recent kinetic simulations [47] have demonstrated that this branch is not truly continuous through harmonics of the ion cyclotron frequency (ωci) Instead it is nonetheless topologically connected to the fast magnetosonic branch via ion Bernstein modes [47]. This subtlety is illustrated in Figure 5. Here, the naming of this mode becomes somewhat ambiguous, though it is clear that the true KAW fluctuations are limited to ω < ωci Fluctuations at the smallest observed kinetic-scales (i.e.,k⟘ ρi > 15) had ω > ωci, following a dispersion relation consistent with those used for studies of whistler turbulence [13,42]. Consequently, we adopt this dispersion relation in order to provide analytical expressions for the wave packet group velocity below.
The highly oblique waves studied here have ω/k < vth at kinetic scales, where vth is the ion thermal speed defined as Consequently, linear theory predicts that these modes have anti-correlated density and parallel magnetic field fluctuations [43] and a magnetic compressibility less than ~0.5 at kinetic scales [41]. As discussed in Section III.A, our observations were consistent with these predictions. It follows that the primary distinction between different highly oblique modes arises from the range of apparent oscillation frequencies rather than the compressibility. Because is challenging to determine, it is possible that past observations of compressive turbulence in space plasmas that relied on examining the correlation between density and parallel magnetic field fluctuations (e.g., [48–50]) have involved some contributions from oblique ω > ωci waves at electron scales rather than from KAW alone.
With direct observations of the velocity fluctuations, we can estimate the turbulent eddy turnover time (τed) at electron scales. τed was taken to be λ⟘/δve⟘,k, where δve⟘,k is the measured perpendicular electron velocity per spatial scale (i.e., [13]) and λ⟘ is the perpendicular wavelength of the fluctuations (i.e., λ⟘ = 2π/k⟘). Using the scaling k⟘ ~ ωsc0.47 we found τed ~ 30 s at the smallest observed scales. It is instructive to compare this time scale with the wave-packet interaction time, τw, taken to be where is the group velocity [13]. In the limits of k⟘de ≫ 1 and k⟘ ≫k॥, we found τw ≈ (fce cos θ)−1, where fce is the electron cyclotron frequency [13,51]. The minimum value of cos θ that can support ω > ωci propagation is equal to the mass ratio me/mi [41] such that we expected τw,max ≈ fci−1, which yielded τw < 1 s. Analytical descriptions of whistler turbulence assume that the cascade is driven by many weak interactions of waves with one another [42,51–53]. In such models, the turbulent eddy turnover time was required to be much larger than the wave-interaction time, i.e., τed ≫ τw. From the above analysis, this criterion appears to be satisfied at the relevant scales. Electron motion dominance of the turbulent energy density results in its regulation of the energy cascade rate arising from many of these weak wave-wave interactions [13].
In addition to exhibiting strong anisotropy (i.e., k⟘≫k॥), kinetic-scale turbulence is typically modeled as ‘gyrotropic’, i.e., there are many k-vectors for a given frequency that are axisymmetric in the k⟘ plane. [52,54, 55–59]. The wave vectors determined in Figure 2a, however, had a preferred axis that was near (i.e., within 20°) the direction of (−Vo ×B) × B. This apparent one-dimensional nature of the fluctuations (i.e., a unique k for each ω) likely enabled the agreement between the J×B method and k-filtering analysis. Such non-axisymmetric wave vectors have been reported extensively in both the magnetosheath and solar wind [60–65]. However, the origin of this asymmetry remains an open question, whether it results from the proximity of the observations to magnetospheric boundaries [60,62,63] or arises due to an implicit filtering bias of the component of the wave vector parallel to the flow velocity [66,67]. Nonetheless, our estimates of k⟘ should be robust as they represent an average over any asymmetries. Finally, we note that in order to conserve energy and momentum among three non-linearly interacting waves, the relationship k1 + k2 = k3 must hold [68,69]. Consequently, if two waves with similar wave vector directions interact, the resultant wave must propagate in the same direction, i.e., any asymmetry in the k⟘ plane would be preserved throughout a turbulent cascade that is driven by wave-wave coupling.
Electron motion dominated the energy density at the smallest FPI-observable scales and thus regulated the cascade of turbulent energy. This result is independent of any uncertainties in the mapping of frequency to k-space, though the observed crossover at k⟘de~1 suggests accurate wave vector determination. In low-β plasmas, ion kinetic and magnetic energies are often nearly (but not exactly) equal at the scale k⟘di~1[37]. These energies will both exceed the electron kinetic energy by a factor of mi/me. At scales smaller than k⟘di = 1, ion motion decouples from that of the electrons. Fluctuations in electron bulk velocity are therefore proportional to those in the current density. From Ampere’s law, this relationship implies that δVe2 ∝ k2δB2, i.e., the spectral slope of the magnetic energy density fluctuations is steeper than that of the electron kinetic energy fluctuations [13,51,78]. Because spatial scales k⟘di~1 and k⟘de~1 are separated by a factor of (mi/me)1/2, the magnetic energy and electron kinetic energies will become equal to each other at k⟘de~1, independent of the spectral index of δB2.
If de ≫ ρe(i.e., βe ≪ 1), electrons remain frozen into the field for scales between the electron gyroradius and electron inertial length. Consequently, the relationship δVe2 ~ k2δB2 should continue to hold, and because the energies are equal at k⟘de~1, the electron kinetic energy should exceed the magnetic energy for scales between k⟘de~1, and k⟘de~1. The relative separation of these electron scales grows larger as the electron β decreases, extending the region of electron-motion dominance. The low-β environment studied here is common in both laboratory and astrophysical plasmas [70–75] such that an electron-motion-regulated cascade could occur in many turbulent systems. This regime is regularly found in planetary magnetosheaths and magnetospheres where Ti ≫ Te and βi < 10 [74,75]. In the solar wind, where Ti ~ Te, these conditions may not be as common except for inside high-speed streams or magnetic clouds [76,77].
Electron magnetohydrodynamic simulations of whistler turbulence predicted spectral indices for turbulent energy of −7/3 and −5/3 for k⟘de < 1 and k⟘de > 1, respectively [52]. In addition, particle-in-cell simulations of whistler turbulence have found spectral indices of the turbulent energy at kinetic scales to be between −2 and −3 [13,58]. Our observed spectral indices were somewhat steeper than these predictions for k⟘de > 1, indicating that the electron-scale turbulence here may not have been in a fully developed state. From the measured data, we cannot necessarily distinguish between a power law and exponential roll-off in the energy density spectra [21]. Here we report on the best-fit slope obtained locally on the marked portions of the power spectrum in Figure 8 to provide constraints for comparison with simulations.
Due to the large inter-spacecraft separation (~7 km) compared to the electron inertial length (~2 km), independent wave vector determination at frequencies corresponding to electron scales with k-filtering was not possible. Therefore, we cannot definitively rule out systematic uncertainty in the k ∝ ωsc0.47 scaling. However, improved consistency of estimated spectral slopes with the relationship δVe2 ∝ k2δB2 for k ∝ ωsc0.47 compared k ∝ ωsc supported this sub-linear scaling. Furtherm the dominance of electron kinetic energy at high frequencies, the primary result reported here, was independent of systematic uncertainty in the mapping of the frequency domain to the spatial domain.
V. CONCLUSIONS
Using high-resolution data from MMS, we have provided observational constraints of electron kinetic energy in kinetic-scale turbulence. Fluctuations measured with k⟘ ≫k॥, ω>ωci, δBǁ2/δB2 ≤ 0.5, and anti-correlated δn and δBǁ were consistent with highly oblique turbulence at electron-scales. While the magnetic fluctuations dominated the turbulent energy density throughout the ion-kinetic range, the fluctuation power in δVe2 exceeded that of δB2 at electron scales. It is crucial to further characterize and understand this transition to an electron-motion-driven cascade in order to elucidate the physics of turbulence in collisionless plasmas.
ACKNOWLEDGEMENTS.
This research was supported by the NASA Magnetospheric Multiscale Mission in association with NASA contract NNG04EB99C. IRAP contributions to MMS FPI was supported by CNES and CNRS. We thank the entire MMS team and instrument leads for data access and support. The data presented in this paper are the L2 data of MMS and can be accessed from MMS Science Data Center (https://lasp.colorado.edu/mms/sdc/public/).
APPENDIX: SPECTRAL NOISE IN FPI DATA
There are several sources of noise that impact the estimation of power spectral density of plasma parameters. Plasma parameters are typically obtained through numerical integration of measured phase space densities. Time variations in these phase space densities due to counting statistics or improperly filtered particle populations will have corresponding frequency responses. In addition, the calculation of moments themselves will lead to features in frequency space if the energy-angle targets or limits of integration are not held constant. The latter, which arise in FPI due to variations in spacecraft potential [39] or interleaved energy-tables [28], are not typically significant compared to other sources of noise. Instead, here we focus on the contribution of noise from the random counting of particles, which affects both Dual Electron Spectrometer (DES) and Dual Ion Spectrometer sensor heads. We also discuss the contribution of low-energy photoelectrons that are generated inside and subsequently measured by DES.
As FPI sensors detect individual particles as part of a Poisson-counting process, random error is necessarily superimposed on measured phase space densities. The propagation of these statistical errors to arbitrary plasma moments has been derived by [38], and these uncertainties have been included in publicly available Level 2 FPI data products. To estimate the effect of these errors on power spectra, we constructed a time series of white noise using, at each time step, a zero mean and a standard deviation equal to the reported statistical error. We then calculated the power spectral density of this time series. As an example, in Figure 9, we considered fluctuations in number density on MMS1 of the interval studied in the main text, i.e., 4 October 2016 from 12:22:34–12:25:13 UT. The measured fluctuations in number density approached this spectral floor at high frequencies, and became dominated by Poisson noise above fsc ~ 4 Hz. The agreement between the predicted noise spectrum and that of the measured density fluctuations at high frequencies suggests accurate estimate of statistical uncertainties. To estimate errors for more complex quantities such as energy density, we assumed that statistical errors for each parameter (e.g., number density and bulk velocity) were independent of one another.
Figure 9.
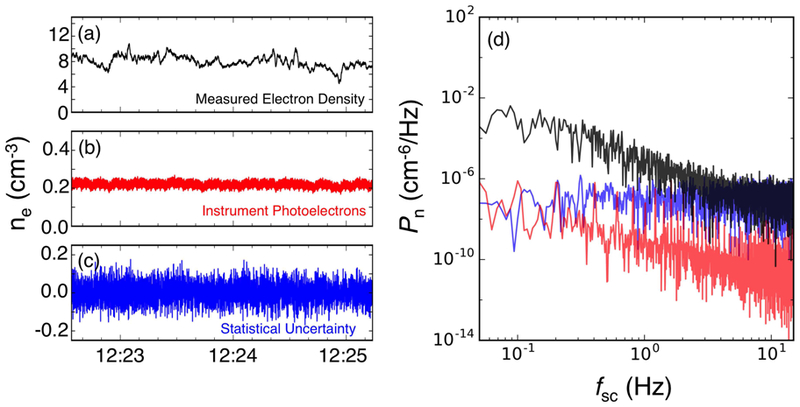
(a-c) Example time series of measured electron number density, modeled DES instrument photoelectron densities, and estimated Poisson noise on 4 Oct 2016 from 12:22:34–12:25:13 UT on MMS1. (d) Power spectral density for each time series. The Poisson noise produces a flat spectrum that dominates the signal above ~ 4 Hz. Photoelectrons exhibit a more complex spectrum, with sharp peaks above ~0.2 Hz due to the superposition of instrument photoelectron signatures from 8 sensor heads, each with different sun-analyzer angles that vary with spacecraft spin phase. Because of the low effective density of instrument photoelectrons compared to the ambient plasma density, they were not considered as significant for this event.
In addition, photoelectrons generated inside DES are measured at low energies and can contaminate electron data. Their complex structure due to varying sun-analyzer angles for each of the eight DES sensor heads per observatory leads to strong spin-phase variation in their effective phase space densities. This signature, however, has been modeled by [39], and has also been made publicly available on the MMS science data center. While the contribution of these photoelectrons has been removed from DES Level 2 moments, it is instructive to examine the spectral response of this particle population. We constructed a time series of photoelectron contributions to the number density, and calculated the corresponding power spectral densities in Figure 9. Unlike the spectral response of the statistical uncertainties, which is flat, the photoelectron power spectra exhibits significant structure. Several sharp peaks were apparent above fsc ~ 1 Hz. However, because the number density of the interval studied here was ≫1cm−3, which is much larger than the effective density of the instrument photoelectrons, this spectral noise source could be neglected.
REFERENCES
- 1.Goldreich P and Sridhar S, ApJ, 438, 2 (1995). [Google Scholar]
- 2.Goldreich P and Sridhar S, ApJ, 485, 2 (1997). [Google Scholar]
- 3.Tu C-Y and Marsch E, Space Sci. Rev, 73, 1 (1995). [Google Scholar]
- 4.Schekochihin AA, Cowley SC, Dorland W, Hammett GW, Howes GG, Quataert E, and Tatsuno T, ApJ Supp Ser, 182, 1 (2009). [DOI] [PubMed] [Google Scholar]
- 5.Chen CK, J. Plas. Phys, 82, 6 (2016). [Google Scholar]
- 6.Sundkvist D, Retinò A, Vaivads A, and Bale SD, Phys. Rev. Lett, 99, 025004 (2007). [DOI] [PubMed] [Google Scholar]
- 7.Osman KT, Matthaeus WH, Hnat B, and Chapman SC, Phys. Rev. Lett, 108, 261103 (2012). [DOI] [PubMed] [Google Scholar]
- 8.Leamon RJ, Smith CW, Ness NF, Matthaeus WH, and Wong HK, 103, A3 (1998). [Google Scholar]
- 9.Bale SD, Kellogg PJ, Mozer FS, Horbury TS, and Reme H, Phys. Rev. Lett, 94, 215002 (2005). [DOI] [PubMed] [Google Scholar]
- 10.Howes GG, Dorland W, Cowley SC, Hammett W, Quataert E, Schekochihin A, and Tatsuno T, Phys. Rev. Lett, 100, 065004. [DOI] [PubMed] [Google Scholar]
- 11.Salem CS, Howes GG, Sundkvist D, Bale SD, Chaston CC, Chen CHK, and Mozer FS, ApJ Lett, 745, 1 (2012). [Google Scholar]
- 12.Stawicki O, Gary SP, and Li H, J. Geophys. Res.: Space Physics, 106, A5 (2001). [Google Scholar]
- 13.Saito S, Gary SP, and Narita Y, Phys. Plas, 17, 122316 (2010). [Google Scholar]
- 14.Narita Y, Nakamura R, Baumjohann W, Glassmeier K-H, Motschmann U, Giles B, Magnes W, Fischer D, Torbert RB, and Russell CT, ApJ Lett, 827,1 (2016). [Google Scholar]
- 15.Howes GG, Klein KG, and TenBarge JM, ApJ, 789, 2 (2014). [Google Scholar]
- 16.Goldstein ML, Wicks RT, Perri S, and Sahraoui F, Phil. Trans. Roy. Soc. A, 373, 2041 (2015). [DOI] [PMC free article] [PubMed] [Google Scholar]
- 17.Narita Y, Plaschke F, Nakamura R, Baumjohann W, Magnes W, Fischer D, Vörös Z, Torbert RB, Russell CT, Strangeway RJ, et al. , Geophys. Res. Lett, 43, 10 (2016). [DOI] [PMC free article] [PubMed] [Google Scholar]
- 18.Frisch U, Turbulence (Cambridge Univ. Press, 1995). [Google Scholar]
- 19.Coleman PJ Jr., ApJ, 153, 371 (1968). [Google Scholar]
- 20.Belcher JW and Davis L Jr., J. Geophys. Res.,: Space Physics, 76, 3534 (1971). [Google Scholar]
- 21.Alexandrova O, Saur J, Lacombe C, Mangeney A, Mitchell J, Schwartz SJ, and Robert P, Phys. Rev. Lett, 103, 165003 (2009). [DOI] [PubMed] [Google Scholar]
- 22.Chen CHK, Salem CS, Bonnell JW, Mozer FS, and Bale SD, Phys. Rev. Lett, 109, 035001 (2012). [DOI] [PubMed] [Google Scholar]
- 23.Šafránková J, Němeček Z, Němec F, Přech L, Chen CHK, and Zastenker GN, ApJ, 826, 2 (2016). [Google Scholar]
- 24.Stawarz JE, Eriksson S, Wilder FD, Ergun RE, Schwartz SJ, Pouquet A, Burch JL, Giles BL, Khotyaintsev Y, Le Contel O et al. , J. Geophys. Res.: Space Physics, 121, 11 (2016). [Google Scholar]
- 25.Burch JL, Moore TE, Torbert RB, and Giles BL, Space Sci. Rev, 199, 5 (2016). [Google Scholar]
- 26.Fuselier SA, Lewis WS, Schiff C, Ergun R, Burch JL, Petrenic SM, and Trattner KJ, Space Sci. Rev, 199, 77 (2016). [Google Scholar]
- 27.Russell CT, Anderson BJ, Baumjohann W, Bromund KR, Dearborn D, Fischer D, Le G, Leinweber HK, Lememan D, Magnes W et al. , Space Sci. Rev, 199, 189 (2016). [Google Scholar]
- 28.Pollock C, Moore T, Jacques A, Burch J, Gliese U, Saito Y, Omoto T, Avanov L, Barrie A, Coffey V, et al. , Space Sci. Rev, 199, 331 (2016). [Google Scholar]
- 29.Hapgood MA, Planet. Space Sci, 40, 5 (1992). [Google Scholar]
- 30.Bellan PM, J. Geophys Res.: Space Physics, 117, A12 (2012). [Google Scholar]
- 31.Bellan PM, J. Geophys Res.: Space Physics, 121, 9 (2016). [DOI] [PMC free article] [PubMed] [Google Scholar]
- 32.Gershman DJ, F.-Viñas A, Dorelli JC, Boardsen SA, Avanov LA, Bellan PM, Schwartz SJ, Lavraud B, Coffey VN, Chandler MO, et al. , Nat. Comm, 8, 14719 (2017). [DOI] [PMC free article] [PubMed] [Google Scholar]
- 33.Neubauer FM and Glassmeier K-H, J. Geophys. Res.: Space Physics, 95, A11 (1990) [Google Scholar]
- 34.Pinçon JL and Lefeuvre F, J. Geophys. Res.: Space Physics, 96, A2 (1991). [Google Scholar]
- 35.Sahraoui F, Pinçon JL, Belmont G, Rezeau L, Cornilleau-Wehrlin N, Robert P, Mellul L, Bosqued JM, Balogh A, Canu P, and Chanteur G J. Geophys. Res.: Space Physics, 108, A9 (2003). [Google Scholar]
- 36.Johnstone AD and Krauklis IC, J. Geophys. Res.: Space Physics, 103, A7 (1998). [Google Scholar]
- 37.Chen CHK, Bale SD, Salem CS, and Maruca BA, ApJ, 770, 2, (2013). [Google Scholar]
- 38.Gershman DJ, Dorelli JC, F.-Viñas A, and Pollock CJ, J. Geophys. Res.: Space Physics, 120, 8 (2015). [Google Scholar]
- 39.Gershman DJ, Avanov L, Boardsen S, Dorelli J, Gliese U, Barrie A, Schiff C, Paterson W, Torbert R, Giles B, and Pollock C, J. Geophys. Res.: Space Physics, in revision
- 40.Dunlop MW, Balogh A, Glassmeier K-H, and Robert P, J. Geophys. Res.: Space Physics, 107, A11 (2002). [Google Scholar]
- 41.Sahraoui F, Belmont G, and Goldstein ML, ApJ, 748, 2 (2012). [Google Scholar]
- 42.Biskamp D, Schwartz E, and Drake JF, Phys. Rev. Lett, 76, 1264 (1996). [DOI] [PubMed] [Google Scholar]
- 43.Krauss-Varban D, Omidi N, and Quest KB, J. Geophys. Res.: Space Physics, 99, A4 (1994). [Google Scholar]
- 44.Kimura K and Morrison PJ, Phys. Plas, 21, 082101 (2014). [Google Scholar]
- 45.Gary SP, J. Plasma Phys, 35, 431 (1986). [Google Scholar]
- 46.Zhao JS, Voitenko YM, Wu DJ, and Yu MY, J. Geophys. Res.: Space Physics, 121, 5 (2016). [Google Scholar]
- 47.López RA, F.-Viñas A, Araneda JA, and Yoon PH, ApJ, 845, 1 (2017). [Google Scholar]
- 48.Yao S, He J-S, Marsch E, Tu C-Y, Pederson A, Rème H, and Trotignon JG, ApJ, 728, 2 (2011). [Google Scholar]
- 49.Howes GG, Bale SD, Klein KG, Chen CHK, Salem CS, and TenBarge JM, ApJ Lett, 753, 1 (2012). [Google Scholar]
- 50.Kiyani KH, Chapman SC, Sahraoui F, Hnat B, Fauvarque O, and Khotyaintsev YV, ApJ, 763, 1 (2012). [Google Scholar]
- 51.Narita Y and Gary SP, Ann. Geophys, 28, 597 (2010). [Google Scholar]
- 52.Biskamp D, Schwartz E, and Zeiler A, Phys. Plas, 6, 751 (1999). [Google Scholar]
- 53.Cho J and Lanzarian A, ApJ Lett, 615, 1 (2004). [Google Scholar]
- 54.Saito S, Gary SP, Li H, and Narita Y, Phys. Plas, 15, 102305 (2008). [Google Scholar]
- 55.Shaikh D, Mon. Not. R Astron. Soc, 385, 4 (2009). [Google Scholar]
- 56.Gary SP, Saito S, and Li H, Geophys. Res. Lett, 35, 2 (2008). [Google Scholar]
- 57.Gary SP, Chang O, and Wang J, ApJ, 755, 2 (2012). [Google Scholar]
- 58.Chang O, Gary SP, and Wang J, Geophys. Res., Lett, 38, 22 (2011). [Google Scholar]
- 59.Chang O, Gary SP, and Wang J, J. Geophys. Res.: Space Physics, 118, 6 (2013). [Google Scholar]
- 60.Sahraoui F, Belmont G, Rezeau L, Cornilleau-Wehrlin N, Pinçon JL, and Balogh A, Phys. Rev. Lett, 96, 075002 (2006). [DOI] [PubMed] [Google Scholar]
- 61.Sahraoui F, Goldstein ML, Belmont G, Canu P, and Rezeau L, Phys. Rev. Lett, 105, 131101 (2010). [DOI] [PubMed] [Google Scholar]
- 62.Narita Y, Glassmeier K-H, Sahraoui F, and Goldstein ML, Phys. Rev. Lett, 104, 171101 (2010). [DOI] [PubMed] [Google Scholar]
- 63.Narita Y, Sahraoui F, Goldstein ML, and Glassmeier K-H, J. Geophys. Res.: Space Physics, 115, A4 (2010). [Google Scholar]
- 64.Narita Y, Nonlin. Proc. Geophys, 21, 41 (2014). [Google Scholar]
- 65.Roberts OW, Li X, and Li B, ApJ, 769, 1 (2013). [Google Scholar]
- 66.Alexandrova O, Lacombe C, and Mangeney A, Ann. Geophys, 26, 3585 (2008). [Google Scholar]
- 67.Turner AJ, Gogoberidze G, Chapman SC, Hnat B, and Müller W-C, Phys. Rev. Lett, 107, 095002 (2011). [DOI] [PubMed] [Google Scholar]
- 68.Shebalin JV, Matthaeus WH, and Montgomery D, J. Plas. Phys, 29, 3 (1983). [Google Scholar]
- 69.Gary SP, ApJ, 769, 1 (2013). [Google Scholar]
- 70.Sykes A, Phys. Plas, 4, 1665 (1997). [Google Scholar]
- 71.Crutcher RM, ApJ, 520, 2 (1999). [Google Scholar]
- 72.Gary GA, Sol. Phys, 203, 1 (2001). [Google Scholar]
- 73.Mullan DJ and Smith CW, Sol. Phys, 234, 2 (2006). [Google Scholar]
- 74.Phan T-D, Paschmann G, Baumjohann W, Schopke N, and Lühr H, J. Geophys. Res.: Space Physics, 99, A1 (1994). [Google Scholar]
- 75.Wang CP, Gkioulidou M, Lyons LR, and Angelopoulos V, J. Geophys. Res.: Space Physics, 117, A8 (2012). [Google Scholar]
- 76.Newbury JA, Russell CT, Phillips JL, and Gary SP, J. Geophys. Res.: Space Physics, 103, A5 (1998). [Google Scholar]
- 77.Ebert RW, McComas DJ, Elliott HA, Forsyth RJ, and Gosling JT, J. Geophys. Res.: Space Physics, 114, A1 (2009). [Google Scholar]
- 78.TenBarge JM and Howes GG, ApJ Lett, 771, 2 (2013). [Google Scholar]


