Abstract
Objective:
This study investigated the feasibility of using strain elastography (SE) and real time shear wave elastography (RT-SWE) to evaluate early tumor response to cytotoxic chemotherapy in a murine xenograft breast cancer tumor model.
Methods:
MCF-7 breast cancer-bearing nude mice were treated with either cisplatin 2 mg kg–1 plus paclitaxel 10 mg kg–1 (treatment group) or sterile saline (control group) once daily for 5 days. The tumor elasticity was measured by SE or RT-SWE before and after therapy. Tumor cell density was assessed by hematoxylin and eosin staining, and the ratio of collagen fibers in the tumor was evaluated by Van Gieson staining. The correlation between tumor elasticity, as determined by SE and SWE, as well as the pathological tumor responses were analyzed.
Results:
Chemotherapy significantly attenuated tumor growth compared to the control treatment (p < 0.05). Chemotherapy also significantly increased tumor stiffness (p < 0.05) and significantly decreased (p < 0.05) tumor cell density compared with the control. Moreover, chemotherapy significantly increased the ratio of collagen fibers (p < 0.05). Tumor stiffness was positively correlated with the ratio of collagen fibers but negatively correlated with tumor cell density.
Conclusion:
The study suggests that ultrasound elastography by SE and SWE is a feasible tool for assessing early responses of breast cancer to chemotherapy in our murine xenograft model.
Advances in knowledge:
This study showed that the tumor elasticity determined by ultrasound elastography could be a feasible imaging biomarker for assessing very early therapeutic responses to chemotherapy.
INTRODUCTION
Chemotherapy is an effective option in the treatment of many cancers, either as a single-treatment regimen or as an adjunct therapy. Radiographic modalities assessing chemotherapy response have a well-established role in the management of cancer therapeutics. Reduction in tumor size, measured by metabolic (e.g. PET) or anatomic (e.g. CT or MRI) imaging, is used to assess chemotherapy response in the response evaluation criteria in solid tumors (RECIST).1 Conventional radiographic modalities, which measure tumor size, are not useful for assessing early response to therapy because tumor shrinkage is a late marker of effective chemotherapy.2 The availability of noninvasive methods for predicting or detecting therapeutic response to chemotherapy at an early stage would facilitate the rational design and individualization of therapy protocols for cancer patients and allow transition to second-line therapy in time.
Tissue elasticity or stiffness is a useful biomarker for differentiating between normal breast tissue and malignant tumors because malignant tumors have enhanced elasticity.3 Ultrasound elastography (UE), an imaging technique that can visualize tissue elasticity (stiffness) in vivo, was developed in the early 1990s.4 Currently, strain elastography (SE) and shear-wave elastography (SWE) are the two most frequently used UE techniques for examination of breast diseases. SE and SWE have been reported to have overall similar performance in diagnosing malignant and benign breast lesions.5–7 However, they are quite different in terms of the measured elasticity values and the imaging modes.8, 9 SE is a conventional UE and semi-quantitatively estimates tissue stiffness, while SWE is a relatively recent technique that quantitatively and reproducibly measures tissue elasticity. Unfortunately, the SWE function is not available for most ultrasound systems and has an increased potential of artifacts.10 In brief, SE and SWE have their own advantages and drawbacks.
UE has been suggested to be useful in assessing response to neoadjuvant therapy and in predicting response in females with invasive breast cancer.11–13 However, studies using UE to monitor tumor response to chemotherapy are very limited. The correlation between the tumor stiffness and histopathological changes at an early stage of chemotherapy is not clear. Therefore, the present study investigated the feasibility of evaluating early response of tumor to chemotherapy by measuring tissue elasticity with UE using both SE and SWE techniques in an animal xenograft breast cancer model, and explore the histopathological basis for the tumor stiffness changes associated with chemotherapy.
METHODS AND MATERIALS
Animal xenograft tumor model
The procedures for animal studies were approved by the Animal Care and Use Committee of Sun Yat-sen University Cancer Centeron, in compliance with the National Institutes of Health Guide for the Care of and Use of Laboratory Animals. Human breast cancer MCF-7 cells were grown in RPMI 1640 culture medium (Gibco, Grand Island, NY) supplemented with 10% fetal bovine serum (Gibco, Grand Island, NY), penicillin (50 U ml−1), and streptomycin (50 µg ml−1) at 37 °C in a humidified 5% CO2 atmosphere. Since the elasticity of the liver is not affected by chemotherapy, it could be used as the reference values of elastic zone. Approximately, 2.5 × 10⁷ MCF-7 cells were injected subcutaneously at the right chest wall, at the same level of the liver, of 7-week-old (about 17–19 g) BALB/c nude female mice.
Dosing of tumor-bearing animal
When the tumors had reached 5 mm at the largest cross-section, 2 weeks after cell implantation, the tumor bearing mice were randomized into four groups: treatment/SE (n = 9), treatment/SWE (n = 17), control/SE (n = 9) and control/SWE (n = 13). The treatment/SE and treatment/SWE groups received cisplatin (2 mg kg−1) plus paclitaxel (10 mg kg−1, Shenzhen Main Luck Pharmaceuticals Inc., Guangdong, China) diluted in sterile saline, and the control/SE and control/SWE groups received sterile saline by intraperitoneal (i.p.) injection, (n = 26) as well as sterile saline (n = 22) once daily for 5 consecutive days (Day 1–Day 5).
Ultrasound elastography
SE was performed by Dr Z on animals in the treatment/SE and control/SE groups, with GE Logiq S8 (GE Healthcare, USA) equipped with a ML6-15 transducer and analytic software, on Day 0 (the day before the first dosing) and Day 6 (the day after the last dosing). SWE performed by Dr W on animals in the treatment/SWE and control/SWE groups using the SuperSonic Aixplorer (SuperSonic Imagine, AixenProvence, France) equipped with a SL15-4 transducer and analytic software on Day 0 and Day 6. The examiner was blind to each other and the treatment status. Three elastography acquisitions were obtained for each tumor after repositioning the transducer for evaluation of repeatability, and the average of the three measurements was used in the analysis.
During examination, the mice were anesthetized by i.p. injection of pentobarbital sodium (75 mg kg−1; Sigma, St. Louis, MO). The stand-off gel pad (2–4 mm thick) was applied over the tumor, and the transducer was then focused on the tumor center throughout the examination. The morphological characteristics of the tumors were recorded, and the largest cross-sectional plane for the tumor was determined during the grayscale evaluation. The largest longitudinal, cross-sectional, and anteroposterior dimensions of the tumors were recorded, and the tumor volume was calculated using the formula for a prolate ellipsoid, i.e. π/6 × length × width × depth.
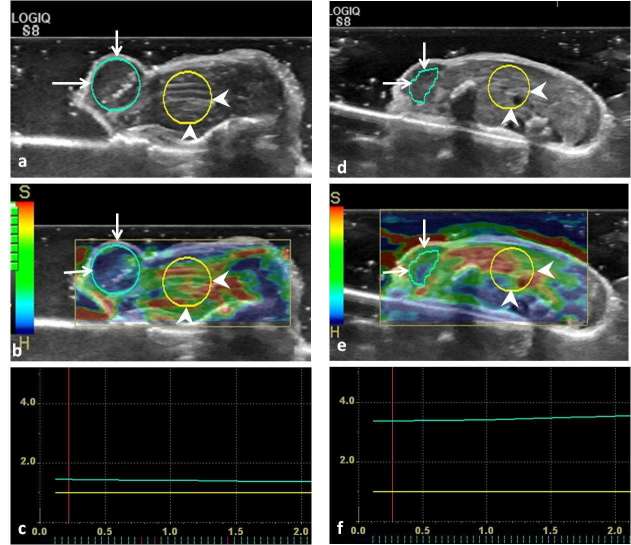
SE/SWE scans of the tumor were acquired in the largest cross-sectional plane. The quality of the SE was evaluated by seven levels of green bars, and when all seven bars appeared, the elastograms were considered satisfactory. Raw data of satisfactory elastograms were recorded as 10 s clips for offline analysis. The region of interest (ROI) encompassed nearly the entire tumor on SE. The resulting elastograms were displayed using a pseudocolor-coded map with a scale ranging from red (soft) to blue (stiff). A phase-sensitive, two-dimensional cross-correlation speckle-tracking algorithm provided by the analytic software (GE Healthcare, Milwaukee, WI) for SE was used for offline analysis. The strain ratio of SE was obtained by dividing the tumor strain by the mouse liver strain at the same depth (Figure 1).
Figure 1.
Representative strain elastograms for estimating the strain ratio of the pre-treatment and post-treatment xenograft breast tumors in nude mice. (a, d), the B-mode ultrasound images before and after treatment, respectively. In (a, b, d, e), the regions of interest of xenograft tumor and the adjacent liver are labeled with long arrows and arrowheads, respectively. (b, e), the strain elastograms before and after treatment, respectively. (c, f), the strain ratios (the ratio of tumor to the liver stiffness within ROI at the same level) of pre-treatment and post-treatment tumor were 1.51 and 3.50, respectively. ROI, region of interest.
A pseudocolor-coded map was also obtained on SWE, in which the color of each pixel represented Young’s modulus in kPa. In contrast to the SE, the map colors of SWE ranged from dark blue (soft, 0 kPa) to red (hard, 180 kPa). Young’s modulus is defined as the ratio of the stress (force per unit area) acting along an axis to the strain (ratio of deformation over initial length) produced along that axis. An optionally sized ROI trace (Q-box trace) was selected to include the tumor and the adjacent liver. The accompanying readout of the Q-box trace yielded the maximum elasticity (Emax), mean elasticity (Emean), standard deviation (SD), and SWE ratio (Emean of the tumor/Emean of the adjacent liver) (Figure 2).
Figure 2.
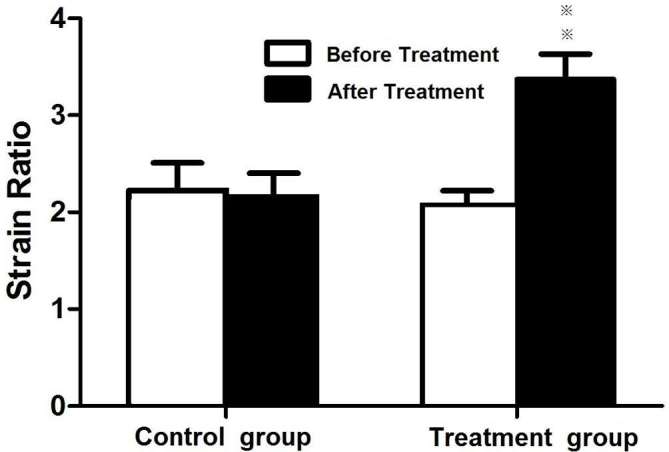
Comparison of strain ratios of tumors before and after chemotherapy. Animals with xenograft tumors were treated with vehicle (control) and cisplatin (2 mg kg–1) and paclitaxel (10 mg kg–1) (chemotherapy) once daily for 5 days.
Histopathological examination
After the mice were euthanized following the standard protocol at the end of the animal study, the tumors were removed and fixed in 10% buffered formalin before paraffin processing. The tumor specimens were sectioned at the largest cross-sections, corresponding to the largest ultrasound imaging planes. Hematoxylin and eosin staining was used to evaluate tumor cell morphology changes. Regions with the highest tumor cell density in the hematoxylin and eosin-stained sections were located by scanning the tissue sections under a 100 × microscope, and three different fields were randomly chosen within these regions at 400 × magnification. The histology images of each 400 × field were saved as JPEG images in the computer. Tumor cell density (i.e. the number of nuclei in each 400 × field) was estimated using Image-Pro Plus 6.0 software (Media Cybernetics, Silver Spring, MD). Three 400 × fields per sample were used for cell counting.
Van Gieson staining was used to assess the ratio of collagen fibers following standard procedures. After incubation in Van Gieson solution for 1 min, the sections were dehydrated by absolute alcohol and mounted by di-n-butylphthalate–polystyrene–xylene medium. The ratio of collagen fibers was assessed in “hot spots” (areas of greatest collagen fiber density). Hot spots were located by scanning the stained tumor sections at a magnification of 40×. Three hot spot areas were randomly chosen, and the ratio of individual red-staining area was evaluated at 100 × magnification using Image-Pro Plus 6.0 (Media Cybernetics, Silver Spring, MD). Using light microscopy, two observers who were blind to the tumor treatment status independently quantified the ratio of collagen fibers for each tumor section; the average of the two observers’ results was used for the statistical analysis.
Statistical analysis
All statistical analyses were performed using SPSS v. 22 (SPSS, Inc, Chicago, IL). The Cronbach’s αAlpha test was used to evaluate the consistency within the values on SE and SWE. The t test was used to compare the differences in tumor volume, strain ratio on SE, SWE Emax, Emean, SD, and SWE Ratio, tumor cell density, and the ratio of collagen fibers between the treatment group and control group. Pearson’s correlation test was used to evaluate the relationship between the strain ratio and the ratio of collagen fibers or tumor cell density. Statistical significance was set at p ≤ 0.05.
RESULTS
Effect of chemotherapy on tumor growth
Before treatment, the tumor size was similar between the treatment/SE group (0.22 ± 0.08 cm3) and control/SE group (0.23 ± 0.09) (p > 0.05), as well as between the treatment/SWE (0.22 ± 0.10 cm3) and control/SWE groups (0.21 ± 0.09 cm3) (p > 0.05) (Table 1). After treatment, the tumor size of the treatment/SE group 0.27 ± 0.08 cm3 was significantly smaller than that of the control/SE group (0.51 ± 0.10 cm3) (p < 0.001), suggesting that the chemotherapy was effective in attenuating tumor growth. Similarly, the tumor size of the treatment/SWE group (0.28 ± 0.19 cm3) was significantly smaller than that of the control/SWE group (0.48 ± 0.28 cm3) (p < 0.001) (Table 1).
Table 1.
Volumes of xenograft breast tumors before and after treatment with cisplatin (20 mg kg–1) and paclitaxel (10 mg kg–1)
| Groups (n) | Volumes before treatment (cm3) | Volumes after treatment (cm3) | p-value |
| Treatment group for SE (9) | 0.22 ± 0.28 | 0.27 ± 0.28 | 0.35 |
| Control group for SE (9) | 0.23 ± 0.09 | 0.51 ± 0.10 | <0.05 |
| Treatment group for SWE (17) | 0.22 ± 0.10 | 0.28 ± 0.19 | 0.18 |
| Control group for SWE (13) | 0.21 ± 0.09 | 0.48 ± 0.28 | <0.05 |
SE, strain elastography; SWE, shear wave elastography.
Effect of chemotherapy on tumor stiffness
All SE and SWE values showed very good consistency within the three elastography acquisition (Cronbach α >0.8). Before treatment, there were significant differences neither in the mean strain ratios of the tumor to the liver between the treatment/SE group (2.08 ± 0.44) and control/SE group (2.22 ± 0.85) (p > 0.05, Figure 2), nor in the SWE elasticity ratio of the tumor to the liver between the treatment/SWE (3.44 ± 0.60) and control/SWE groups (3.22 ± 0.70) (p > 0.05). After 5 days of treatment, the strain ratio of the treatment/SE group (3.37 ± 0.79) was significantly higher than that of the control/SE group (2.12 ± 0.73) (p < 0.01, Figures 1 and 2), suggesting that the chemotherapy increased tumor stiffness at an early time point. Similarly, the SWE elasticity ratio of the treatment/SWE group (4.85 ± 1.28) was significantly higher than that of the control/SWE group (3.04 ± 0.91) (p < 0.01, Figures 3 and 4, Tables 2 and 3).
Table 2.
Shear wave elasticity values of xenograft breast tumors before and after treatment with cisplatin (20 mg kg–1) and paclitaxel (10 mg kg–1) (n = 17)
| Before treatment | After treatment | p-value | |
| Mean-T/L ratio | 3.44 ± 0.60 | 4.85 ± 1.28 | <0.05 |
| Mean-T | 22.88 ± 4.13 | 32.81 ± 8.16 | <0.05 |
| Max-T | 38.60 ± 9.05 | 57.82 ± 15.95 | <0.05 |
| SD-T | 6.30 ± 2.26 | 9.52 ± 3.38 | 0.00 |
Mean-T/L ratio, ratio of mean elasticity value of tumor to liver; Mean-T, Max-T; SD-T, mean, maximum and standard deviation of elasticity values of tumor.
Table 3.
Shear wave elasticity values of xenograft breast tumors before and after treatment with vehicle in the control group (n = 13)
| Before treatment | After treatment | p-value | |
| Mean-T/L ratio | 3.22 ± 0.70 | 3.04 ± 0.91 | 0.38 |
| Mean-T | 20.88 ± 3.86 | 19.26 ± 5.38 | 0.13 |
| Max-T | 34.56 ± 6.73 | 38.18 ± 13.92 | 0.36 |
| SD-T | 5.24 ± 1.67 | 38.17 ± 13.92 | 0.08 |
Mean-T/L ratio, ratio of mean elasticity value of tumor to liver; Mean-T, Max-T; SD-T, mean, maximum and standard deviation of elasticity values of tumor.
Figure 3. .
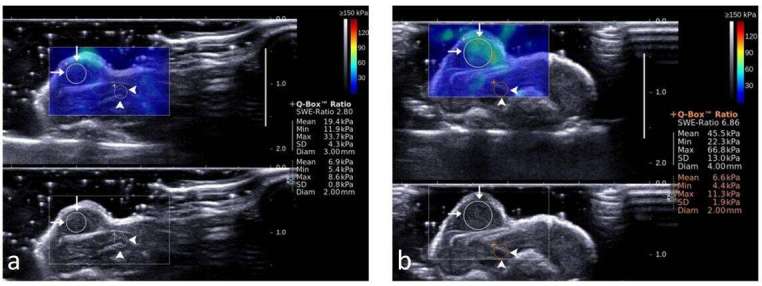
Representative shear wave elastograms of xenograft tumors in mice. (a) Before treatment, SWE ratio was 2.81, mean value of SWE in the tumor was 19.4 Kpa, max value 33.7 Kpa, SD 4.3 Kpa, mean value of SWE in the adjacent liver was 6.9 Kpa, max value 8.6 Kpa, SD 0.8 Kpa. (b), after treatment with cisplatin (2 mg kg–1) + paclitaxel (10 mg kg–1) for 5 days, SWE ratio was 6.86, mean value of SWE in the tumor was 45.5 Kpa, max value 66.8 Kpa, SD 13.0 Kpa, mean value of SWE in the adjacent liver was 6.6, max value 11.3 Kpa, SD 1.9 Kpa. ROI of xenograft tumor (long arrows) and the adjacent liver (arrow heads) are shown in circles. SD, standard deviation; SE, strain elastography; SWE, shear wave elastography; ROI, region of interest.
Effect of chemotherapy on tumor cell density and the ratio of collagen fibers
After treatment, the tumor tissue showed marked regression, steatosis, apoptosis and cell debris. The cellular areas mingled with collagen fibers, while no obvious necrotic areas were observed. Tumor cell density, as evaluated by histology in the treatment/SE group (143.18 ± 8.83 counts) per high-power field (HPF) was significantly lower than that in the control/SE group (245.37 ± 21.74 counts) per HPF (p < 0.001). The tumor cell density in the treatment/SWE group (140.80 ± 10.12 counts per HPF) was consistently and significantly lower than that in the control/SWE group (254.23 ± 24.94 counts per HPF) (p < 0.001, Figure 5a,b)
The ratio of collagen fibers as determined by Van Gieson staining in the treatment/SE group (35.80 ± 4.01%) was significantly increased compared to that in the control/SE group (20.16 ± 7.28%) (p < 0.001). Likewise, the ratio of collagen fibers in the treatment/SWE group (32.36 ± 10.15%) was significantly increased compared to that in the control/SWE group (20.48 ± 9.83%) (p < 0.001, Figure 6a,b).
Correlation of stiffness values and histopathological results
Tumor stiffness determined by the SE strain ratio was positively correlated with the ratio of collagen fibers (r = 0.563; p < 0.05) and negatively correlated with tumor cell density (r = −0.618; p < 0.01). Consistently, SWE tumor stiffness values, including elasticity ratio (r = 0.575; p < 0.05), Emax-T (r = 0.667; p < 0.05), Emean-T (r = 0.640; p < 0 .05), and SD (r = 0.519; p < 0.05), were positively correlated with the ratio of collagen fibers. Also, SWE elasticity ratio (r = −0.563; p < .05), Emax-T (r = −0.701; p < 0.05), Emean-T (r = −0.652; p < 0.05), and SD (r = −0.545; p < 0.05) were negatively correlated with tumor cell density.
DISCUSSION
In the present study, we utilized two principal UE techniques, SE and SWE, to investigate the early response (5 days after initial drug dosing) of xenograft breast tumor to chemotherapy in an animal model. We demonstrated tumor stiffness (elasticity) determined by UE was significantly increased in response to chemotherapy at an early stage when the chemotherapy with cisplatin and paclitaxel significantly inhibited the growth of the xenograft breast tumor.
The complicated nature of response to chemotherapy may substantially alter the biomechanical properties of malignant tissues.14 UE may, therefore, display differences between treatment-responding and nonresponding malignant tissues following chemotherapy. Here, a low dose of drugs was applied for chemotherapy to reduce the adverse effects and to prolong the survival time of mice. A previous study reported that, when treated with 1 mg kg–1 cisplatin or 3 mg kg–1 cisplatin once daily, tumor volume increased on days 3 and 7.15 Our data demonstrated that the tumor volume of the treatment groups stabilized after 5 days of therapy with cisplatin (2 mg kg) plus paclitaxel (10 mg kg–1). Although, neither the dosage nor the time was enough to show shrinkage of the tumor in response to chemotherapy, the stabilization of tumor size in the treatment groups suggested the effectiveness of chemotherapy, in comparison to the control group. Importantly, during this period, the elasticity change was able to be detected before the shrinkage of the tumors occurred. Our results suggest that decreasing cellularity in combination with increasing collagen fibrosis may contribute to a change in the tissue’s mechanical properties. Therefore, evaluation of tumor stiffness change by UE has a high potential for detecting early response of breast tumor to chemotherapy.
The response of tumor elasticity at an early stage of chemotherapy (within a week of treatment initiation) is variable. For example, Pepin et al demonstrated a significant decrease in MR elastography-derived tumor shear stiffness within 4 days of chemotherapy treatment in non-Hodgkin lymphoma cases compared to saline-treated cases,16 in contrast to our results. Falou et al reported that, in breast cancer patients who responded to neoadjuvant chemotherapy, no significant change in tumor elasticity was observed at 1 week after treatment initiation, although a significant decrease in tumor stiffness was displayed 4 weeks after treatment initiation.17 Moreover, in a representative responding patient, they showed that tumor stiffness increased during the first week,17 which is consistent with our results and shows that the tumor stiffness increased after 5 days chemotherapy. The very early response of tumor stiffness to chemotherapy may depend on tumor types or subtypes, and be explained by specific pathological modifications in response to chemotherapy. The response of stiffness may also change over time. In the breast cancer xenograft model, tumor stiffness decreased at 12 days after the first treatment and then increased at 12–24 days after treatment.18 The treated tumors were significantly softer than control tumors on Day 12, large areas of necrosis were observed in the treated tumors, whereas there was little necrosis in the control tumors. The study revealed that tumor stiffness was inversely correlated with the proportion of soft necrosis. But, in our study no obvious necrotic areas were observed in both treatment group and control group on Day 6, the ratio of collagen fibers in the treatment group was significantly increased compared to that in the control, and the tumor cell density was significantly decreased. Thus, specific pathological modifications in response to therapy may explain the inconsistent result of the studies.
Our results highlight the fact that although most authors reported softening of cancers under effective therapy,13, 17 response to treatment can also be associated with tumor stiffening at very early stage, and that stiffening should, therefore, not always be considered a marker of poor response to therapy.
The pathophysiological basis for the tumor stiffness changes after chemotherapy is likely to be multifactorial. The complicated nature of responses to cancer treatments, tumor cell apoptosis or death frequently results in microstructural and gross functional alterations in tumors. We found that an increase in tumor elasticity at an early stage of chemotherapy was positively correlated with collagen fiber ratio and negatively correlated with tumor cell density. We deduce that hypoxia may contribute to the increase in collagen fibrils, which results from capillary loss and decreased blood flow. Our previous study demonstrated tumor perfusion reduced 2 days after treatment with adriamycin by i.p. injection (4 mg kg–1) once daily before tumor sizes shrinking, and the tumor microvascular density decreased from Day 0 to Day 2, significantly decreased on days 4 and 6 as compared with Day 0.19 The tumor perfusion is most likely to reduce within the first 5 days after treatment initiation, thus collagen fibrils increase and cellularity decrease during chemotherapy in accordance with hypoxia. Consistent with our results, Chamming's et al demonstrated stiffness was significantly correlated with tumor fibrosis in a mouse xenograft breast cancer model.20 They quantitatively assessed stiffness using SWE during tumor growth and correlated the results with pathological features. They deduced that the vessel supply was not sufficient in the largest tumors, the cellular tissue decreased slightly and was replaced by fibrosis, which might, therefore, be responsible for the highest values of stiffness.20 Thus, fibrosis plays an important role in stiffness as measured by UE. In liver diseases, it has also been shown that fibrosis was related to increased stiffness.21, 22
This study has several limitations. First, calculating tumor stiffness in a single tumor section may have introduced a bias because tumor tissue is heterogeneous in volume. The quantification of tumor stiffness in the whole tumor volume could improve the relevance of the strain ratio calculated from SE. Second, only one measurement (ROI) was taken of the small lesions, and the same radiologist carried out all of the measurements; therefore, the inter- and intraobserver variability remain uncertain. Third, although xenografted tumors are well-accepted and important experimental model systems, they obviously do not mimic human tumor behavior exactly. Therefore, these findings must be confirmed in clinical studies.
In conclusion, this study showed that UE can detect changes in tumor stiffness within 5 days after chemotherapy initiation in an animal breast cancer model; therefore, tumor elasticity determined by UE could be developed as a biomarker for assessing very early tumor response to chemotherapy.
Figure 4. .
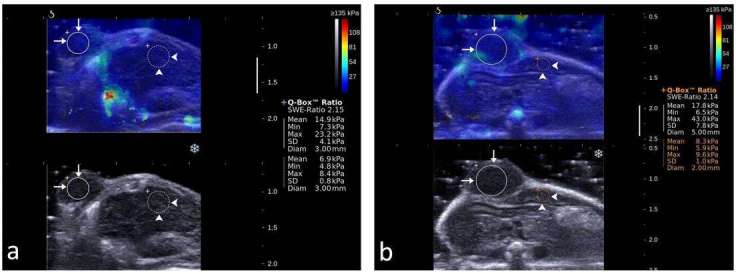
Representative shear wave elastograms of control xenograft tumors in mice. (a) before receiving sterile saline, SWE ratio was 2.15, mean value of SWE in the tumor was 14.9, max value 23.2 Kpa, SD 4.1 Kpa, mean value of SWE in the adjacent liver was 6.9Kpa, max value 8.4 Kpa, SD 0.8 Kpa. (b) after receiving sterile saline, SWE ratio was 2.14, mean value of SWE in the tumor was 17.8, max value 43.0 Kpa, SD 7.8 Kpa, mean value of SWE in the adjacent liver was 8.3 Kpa, max value 9.6 Kpa, SD 1.0 Kpa. ROI of xenograft tumor (long arrows) and the adjacent liver (arrowheads) are shown in circles. SWE, shear wave elastography. ROI, region of interest.
Figure 5. .
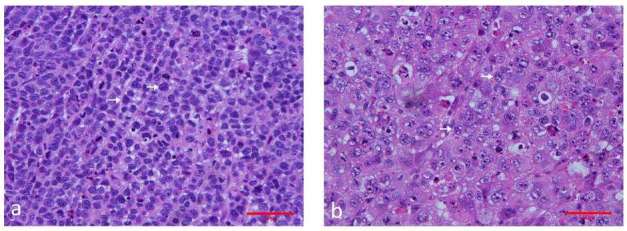
Representative images of hematoxylin and eosin–stained sections of the control and treated xenograft breast tumor in nude mice. (a) xenograft tumor of the control group. The tumor cells are tightly packed and most have large darkly stained nuclei. Original magnification, ×400. (b) xenograft tumors treated with cisplatin (2 mg kg–1) + paclitaxel (10 mg kg–1) for 5 days. The tumor tissue shows marked regression, steatosis, apoptosis and cell debris. Original magnification, ×400.
Figure 6. .
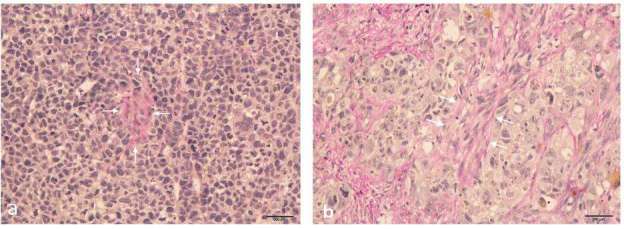
Representative images of Van Gieson-stained sections of the control and treated xenograft breast tumors in mice. (a) sections of the control group, (b) xenograft tumors treated with cisplatin (2mg kg–1) + paclitaxel (10 mg kg–1) for 5 days. The red areas (long arrows) represent positive staining for collagen fibers. Original magnification, ×100.
Contributor Information
Jian-Wei Wang, Email: wangjw@sysucc.org.cn.
Zhi-Xing Guo, Email: guozx@sysucc.org.cn.
Qing-Guang Lin, Email: linqg@sysucc.org.cn.
Wei Zheng, Email: zhengwei@sysucc.org.cn.
Shu-Lian Zhuang, Email: zhuangshuli.an@163.com.
Shi-Yang Lin, Email: linshy1@sysucc.org.cn.
An-Hua Li, Email: liah@sysucc.org.cn.
Xiao-Qing Pei, Email: peixq@sysucc.org.cn.
REFERENCES
- 1.Therasse P, Arbuck SG, Eisenhauer EA, Wanders J, Kaplan RS, Rubinstein L, et al. . New guidelines to evaluate the response to treatment in solid tumors. European organization for research and treatment of cancer, national cancer institute of the United States, national cancer institute of Canada. J Natl Cancer Inst 2000; 92: 205–16. [DOI] [PubMed] [Google Scholar]
- 2.Meyer CR, Armato SG, Fenimore CP, McLennan G, Bidaut LM, Barboriak DP, et al. . Quantitative imaging to assess tumor response to therapy: common themes of measurement, truth data, and error sources. Transl Oncol 2009; 2: 198–210. doi: 10.1593/tlo.09208 [DOI] [PMC free article] [PubMed] [Google Scholar]
- 3.Faruk T, Islam MK, Arefin S, Haq MZ. The journey of elastography: background, current status, and future possibilities in breast cancer diagnosis. Clin Breast Cancer 2015; 15: 313–24. doi: 10.1016/j.clbc.2015.01.002 [DOI] [PubMed] [Google Scholar]
- 4.Ophir J, Céspedes I, Ponnekanti H, Yazdi Y, Li X. Elastography: a quantitative method for imaging the elasticity of biological tissues. Ultrason Imaging 1991; 13: 111–34. doi: 10.1177/016173469101300201 [DOI] [PubMed] [Google Scholar]
- 5.Shiina T, Nightingale KR, Palmeri ML, Hall TJ, Bamber JC, Barr RG, et al. . WFUMB guidelines and recommendations for clinical use of ultrasound elastography: part 1: basic principles and terminology. Ultrasound Med Biol 2015; 41: 1126–47. doi: 10.1016/j.ultrasmedbio.2015.03.009 [DOI] [PubMed] [Google Scholar]
- 6.Kim SY, Park JS, Koo HR. Combined use of ultrasound elastography and B-mode sonography for differentiation of benign and malignant circumscribed breast masses. J Ultrasound Med 2015; 34: 1951–9. doi: 10.7863/ultra.14.11027 [DOI] [PubMed] [Google Scholar]
- 7.Youk JH, Gweon HM, Son EJ. Shear-wave elastography in breast ultrasonography: the state of the art. Ultrasonography 2017; 36: 300–9. doi: https://doi.org/10.14366/usg.17024 [DOI] [PMC free article] [PubMed] [Google Scholar]
- 8.Lee SH, Chang JM, Cho N, Koo HR, Yi A, Kim SJ, et al. . Practice guideline for the performance of breast ultrasound elastography. Ultrasonography 2014; 33: 3–10. doi: https://doi.org/10.14366/usg.13012 [DOI] [PMC free article] [PubMed] [Google Scholar]
- 9.Barr RG, Nakashima K, Amy D, Cosgrove D, Farrokh A, Schafer F, et al. . WFUMB guidelines and recommendations for clinical use of ultrasound elastography: part 2: breast. Ultrasound Med Biol 2015; 41: 1148–60. doi: 10.1016/j.ultrasmedbio.2015.03.008 [DOI] [PubMed] [Google Scholar]
- 10.Deffieux T, Gennisson JL, Bercoff J, Tanter M. On the effects of reflected waves in transient shear wave elastography. IEEE Trans Ultrason Ferroelectr Freq Control 2011; 58: 2032–5. doi: 10.1109/TUFFC.2011.2052 [DOI] [PubMed] [Google Scholar]
- 11.Evans A, Armstrong S, Whelehan P, Thomson K, Rauchhaus P, Purdie C, et al. . Can shear-wave elastography predict response to neoadjuvant chemotherapy in women with invasive breast cancer? Br J Cancer 2013; 109: 2798–802. doi: 10.1038/bjc.2013.660 [DOI] [PMC free article] [PubMed] [Google Scholar]
- 12.Jing H, Cheng W, Li ZY, Ying L, Wang QC, Wu T, et al. . Early evaluation of relative changes in tumor stiffness by shear wave elastography predicts the response to neoadjuvant chemotherapy in patients with breast cancer. J Ultrasound Med 2016; 35: 1619–27. doi: 10.7863/ultra.15.08052 [DOI] [PubMed] [Google Scholar]
- 13.Ma Y, Zhang S, Zang L, Li J, Li J, Kang Y, et al. . Combination of shear wave elastography and Ki-67 index as a novel predictive modality for the pathological response to neoadjuvant chemotherapy in patients with invasive breast cancer. Eur J Cancer 2016; 69: 86–101. doi: 10.1016/j.ejca.2016.09.031 [DOI] [PubMed] [Google Scholar]
- 14.Pepin KM, Chen J, Glaser KJ, Mariappan YK, Reuland B, Ziesmer S, et al. . MR elastography derived shear stiffness-a new imaging biomarker for the assessment of early tumor response to chemotherapy. Magn Reson Med 2014; 71: 1834–40. doi: 10.1002/mrm.24825 [DOI] [PMC free article] [PubMed] [Google Scholar]
- 15.Chen Y, Han F, Cao LH, Li C, Wang JW, Li Q, et al. . Dose-response relationship in cisplatin-treated breast cancer xenografts monitored with dynamic contrast-enhanced ultrasound. BMC Cancer 2015; 15: 136–45. doi: 10.1186/s12885-015-1170-8 [DOI] [PMC free article] [PubMed] [Google Scholar]
- 16.Pepin KM, Chen J, Glaser KJ, Mariappan YK, Reuland B, Ziesmer S, et al. . MR elastography derived shear stiffness-a new imaging biomarker for the assessment of early tumor response to chemotherapy. Magn Reson Med 2014; 71: 1834–40. doi: 10.1002/mrm.24825 [DOI] [PMC free article] [PubMed] [Google Scholar]
- 17.Falou O, Sadeghi-Naini A, Prematilake S, Sofroni E, Papanicolau N, Iradji S, et al. . Evaluation of neoadjuvant chemotherapy response in women with locally advanced breast cancer using ultrasound elastography. Transl Oncol 2013; 6: 17–24. doi: 10.1593/tlo.12412 [DOI] [PMC free article] [PubMed] [Google Scholar]
- 18.Chamming’s F, Le-Frère-Belda MA, Latorre-Ossa H, Fitoussi V, Redheuil A, Assayag F, et al. . Supersonic shear wave elastography of response to anti-cancer therapy in a Xenograft tumor model. Ultrasound Med Biol 2016; 42: 924–30. doi: 10.1016/j.ultrasmedbio.2015.12.001 [DOI] [PubMed] [Google Scholar]
- 19.Wang JW, Zheng W, Liu JB, Chen Y, Cao LH, Luo RZ, et al. . Assessment of early tumor response to cytotoxic chemotherapy with dynamic contrast-enhanced ultrasound in human breast cancer xenografts. PLoS One 2013; 8: e58274. doi: 10.1371/journal.pone.0058274 [DOI] [PMC free article] [PubMed] [Google Scholar]
- 20.Chamming's F, Latorre-Ossa H, Le Frère-Belda MA, Fitoussi V, Quibel T, Assayag F, et al. . Shear wave elastography of tumour growth in a human breast cancer model with pathological correlation. Eur Radiol 2013; 23: 2079–86. doi: 10.1007/s00330-013-2828-8 [DOI] [PubMed] [Google Scholar]
- 21.Ziol M, Kettaneh A, Ganne- Carrié N, Barget N, Tengher-Barna I, Beaugrand M. Relationships between fibrosis amounts assessed by morphometry and liver stiffness measurements in chronic hepatitis or steatohepatitis. Eur J Gastroenterol Hepatol 2009; 21: 1261–8. doi: 10.1097/MEG.0b013e32832a20f5 [DOI] [PubMed] [Google Scholar]
- 22.Herrmann E, de Lédinghen V, Cassinotto C, Chu WC, Leung VY, Ferraioli G, et al. . Assessment of biopsy-proven liver fibrosis by two-dimensional shear wave elastography: an individual patient data-based meta-analysis. Hepatology 2018; 67: 260–72. doi: 10.1002/hep.29179 [DOI] [PMC free article] [PubMed] [Google Scholar]


