Abstract
Objective:
18F-Fluciclovine (FACBC) is an amino acid PET radiotracer approved for recurrent prostate cancer imaging. We investigate the use of Bayesian penalised likelihood (BPL) reconstruction for 18F-fluciclovine PET.
Methods:
15 18F-fluciclovine scans were reconstructed using ordered subset expectation maximisation (OSEM), OSEM + point spread function (PSF) modelling and BPL using β-values 100–600. Lesion maximum standardised uptake value (SUVmax), organ SUVmean and standard deviation were measured.
Deidentified reconstructions (OSEM, PSF, BPL using β200–600) from 10 cases were visually analysed by two readers who indicated their most and least preferred reconstructions, and scored overall image quality, noise level, background marrow image quality and lesion conspicuity.
Results:
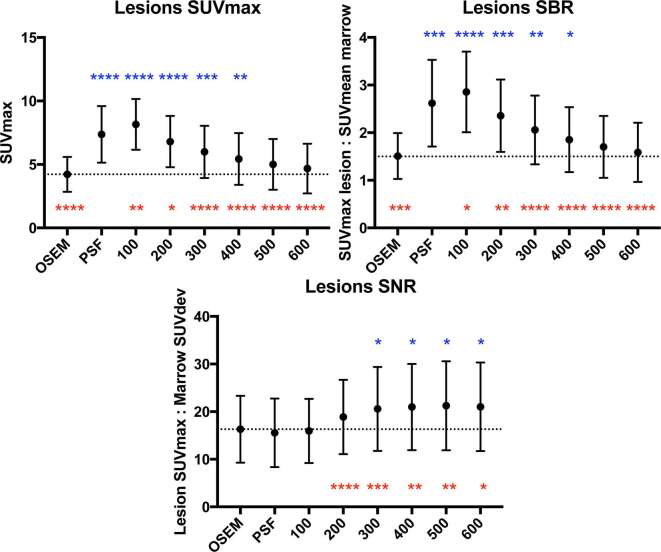
Comparing BPL to OSEM, there were significant increments in lesion SUVmax and signal-to-background up to β400, with highest gain in β100 reconstructions (mean ΔSUVmax 3.9, p < 0.0001). Organ noise levels increased on PSF, β100 and β200 reconstructions. Across BPL reconstructions, there was incremental reduction in organ noise with increasing β, statistically significant beyond β300–500 (organ-dependent). Comparing with OSEM and PSF, lesion signal-to-noise was significantly increased in BPL reconstructions where β ≥ 300 and ≥ 200 respectively.
On visual analysis, β 300 had the first and second highest scores for image quality, β500 and β600 equal highest scores for marrow image quality and least noise, PSF and β 200 had first and second highest scores for lesion conspicuity. For overall preference, one reader preferred β 300 in 9/10 cases and the other preferred β 200 in all cases.
Conclusion:
BPL reconstruction of 18F-fluciclovine PET images improves signal-to-noise ratio, affirmed by overall reader preferences. On balance, β300 is suggested for 18F-fluciclovine whole body PET image reconstruction using BPL.
Advances in knowledge:
The optimum β is different to that previously published for 18F-fluorodeoxyglucose, and has practical implications for a relatively new tracer in an environment with modern reconstruction technologies.
Introduction
The optimisation of Bayesian penalised likelihood (BPL) reconstruction (Q.Clear, GE Healthcare) for 18F-fluorodeoxyglucose (FDG) whole body PET,1 and its effect on evaluating various clinical entities on 18F-FDG PET/CT have been reported.2–5 BPL runs to effective convergence and includes point spread function (PSF) modelling while controlling noise through the use of a penalty term (β), which achieves greater noise reduction as β is increased.1 It has been shown to improve lesion signal-to-noise ratio (SNR) on 18F-FDG PET compared to widely utilised ordered subset expectation maximisation (OSEM) reconstruction, particularly in small, subcentimetre abnormalities.2 Our institution currently uses BPL reconstructed images (β = 400)1 for the clinical interpretation of all 18F-FDG whole body PET/CT studies.
The burgeoning repertoire of non-FDG PET tracers coupled with progressive adaptation of modern image reconstruction technology demands tracer-specific optimisation of its use. This is due to inherent variation of physiological distribution and degree of pathological uptake observed between different tracers. More importantly, the practice of image optimisation remains paramount to maintaining duty of care to the patient.
18F-Fluciclovine (anti-1-amino-3-fluorocyclobutane-1-carboxylic acid/FACBC) is a synthetic amino acid PET radiotracer with expectant clinical demand, followed recent approvals by the Food and Drug Administration and European Medicines Agency as a diagnostic agent for detection of recurrent prostate cancer.6, 7 The aim of this study was to compare BPL to standard PET reconstruction of 18F-fluciclovine images and determine the optimum penalisation factor (β) for clinical use of BPL in 18F-fluciclovine imaging.
Patients and methods
Case selection
This study was approved by the South Central Berkshire Research Ethics Committee. Fifteen 18F-fluciclovine whole body scans performed consecutively between October 2015 and August 2016 for biochemical recurrence of prostate cancer were retrospectively selected. The median patient weight was 77.3 kg (range 56–102 kg).
18F-Fluciclovine PET/CT imaging protocol
Image acquisition was performed on a 3D-mode time-of-flight GE Discovery 710 PET/CT system (GE Healthcare, Milwaukee, WI). Patients were required to fast for at least 4 h before injection. Imaging commenced 3–5 min post-injection of 18F-fluciclovine (327 to 418 MBq) covering the skull base to proximal thighs. PET images were acquired under normal tidal respiration, commencing caudally, for 5 min per bed position for the first two bed positions (over the pelvis), and 3 min per bed position for the remaining acquisition.
Semi-quantitative analysis
Sinograms of the 15 scans were reconstructed using three different algorithms, each of which used the CT scan for attenuation correction and the same normalisation correction factors with scatter and randoms corrected as has been previously described.8 The first algorithm was OSEM (ToF OSEM, VPFX, GE Healthcare), used with 2 i, 24 ss and 6.4 mm filter. The second was using OSEM + PSF, henceforth referred to as PSF (ToF OSEM PSF, 3 i, 24 ss, 2 mm filter),1 and the third was BPL using a range of penalisation factors (β): 100, 200, 300, 400, 500 and 600.
The following parameters were measured on each of the reconstructions: lesion maximum standardised uptake value (SUVmax), SUVmean and standard deviation (SUVdev, noise) of reference organs (marrow, spleen, blood pool, liver). Lesions were defined as small foci of presumed local or distant recurrence. SUVmax of each lesion was recorded using a standard volume of interest (VOI) tool. Organ SUVs were measured as follows: marrow–L3 vertebra using a 1.5 cm edge cube VOI, spleen–interpolar region using a 2.0 cm diameter spherical VOI, blood pool–mid-thoracic aorta using a 1.0 cm diameter, 2.0 cm long cylindrical VOI, liver–right lobe of liver using a 3.0 cm diameter spherical VOI. SNR and signal-to-background ratio (SBR) were calculated. Lesion SNR was defined as lesion SUVmax divided by marrow SUVdev. Lesion SBR was defined as lesion SUVmax divided by marrow SUVmean. Marrow uptake was used for normalisation based on the moderate and heterogeneous 18F-fluciclovine uptake seen in this organ. Organ SNR was calculated as organ SUVmean divided by organ SUVdev.
Statistical analysis
Statistical comparisons were made with reference to both OSEM and PSF, using repeated measures ANOVA with Dunnett’s multiple comparison post-hoc testing. Statistical analyses were performed using GraphPad Prism v. 7.0 a (GraphPad Software, La Jolla, CA). Differences in SUV were denoted by “ΔSUV”. p-values < 0.05 were considered to be statistically significant. Inter-reader agreement in the visual analysis was evaluated using weighted Cohen’s κ with linear weights. κ values were interpreted using guidelines laid out by Landis and Koch.9
Clinical evaluation—reconstruction and visual analyses
Ten of the 15 scans were used for this component of the study. Visual analyses of the OSEM, PSF, BPL β200–600 reconstructions, were performed by two consultants (designated Reader 1 and 2) with dual accreditation in clinical radiology and nuclear medicine, both with more than 10 years of nuclear medicine subspecialty experience. Having previously described similarities between BPL β100 and PSF in (greater) image noise,1 reaffirmed by subsequent results of the semi-quantitative analysis, β100 was omitted from the visual analyses.
The reconstructions were labelled A to G in a randomised order, with the CT component available for image fusion and non-attenuation corrected images for reference. Cases were reviewed sequentially, and reconstructions were scored (from 1 to 5) according to four image quality parameters: overall image quality, lesion conspicuity, overall noise level and marrow image quality. Readers were provided with guidance on features which should constitute each score (Table 1). For every reconstruction, a final score for each parameter was derived from the sum of scores given to the relevant parameter for the particular reconstruction. For example, the final score for lesion conspicuity in OSEM would be a sum of the individual scores for this parameter in OSEM reconstructions across the 10 cases.
Table 1.
Scoring system applied to the four image quality parameters in the visual analysis
| Score | Overall image quality/lesion conspicuity | Overall noise level (excluding marrow)/background marrow image quality |
| 1 | Not reportable | Non-diagnostic |
| 2 | Poor | Numerous heterogeneities throughout entire study, reduced diagnostic quality |
| 3 | Satisfactory | Numerous small heterogeneities |
| 4 | Good | Minimal heterogeneities |
| 5 | Excellent | No significant noise |
Readers indicated their most and least preferred reconstruction for each case. Proportions of the highest and lowest ranked reconstructions were calculated for each parameter.
Results
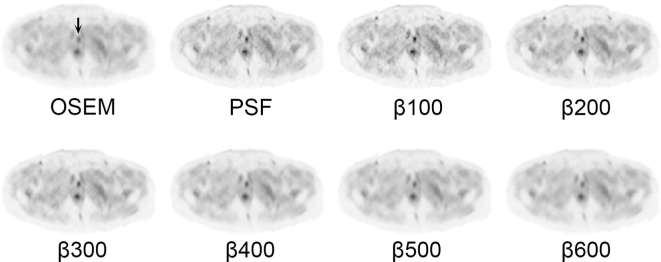
Results for the semi-quantitative analyses are summarised in Figures 1–4, and a representative image for each reconstruction is presented in Figure 5. Compared to OSEM, lesion SUVmax and SBR increased in β100–400 and PSF, with highest gain in β100 reconstructions (mean ΔSUVmax 3.9, p < 0.0001) (Figure 1). Lesion SNR was increased in BPL reconstructions compared to OSEM where β ≥ 300 (Figure 1), with no significant intergroup difference between β300–600 (p = 0.562). When compared to PSF, lesion SNR was increased in all BPL reconstructions (p = 0.0001–0.021), with the exception of β100.
Figure 1.
Graphs of lesion SUVmax, SBR and SNR across the different reconstructions (mean ± standard deviation, dotted line represents mean value on OSEM reconstruction). Statistical comparisons to OSEM are represented above the data points, and comparisons to PSF are represented below the data points (*p < 0.05, **p ≤ 0.01, ***p ≤ 0.001, ****p ≤ 0.0001). OSEM, ordered subset expectation maximisation; SBR, signal-to-background ratio; SNR, signal-to-noise ratio; SUV, standardised uptake value.
Figure 2.
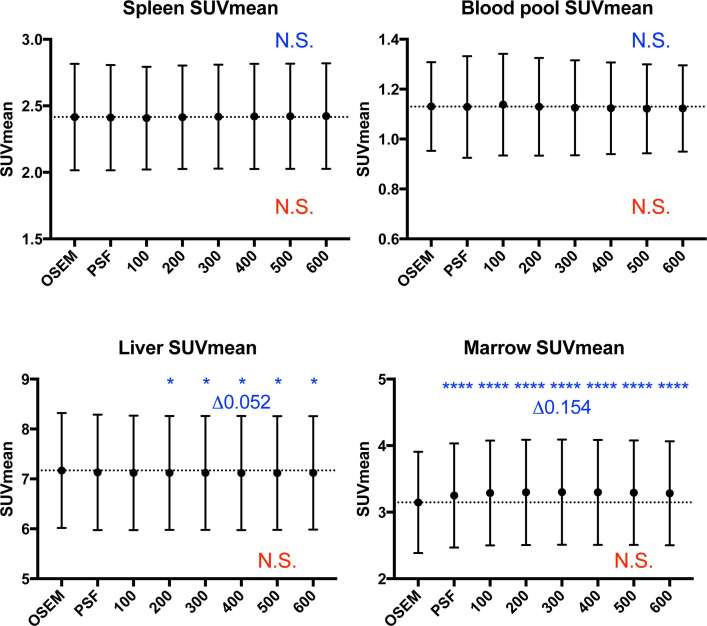
Graphs of organ SUVmean (mean ± standard deviation, dotted line represents mean value on OSEM reconstruction). While there were statistically significant differences between OSEM and the other reconstructions in the liver and marrow (highest ΔSUVmean 0.052 and 0.154 respectively), these were deemed clinically insignificant. Statistical comparisons to OSEM are represented in blue above the data points, and comparisons to PSF are represented in red below the data points (*p < 0.05, ****p ≤ 0.0001). OSEM, ordered subset expectation maximisation; PSF, point spread function; SUV, standardised uptake value.
Figure 3.
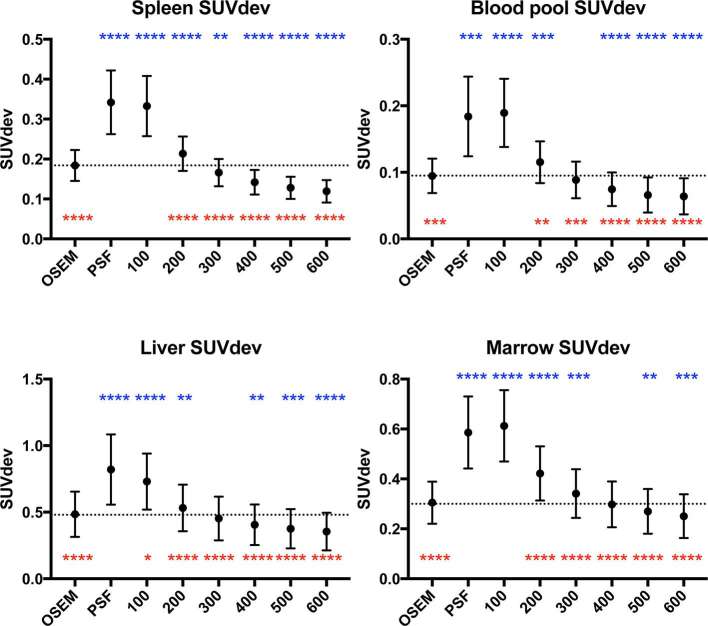
Graphs of organ SUVdev (mean ± standard deviation, dotted line represents mean value on OSEM reconstruction). Statistical comparisons to OSEM are represented in blue above the data points, and comparisons to PSF are represented in red below the data points (*p < 0.05 **p ≤ 0.01, ***p ≤ 0.001, ****p ≤ 0.0001). OSEM, ordered subset expectation maximisation; PSF, point spread function; ; SUV, standardised uptake value.
Figure 4.
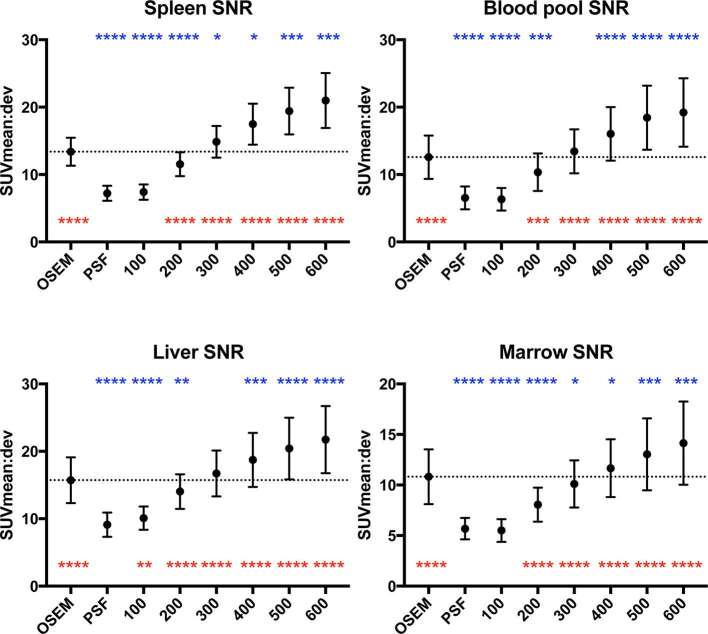
Graphs of organ SNR across the different reconstructions (mean ± standard deviation, dotted line represents mean value on OSEM reconstruction). Statistical comparisons to OSEM are represented in blue above the data points, and comparisons to PSF are represented in red below the data points (*p < 0.05, **p ≤ 0.01, ***p ≤ 0.001, ****p ≤ 0.0001). OSEM, ordered subset expectation maximisation; PSF, point spread function; SNR, signal-to-noise ratio; SUV, standardised uptake value.
Figure 5.
Axial images at the level of the pubic symphysis. Different reconstructions demonstrating a subcentimetre 18F-fluciclovine-avid focus of disease (arrow) in the anterior prostatectomy bed. Consistent with the semi-quantitative results, the lesion is rendered more conspicuous on BPL reconstructions with relatively less background noise. All images are displayed on SUV scale 0–6. OSEM, ordered subset expectation maximisation; PSF, point spread function; SUV, standardised uptake value.
Comparing to OSEM, there was no change in SUVmean of spleen and blood pool across all reconstructions (Figure 2). While such changes in the liver and marrow were statistically significant (Figure 2), these were deemed clinically insignificant (highest ΔSUVmean: 0.052 in liver, 0.154 in marrow). There was no change in SUVmean of all the organs when comparison was made to PSF.
Across the BPL reconstructions, there was an incremental reduction in organ noise with increasing β, which compared to OSEM, were significant beyond β300–500 (organ-dependent) (Figure 3). Compared to OSEM, organ noise levels increased on PSF, β100 and β200 reconstructions (Figure 3). This trend was also demonstrated in organ SNR, with statistically significant gains (over OSEM) in marrow, liver and blood pool when β ≥ 400, and the spleen when β ≥ 300 (Figure 4). The opposite trend was observed when comparisons were made to PSF where noise was significantly lower, and SNR significantly higher, in all organs where β ≥ 200 (Figures 3 and 4).
In the clinical evaluation, there was moderate agreement in scores between the two readers [κ = 0.48, 95% CI (0.40–0.56)]. β300 had the first and second highest scores (between both readers) for overall image quality, PSF and β200 had first and second highest scores for lesion conspicuity, β500 and β600 had joint highest scores for marrow image quality and overall noise level (i.e. least noise) (Table 2). These findings complemented those of the semi-quantitative analyses.
Table 2.
Scores of image quality parameters in the visual analysis
| Reconstruction | Overall image quality | Lesion conspicuity | Overall noise level | Background marrow image quality | ||||
| Reader 1 | Reader 2 | Reader 1 | Reader 2 | Reader 1 | Reader 2 | Reader 1 | Reader 2 | |
| OSEM | 34 | 37 | 19 | 20 | 43 | 36 | 44 | 39 |
| PSF | 27 | 39 | 30 | 29 | 22 | 21 | 21 | 20 |
| β 200 | 36 | 50 | 30 | 28 | 33 | 33 | 31 | 29 |
| β 300 | 50 | 47 | 27 | 22 | 44 | 39 | 44 | 33 |
| β 400 | 45 | 40 | 22 | 22 | 49 | 45 | 49 | 41 |
| β 500 | 39 | 30 | 21 | 16 | 50 | 50 | 50 | 50 |
| β 600 | 36 | 30 | 19 | 15 | 50 | 50 | 50 | 50 |
OSEM, ordered subset expectation maximisation; PSF, point spread function.
For every reconstruction, a final score for each image quality parameter was derived from the sum of scores given to the relevant parameter for the particular reconstruction.
In terms of overall preferences, Reader 1 preferred β300 in 90% of cases and Reader 2 preferred β200 in all cases. There was a greater polarisation of opinion with regards to least preferred reconstructions, with Reader 1 indicating PSF in 80% and Reader 2 chose β600 in 90% of cases.
Discussion
The aim of this study was to compare BPL to standard PET reconstruction of 18F-fluciclovine images and determine the optimum penalisation factor (β) for clinical use of BPL in 18F-fluciclovine whole body imaging. This was addressed using a combination of semi-quantitative and visual analyses performed on a range of reconstructions of clinical scans.
Consistent with prior observations,1–5 the majority of BPL reconstructions demonstrated an increase in lesion signal and reduction in noise over OSEM. While lesion signal was higher in the PSF reconstruction compared to BPL reconstructions β ≥ 200, this came at a significant detriment to image noise, which was consistently lower in these BPL reconstructions (β ≥ 200) and widely used OSEM reconstruction (Figure 3). This reinforces observations from our prior work and others,1, 10 and is the basis for non-adoption of PSF in our institution when initially released.
The increase in lesion signal (SUVmax, SBR) compared to OSEM reached statistical significance in the BPL reconstructions up to β400 (Figure 1), while that of noise level showed a decrease in three out of four organs (one statistically significant) at β300 (Figure 3). At β400 and higher, noise was decreased in all organs compared to OSEM (three statistically significant at β400, Figure 3). Accordingly, an increase in lesion SNR was demonstrated in all reconstructions at β300 and higher, with no statistical advantage on semi-quantitative parameters, of one reconstruction over the other beyond this point (Figure 1). These collective findings tentatively placed either β300 or β400 as the optimal BPL reconstruction setting.
The visual analysis proved useful in stratifying this outcome. Between the readers, β300 had the first and second highest scores for overall image quality of clinical scans, while β400 scored second and third highest respectively. This trend was also mirrored in scoring of lesion conspicuity where, after PSF and β200 (which demonstrate a detrimental increase in noise despite signal gain), β300 was scored higher than β400 by both readers.
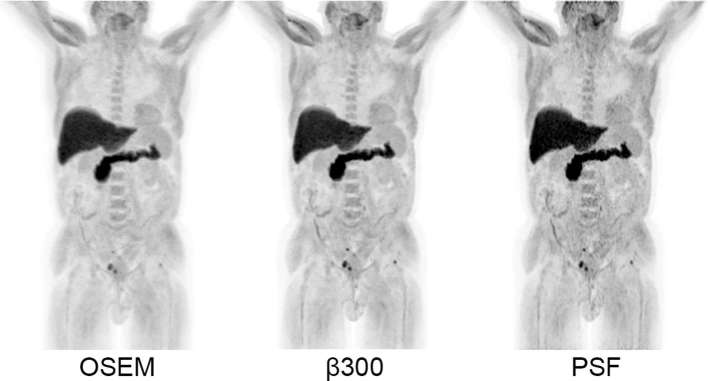
β300 was indicated as the most preferred reconstruction in 9 out of 10 cases by one reader. On balance, the relatively minor difference in overall reader preference is deemed relatively immaterial to the strength of the other overarching findings. Therefore, β300 should be considered as the optimal penalisation factor for BPL reconstruction of 18F-fluciclovine PET images. A case example is presented in Figure 6.
Figure 6.
Maximum intensity projection images (SUV scale 0–7) of a patient demonstrating small foci of disease recurrence in the pelvis and left femoral head, rendered more conspicuous on the BPL β 300 reconstruction compared to OSEM, but without the penalty of increased noise depicted on the PSF reconstruction. OSEM, ordered subset expectation maximisation; PSF, point spread function; SUV, standardised uptake value.
Our findings are important because the use of newer PET reconstruction algorithms incorporating PSF modelling such as BPL may have implications for the interpretation of oncological PET/CT, particularly as it has been shown to increase sensitivity at a cost of reduced specificity for a given SUV threshold.2 Adoption of new reconstruction algorithms into well-established clinical practice, notably with interpreting 18F-FDG PET, demands dedication on the part of the reader to recalibrate their approach to reading studies. Widespread adoption of advanced reconstruction algorithms is challenging due to the highly variant experience with 18F-FDG PET reconstruction across the globe, which has been in constant iteration since the use of filtered back projection and 2D-mode scanning.
The landscape is encouragingly different with 18F-fluciclovine, which has recently been approved for a focused clinical indication (recurrent prostate cancer), with interpretation guidelines built on cumulative experience of a small consortia of readers using relatively modern scanner and reconstruction technology.11, 12 Furthermore, being an amino acid, it may be less fallible to non-specific uptake by inflammatory/benign entities compared to 18F-FDG as described in vitro,13 and anecdotally in published literature.14, 15
The difference in optimal β compared to 18F-FDG whole body PET, previously described to be β400,1 can be explained by the differences in physiological distribution and pathological uptake compared to 18F-fluciclovine. In prostate cancer, nodal recurrence tends to occur within the pelvis and retroperitoneum, where adjacent background uptake is relatively low. Improved demonstration of pathological uptake, particularly in small nodes, would then be afforded by a relatively low β, which generates increased signal at minimal penalty to surrounding background noise.
Being in the early stages of clinical rollout, there is an opportunity for naïve readers to gain their formative clinical experience with 18F-fluciclovine interpretation based on advanced image reconstruction from the start. Apart from affording a step-up in patient care, through improved image quality and confidence in interpretation, this should avoid the unnecessary complexities of relearning should current mainstream reconstruction technology get eclipsed.
Our experience with this process supports an ongoing collaborative effort amongst academic leaders and industry involved in this and other novel radiotracers, to maintain clear interpretation guidelines based on collective experience with different reconstruction technologies. This has to be supported by prospective study of diagnostic performance based on advanced reconstruction technology, and retrospective evaluation of the like where possible, using the same approach as this study, exploiting saved sinogram data. We also propose these actions for forthcoming imaging agents as they attain regulatory approval.
There are limitations to consider in this study. It was not possible to completely blind the scorers to the different reconstruction algorithms, as BPL has a different visual appearance compared to PSF at all -values, and to OSEM to a limited extent. This may have introduced bias as readers progressed through the scoring process, mitigated to some extent by the wide range of BPL reconstructions used. Finally, caution should be adopted in the event of expanded clinical use for 18F-fluciclovine, and revisiting optimisation of image reconstruction based on disease type and/or organ of interest, particularly the brain, may be warranted.
Conclusion
BPL reconstruction of 18F-fluciclovine PET images improves SNR, affirmed by overall reader preferences for BPL reconstructions. On balance, β300 is suggested for 18F-fluciclovine whole body PET image reconstruction using BPL.
Acknowledgements
We acknowledge support from the CRUK/EPSRC Cancer Imaging Centre in Oxford and the NIHR Oxford Biomedical Research Centre Programme. The views expressed are those of the authors and not necessarily those of the NHS, NIHR, or U.K. Department of Health.
Contributor Information
Eugene J Teoh, Email: eugene.teoh@oncology.ox.ac.uk.
Daniel R McGowan, Email: daniel.mcgowan@oncology.ox.ac.uk.
David M Schuster, Email: dschust@emory.edu.
Maria T Tsakok, Email: maria.tsakok@ouh.nhs.uk.
Fergus V Gleeson, Email: fgleeson@mac.com.
Kevin M Bradley, Email: kevin.bradley@ouh.nhs.uk.
Disclosure
ET is receiving research support through Oxford University Hospitals NHS Foundation Trust from Blue Earth Diagnostics Ltd. DMS has participated in sponsored research involving 18F-fluciclovine, among other radiotracers. Emory University is eligible to receive royalties for 18F-fluciclovine.
REFERENCES
- 1.Teoh EJ, McGowan DR, Macpherson RE, Bradley KM, Gleeson FV. Phantom and clinical evaluation of the bayesian penalized likelihood reconstruction algorithm Q.Clear on an LYSO PET/CT system. J Nucl Med 2015; 56: 1447–52. doi: 10.2967/jnumed.115.159301 [DOI] [PMC free article] [PubMed] [Google Scholar]
- 2.Teoh EJ, McGowan DR, Bradley KM, Belcher E, Black E, Gleeson FV. Novel penalised likelihood reconstruction of PET in the assessment of histologically verified small pulmonary nodules. Eur Radiol 2016; 26: 576–84. doi: 10.1007/s00330-015-3832-y [DOI] [PMC free article] [PubMed] [Google Scholar]
- 3.Teoh EJ, McGowan DR, Bradley KM, Belcher E, Black E, Moore A, et al. . 18F-FDG PET/CT assessment of histopathologically confirmed mediastinal lymph nodes in non-small cell lung cancer using a penalised likelihood reconstruction. Eur Radiol 2016; 26: 4098–106. doi: 10.1007/s00330-016-4253-2 [DOI] [PMC free article] [PubMed] [Google Scholar]
- 4.Parvizi N, Franklin JM, McGowan DR, Teoh EJ, Bradley KM, Gleeson FV. Does a novel penalized likelihood reconstruction of 18F-FDG PET-CT improve signal-to-background in colorectal liver metastases? Eur J Radiol 2015; 84: 1873–8. doi: 10.1016/j.ejrad.2015.06.025 [DOI] [PubMed] [Google Scholar]
- 5.Howard BA, Morgan R, Thorpe MP, Turkington TG, Oldan J, James OG, et al. . Comparison of Bayesian penalized likelihood reconstruction versus OS-EM for characterization of small pulmonary nodules in oncologic PET/CT. Ann Nucl Med 2017; 31: 623–8. doi: 10.1007/s12149-017-1192-1 [DOI] [PubMed] [Google Scholar]
- 6.U.S. Food and Drug Administration. FDA approves new diagnostic imaging agent to detect recurrent prostate cancer. 2016 . U.S. Food and Drug Administration website. Available from: https://www.fda.gov/NewsEvents/Newsroom/PressAnnouncements/ucm503920.htm. [19 May 2017]
- 7.European Medicines Agency. CHMP summary of positive opinion for Axumin. 2017. Available from: http://www.ema.europa.eu/ema/index.jsp?curl=pages/includes/document/document_detail.jsp?webContentId=WC500224397&mid=WC0b01ac058009a3dc [cited 2017 19 May 2017]
- 8.Wollenweber SD. Parameterization of a model-based 3-D PET scatter correction. IEEE Trans Nucl Sci 2002; 49: 722–7. doi: 10.1109/TNS.2002.1039554 [DOI] [Google Scholar]
- 9.Landis JR, Koch GG. The measurement of observer agreement for categorical data. Biometrics 1977; 33: 159–74. doi: 10.2307/2529310 [DOI] [PubMed] [Google Scholar]
- 10.Rahmim A, Qi J, Sossi V. Resolution modeling in PET imaging: theory, practice, benefits, and pitfalls. Med Phys 2013; 40: 064301: 064301. doi: 10.1118/1.4800806 [DOI] [PMC free article] [PubMed] [Google Scholar]
- 11.Miller MP, Kostakoglu L, Pryma D, Yu JQ, Chau A, Perlman E, et al. . Reader training for the restaging of biochemically recurrent prostate cancer using 18F-fluciclovine PET/CT. J Nucl Med 2017; 58: 1596–602. doi: 10.2967/jnumed.116.188375 [DOI] [PubMed] [Google Scholar]
- 12.Bach-Gansmo T, Nanni C, Nieh PT, Zanoni L, Bogsrud TV, Sletten H, et al. . Multisite experience of the safety, detection rate and diagnostic performance of fluciclovine (18F) positron emission tomography/computerized tomography imaging in the staging of biochemically recurrent prostate cancer. J Urol 2017; 197: 676–83. doi: 10.1016/j.juro.2016.09.117 [DOI] [PMC free article] [PubMed] [Google Scholar]
- 13.Oka S, Okudaira H, Ono M, Schuster DM, Goodman MM, Kawai K, et al. . Differences in transport mechanisms of trans-1-amino-3-[18F]fluorocyclobutanecarboxylic acid in inflammation, prostate cancer, and glioma cells: comparison with L-[methyl-11C]methionine and 2-deoxy-2-[18F]fluoro-D-glucose. Mol Imaging Biol 2014; 16: 322–9. doi: 10.1007/s11307-013-0693-0 [DOI] [PubMed] [Google Scholar]
- 14.Amzat R, Taleghani P, Miller DL, Beitler JJ, Bellamy LM, Nye JA, et al. . Pilot study of the utility of the synthetic PET amino-acid radiotracer anti-1-amino-3-[(18)F]fluorocyclobutane-1-carboxylic acid for the noninvasive imaging of pulmonary lesions. Mol Imaging Biol 2013; 15: 633–43. doi: 10.1007/s11307-012-0606-7 [DOI] [PubMed] [Google Scholar]
- 15.Tade FI, Cohen MA, Styblo TM, Odewole OA, Holbrook AI, Newell MS, et al. . Anti-3-18F-FACBC (18F-fluciclovine) PET/CT of breast cancer: an exploratory study. J Nucl Med 2016; 57: 1357–63. doi: 10.2967/jnumed.115.171389 [DOI] [PubMed] [Google Scholar]


