Abstract
Cortical thickness analysis of brain magnetic resonance images is an important technique in neuroimaging research. There are two main computational paradigms, namely voxel-based and surface-based methods. Recently, a tetrahedron-based volumetric morphometry (TBVM) approach involving proper discretization methods was proposed. The multi-scale and physics-based geometric features generated through such methods may yield stronger statistical power. However, several challenges, such as the lack of well-defined thickness statistics and the difficulty in filling tetrahedrons into the thin and curvy cortex structure, impede the broad application of TBVM. In this paper, we present a universal cortical thickness morphometry analysis approach called tetrahedron-based Heat Flux Signature (tHFS) to address these challenges. We define the tetrahedron-based weak form heat equation and Laplace-Beltrami eigen decomposition and give an explicit FEM-based discretization formulation to compute the tHFS. We further show a tHFS metric space with which cortical morphometric distances can be directly visualized. Additionally, we optimize the cortical tetrahedral mesh generation pipeline and fill dense high-quality tetrahedra in the grey matters without sacrificing data integrity. Compared with existing cortical thickness analysis approaches, our experimental results of distinguishing among Alzheimer’s disease (AD), cognitively normal (CN) and mild cognitive impairment (MCI) subjects shows that tHFS yields a more accurate representation of cortical thickness morphometry. The tHFS metric experiment provides a more vivid visualization of tHFS’s power in separating different clinical groups.
Keywords: cortical thickness, tetrahedron-based morphometry
1 Introduction
Human cortical thickness analysis performed in vivo via magnetic resonance imaging (MRI) emerged quickly as a significant neuroimaging biomarker due to its close association with neurodegenerative and psychiatric diseases [3, 6, 14]. Cortical thickness morphometry analysis consists in the accurate measurement of the quantative traits of cortical thickness and in the design of reliable morphological signatures from MRI in an operative way [8, 9, 11].
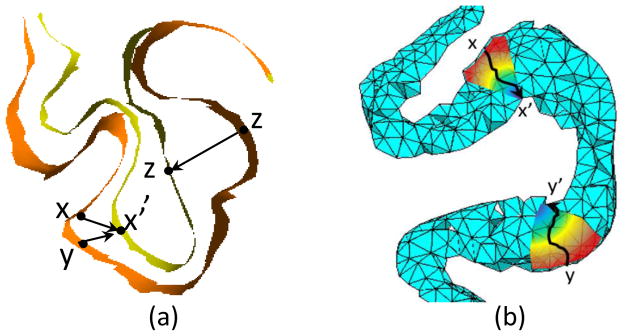
Conventional voxel-based morphometry (VBM) methods [1, 2, 5] have been surpassed in recent years by surface-based morphometry (SBM) approaches [6, 9] because of the newly emerged shape modeling methods. Tetrahedron-based volumetric morphometry (TBVM) approach is a representative new method for cortical analyses [17, 18]. It deals with the measurement of brain structure and changes on tetrahedral mesh. When measuring the variations of bioinformation in the normal direction, SBM implements a localized node-to-node registration with predefined constraints in the tangent space. The Euclidean distance between corresponding nodes is commonly used as a metric, as shown in Fig. 1(a). Compared with SBM, TBVM approach allows for more degrees of freedom, including both tangent space and normal space, hence making it an intuitive choice to model cortical thickness. However, the performance improvement and further application development of TBVM approaches are impeded by several existing challenges: (1) the lack of a well-explained explicit morphometry signature formulation and of an accurate discretization formulation defined in the tetrahedron domain; (2) the difficulty in automatically generating high-quality tetrahedral meshes for the cortex.
Fig. 1.
Different modeling methods in mophometry analysis. (a)Surface-based mophometry approach. (b)Tetrahedron-based mophometry approach.
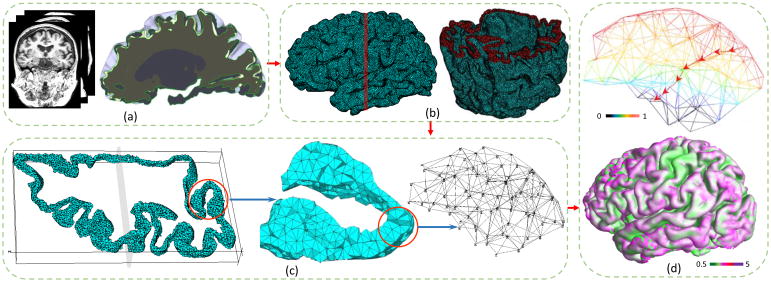
In this paper, we propose a universal thickness morphometry analysis approach called tetrahedral-based Heat Flux Signature (tHFS) to address these challenges and increase statistical power for cortical thickness estimation and disease severity classification. We firstly define the weak form heat equation and the Laplace-Beltrami eigen decomposition on tetrahedral meshes. Then, two different discretization methods based on FEM are derived for computing pial-white point pairs and the LBO spectrum which are used for defining the tHFS. The general computational framework containing the major steps in the method is illustrated in Fig. 2. We further derive a tHFS distance as a metric for measuring disease severity in the form of a numerical distance between patients from the same or different disease groups. One important usage of tHFS distance is to visualize the disease severity by mapping the mutual distances to a 2D plane.
Fig. 2.
General computation framework. (a)Left: MRI images. Right: pial and white surfaces. (b) Left: cortical tetrahedral mesh. Right: cut plane of tetrahedral mesh. (c) Left: one slice cut from the red band part of (b). Middle: zooming in the part of the entorhinal cortex marked by the red circle on the left. Right: a further zoomed-in picture and its detailed inner structure. (d) Top: temperature distribution and heat flux trajectory. Bottom: The cortical thickness map overlaid in color scale.
Our experiments focus on distinguishing different brain atrophy levels in Alzheimer’s disease. We selected 368 MRI images of initial-visit patients from Alzheimer’s Disease Neuroimaging Initiative (ADNI-2) [13] dataset. Experiments include cerebral cortex tetrahedral mesh generation, clinical group classification and a tHFS distance demonstration.
2 Methods
2.1 Cortical Tetrahedral Mesh Generation
Surfaces generated by FreeSurfer are usually error free, but genus-preserving down-sampling and the process of combining pial and white surfaces always create self-intersections. The folded gyri and sulci also make it harder to generate multi-layer tetrahedral meshes. Repeated smoothing is a commonly used method to remove geometric errors[17], but may cause data integrity loss. Our solution here is a minimally invasive surgery over intersection regions. A small neighborhood of the error nodes is selected and moved along the inward normal direction by a small step size. This process is repeated until the intersection is removed. Local smoothing is applied to the selected nodes. Hence, all modified nodes are marked to differentiate them from the unaltered nodes. This protocol sacrifices a small number of vertices to maintain the integrity of the whole mesh. The tetrahedral mesh is then generated by Tetgen [16].
2.2 Tetrahedron-based Heat Equation
The heat flux of vertex m in direction s per unit time is defined by the weighted temperature difference between m and the neighboring vertex along . On tetrahedral meshes, the discretized heat flux is defined by the weighted Newton’s law of cooling: −k(Ts − Tm). Here k is heat conductivity. The minus sign refers to the inversed direction of the temperature gradient. Therefore, the heat flux computation is converted to heat equation problem.
Assuming that the temperature distribution on boundary surfaces is prescribed and static, we apply Galerkin’s method to convert the continuous heat equation problem to a discrete weak form problem with Dirichlet boundary conditions [4, 15]. We define the discrete harmonic energy matrix S as [18]:
| (1) |
where N(vi) is the set of the neighboring vertices of vertex vi; N(vi, vk) is the set of the neighboring tetrahedrons of edge(vi,vk); L(i,j) is the length of the opposite edge to edge(vi,vj) in tetrahedron Tl; and is the dihedral angle of edge(vi,vj) in tetrahedron Tl. In Fig. 3.(a), the neighboring vertices of 1 are represented as green points. Neighboring edges of 1 are in yellow. Two tetrahedrons shared by (1,2) are in green. Fig. 3(b) shows the dihedral angle and opposite edge of (1,2). Extracting two matrices from S: (1) Wii: a square matrix indicates inner nodes i; (2)Wib: a matrix with inner node i and boundary node b. Under the Dirichlet boundary condition, the interior temperature distribution T is: LtetT = T∂Ω, Ltet = diag(ΣiWii) + diag(ΣiWib) − Wii. T∂Ω is the temperature on the boundary. Ltet is the tetrahedron-based Laplace-Beltrami operator (LBO).
Fig. 3.
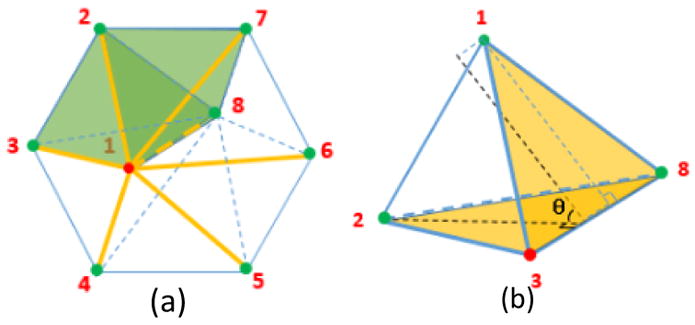
Numerical Discretization.(a) Neighboring relationship of vertex 1. (b) Dihedral angle θ and opposite edge of edge(1,2).
A heat flow trajectory is defined as the path from one point on the pial surface to one point on white surface in the direction of the temperature’s gradient descent. It is illustrated as the top figure of Fig. 2(d). Our method is to search for the biggest temperature flux among all neighboring vertices and then move to that vertex as a new starting point. We repeat this process until the new target point falls on the white surface. All the passing edges are the heat trajectory. Here, our definition of cortical thickness is the sum of all the passing edges. Starting vertex x and destination vertex y form a pial-white vertices pair(x, y), which is used in defining the tHFS.
2.3 Tetrahedron-based Laplace-Beltrami Eigen Decomposition
The Eigencompanion Method is employed to define the tHFS. The eigen pairs are computed by solving the tetrahedron-based Laplace-Beltrami eigen problem over the tetrahedral mesh: Ltetϕ = λϕ. Here, the tetrahedron-based LBO is defined under Neumann boundary conditions: Ltet = B−1(D − S), where S is defined in Equ. 1 and D is a diagonal matrix defined as the sum of each row in S. The heat capacity matrix B is:
| (2) |
where N(vi) is the set of neighboring tetrahedrons of vertex i; N(vi, vk) is the set of neighboring tetrahedrons of edge(i,k); Vl is tetrahedron l’s volume. Solving the eigen problem of Ltet, we get eigenvalue and eigenvector pairs (λn, ϕn).
2.4 Heat Flux Signature
With the pial-white vertices pairs (x, y) calculated in Section 2.2 and the eigen pairs (λn, ϕn), the tHFS is defined as:
| (3) |
where t0 is an initial constant, usually 0 or 1 and δt is step size defined by weighted maximum eigenvalue: .
tHFS is a matrix with the number of vertices as the horizontal dimension and the number of steps as the vertical dimension. If considering the variable δt is a time interval and t0 is the initial time, HFS is a time series matrix. The ith row stands for the heat flux changes along (x, y)i. Stochastic Coordinate Coding(SCC) [12] is then used to organize the features for binary classification.
2.5 tHFS distance
Theoretically, an effective disease severity quantitation method is also convertible to a metric which provides not only a numerical way in describing the relationships of groups and subjects but also a visualization tool via Multidimensional Scaling (MDS). Here we introduce a metric derived from tHFS, called tHFS distance. The tHFS distance aims at measuring static tetrahedron-based cortical thickness morphometry relationships. As a static metric, setting δt = 0 and t = 1, the tHFS distance between two samples M and M′ is:
| (4) |
where N and N′ are numbers of vertices in temperature pairs; The eigen spaces of different meshes may be matched by adjusting signs of eigenvectors [10], so we defined γ as the sign of eigenvectors; Γ(n) is the set of signs. Ai and Ãi are the weighted volume sums of surrounding tetrahedrons: . The vertex to mesh distances d(x, M̃) and d(M, y) are defined as:
| (5) |
| (6) |
where Φ̃γ(n) is an othogonal basis adjusted by Γ(n). Equ.4 provides an optimized Γ(n) so that two orthogonal basses are closest. We proved that tHFS distance has the properties of a metric.
3 Experimental Results
In experiments, we focus on human brain atrophy severity analysis of Alzheimer’s disease patients. Our data contains 94 Alzheimer’s disease (AD) patients, 137 normal controls (CN) and 137 mild cognitive impairment (MCI) patients from the Alzheimer’s Disease Neuroimaging Initiative phase 2 (ADNI-2) baseline initial-visit dataset. All subjects are scanned using a 3T scanner. The acquired MRI images are then pre-processed by FreeSurfer4 to segment pial and white matter surfaces. The pial and white surfaces are downsampled to 120000 faces for the mesh generation. As a universal tool, tHFS can be used to analysis other abnormalities in diseases such as schizophrenia.
3.1 Cortical Tetrahedral Mesh Generation
Fig. 1(b), Fig. 2(b,c) illustrate the generated tetrahedral mesh. 96.88% subjects yielded high quality cortical tetrahedral mesh after the first iteration, and 100% after the second iteration. Each mesh contains 5.6–5.8 million tetrahedrons and more than 1.5 million vertices.
3.2 Cortex Thickness
Although cortical thickness measurement is not our main purpose, we illustrate one thickness map result at the bottom of Fig. 1(d). The color is rendered on the pial surface by scaling with the thickness.
3.3 Disease Severity Classification
In experiment settings, 10-fold cross validation is used for avoiding data selection bias. AdaBoost [7] is the classifier. 10-steps tHFS with 5 and 10 pairs of smallest eigenfunctions (removing the first smallest one) are used when comparing with the lumped volumetric method. 5 pairs are used to compare with FreeSurfer thickness method.
For comparisons, we select the surface-based thickness morphometry method used in FreeSurfer [6] and a lumped tetrahedron-based method [17]. In [17], the lumped discrete volumetric LBO is defined as: Lp = D−1S, where D = diag(d1, …, dn). dn is the weighted volume sum of all the tetrahedrons sharing vertex i: dn =ΣTl∈N(i) Volume(Tl)/4.
The classification results are shown in Table 1. Three performance measures, Accuracy (AC), Sensitivity (SEN) and Specificity (SPE), were evaluated. Considering that the number of eigen pairs may affect the results, here we demonstrate the results of 5 eigen pairs and 10 eigen pairs. The accuracy performance converges at about 10 pairs, so the results of 10 pairs are taken as the general selection. As a thickness morphometry signature, tHFS boosts statistical power to distinguish disease severity compared with pure thickness information. This is due to the more precise discretization and better mesh quality.
Table 1.
Classification results comparing with other methods.
| Group | 5: Lumped | 5: tHFS | 10: Lumped | 10: tHFS | FreeSurfer Thickness | |
|---|---|---|---|---|---|---|
| AD-CN | ACC | 0.950 | 0.974 | 0.957 | 0.978 | 0.762 |
| SEN | 0.953 | 0.963 | 0.960 | 0.978 | 0.770 | |
| SPE | 0.940 | 0.989 | 0.948 | 0.968 | 0.785 | |
|
| ||||||
| AD-MCI | ACC | 0.926 | 0.954 | 0.941 | 0.964 | 0.674 |
| SEN | 0.939 | 0.960 | 0.953 | 0.967 | 0.737 | |
| SPE | 0.905 | 0.894 | 0.922 | 0.960 | 0.776 | |
|
| ||||||
| CN-MCI | ACC | 0.922 | 0.966 | 0.951 | 0.966 | 0.534 |
| SEN | 0.932 | 0.972 | 0.960 | 0.973 | 0.682 | |
| SPE | 0.905 | 0.959 | 0.940 | 0.948 | 0.716 | |
3.4 tHFS distance
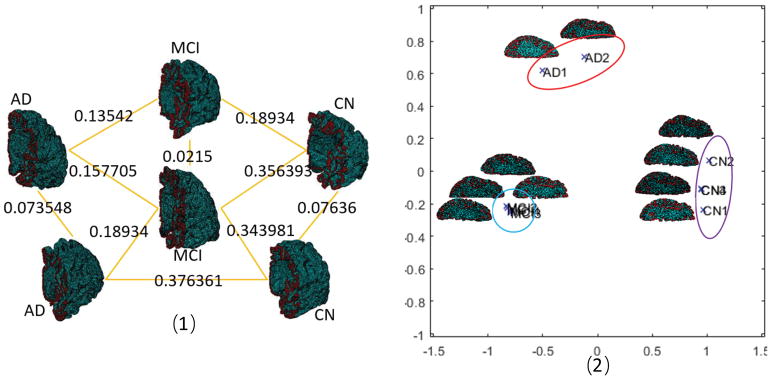
In this experiment, we randomly selected 2 AD patients, 4 CN patients and 4 MCI patients to calculate the mutual tHFS distances. The result is a distance matrix. In Fig. 4(1) we demonstrate a mutual distance example of 2 AD, 2 CN and 2 MCI. We calculate the MDS of the mutual distance matrix with its covariance matrix. The spectrum of the covariance matrices shows the feasibility to find a good configuration of distances using largest two eigenvalues, as the others converge to zero quickly. The MDS map is shown in Fig. 4. Clearly we see that three groups are centered in different regions, while subjects within the same group have much smaller distances than subjects across different groups. The average group distance is defined by averaging the distances of subjects belonging to the same or different groups. The average distance chart is illustrated in Fig. 5. Both the MDS map and average group distance chart indicate that tHFS is powerful in distinguishing different disease severity groups.
Fig. 4.
tHFS distances.(1) A mutual distance example.(2) MDS map.
Fig. 5.
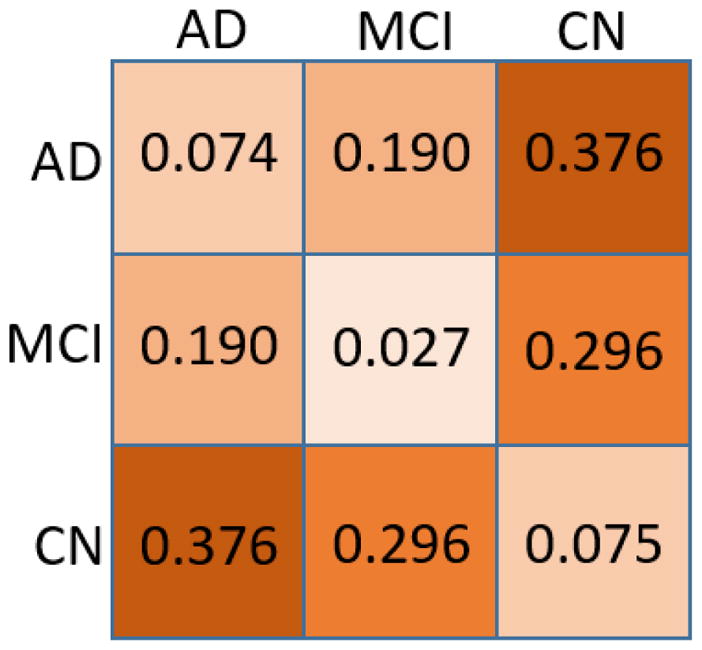
Average tHFS distance.
Here we have developed an accurate, robust TBVM approach for cortical thickness analysis. Besides validating it with other disease datasets, we will continue refining it to advance computational anatomy research.
Acknowledgments
The research is supported in part by NIH (R21AG049216, RF1AG051710, R01EB025032), NSF (IIS-1421165) and NSFC(61772253).
Footnotes
References
- 1.Ashburner J, Friston KJ. Voxel-based morphometry the methods. Neuroimage. 2000;11(6):805–821. doi: 10.1006/nimg.2000.0582. [DOI] [PubMed] [Google Scholar]
- 2.Baron J, Chetelat G, Desgranges B, Perchey G, Landeau B, De La Sayette V, Eustache F. In vivo mapping of gray matter loss with voxel-based morphometry in mild alzheimer’s disease. Neuroimage. 2001;14(2):298–309. doi: 10.1006/nimg.2001.0848. [DOI] [PubMed] [Google Scholar]
- 3.Das SR, Avants BB, Grossman M, Gee JC. Registration based cortical thickness measurement. Neuroimage. 2009;45(3):867–879. doi: 10.1016/j.neuroimage.2008.12.016. [DOI] [PMC free article] [PubMed] [Google Scholar]
- 4.Delkhosh M, Delkhosh M, Jamali M. Greens function and its applications. J Basic Appl Sci Res. 2012;2(9):8865–76. [Google Scholar]
- 5.Draganski B, Gaser C, Busch V, Schuierer G, Bogdahn U, May A. Neuroplasticity: changes in grey matter induced by training. Nature. 2004;427(6972):311. doi: 10.1038/427311a. [DOI] [PubMed] [Google Scholar]
- 6.Fischl B, Dale AM. Measuring the thickness of the human cerebral cortex from magnetic resonance images. Proceedings of the National Academy of Sciences. 2000;97(20):11050–11055. doi: 10.1073/pnas.200033797. [DOI] [PMC free article] [PubMed] [Google Scholar]
- 7.Freund Y, Schapire R, Abe N. A short introduction to boosting. Journal-Japanese Society For Artificial Intelligence. 1999;14(771–780):1612. [Google Scholar]
- 8.Hutton C, Draganski B, Ashburner J, Weiskopf N. A comparison between voxel-based cortical thickness and voxel-based morphometry in normal aging. Neuroimage. 2009;48(2):371–380. doi: 10.1016/j.neuroimage.2009.06.043. [DOI] [PMC free article] [PubMed] [Google Scholar]
- 9.Jones SE, Buchbinder BR, Aharon I. Three-dimensional mapping of cortical thickness using laplace’s equation. Human brain mapping. 2000;11(1):12–32. doi: 10.1002/1097-0193(200009)11:1<12::AID-HBM20>3.0.CO;2-K. [DOI] [PMC free article] [PubMed] [Google Scholar]
- 10.Lai R, Shi Y, Scheibel K, Fears S, Woods R, Toga AW, Chan TF. Metric-induced optimal embedding for intrinsic 3d shape analysis. Conf Computer Vision and Pattern Recognition (CVPR), 2010, IEEE; IEEE; 2010. pp. 2871–2878. [Google Scholar]
- 11.Lerch JP, Evans AC. Cortical thickness analysis examined through power analysis and a population simulation. Neuroimage. 2005;24(1):163–173. doi: 10.1016/j.neuroimage.2004.07.045. [DOI] [PubMed] [Google Scholar]
- 12.Liu J, Ji S, Ye J, et al. Slep: Sparse learning with efficient projections. Arizona State University. 2009;6(491):7. [Google Scholar]
- 13.Mueller SG, Weiner MW, Thal LJ, Petersen RC, Jack C, Jagust W, Trojanowski JQ, Toga AW, Beckett L. The alzheimer’s disease neuroimaging initiative. Neuroimaging Clinics. 2005;15(4):869–877. doi: 10.1016/j.nic.2005.09.008. [DOI] [PMC free article] [PubMed] [Google Scholar]
- 14.Schwarz CG, Gunter JL, Wiste HJ, Przybelski SA, Weigand SD, Ward CP, Senjem ML, Vemuri P, Murray ME, Dickson DW, et al. A large-scale comparison of cortical thickness and volume methods for measuring alzheimer’s disease severity. NeuroImage: Clinical. 2016;11:802–812. doi: 10.1016/j.nicl.2016.05.017. [DOI] [PMC free article] [PubMed] [Google Scholar]
- 15.Shi Y, Chan CH. Multilevel green’s function interpolation method for analysis of 3-d frequency selective structures using volume/surface integral equation. JOSA A. 2010;27(2):308–318. doi: 10.1364/JOSAA.27.000308. [DOI] [PubMed] [Google Scholar]
- 16.Si H. Tetgen, a delaunay-based quality tetrahedral mesh generator. ACM Transactions on Mathematical Software (TOMS) 2015;41(2):11. [Google Scholar]
- 17.Wang G, Wang Y. Towards a Holistic Cortical Thickness Descriptor: Heat Kernel-Based Grey Matter Morphology Signatures. Neuroimage. 2017 Feb;147:360–380. doi: 10.1016/j.neuroimage.2016.12.014. [DOI] [PMC free article] [PubMed] [Google Scholar]
- 18.Wang Y, Gu X, Yau ST, et al. Volumetric harmonic map. Communications in Information & Systems. 2003;3(3):191–202. [Google Scholar]


