

Abstract
Attentional bias to drug cues has been associated with the problematic use of drugs, including cannabis. The cognitive mechanisms underlying this bias are not fully understood. The purpose of this study was to determine whether cannabis-cue attentional bias is associated with disruptions in attentional processing. To this end, a novel cannabis-cue visual probe task that incorporated eye tracking technology and attention-based metrics derived from signal detection theory was administered to seventeen individuals who reported daily/near-daily cannabis use. Seventeen individuals with cocaine use disorder were also enrolled as a clinical-control group. Cannabis and neutral images were briefly presented side-by-side on a computer screen, followed by the appearance of a “go” or “no-go” target upon offset of both images to permit assessment of attention-based performance. Cannabis users exhibited attentional bias to cannabis cues, as measured by fixation time and response time, but not cue-dependent disruptions on subsequent attentional performance. Cocaine users did not display an attentional bias to cannabis cues but did display poorer attentional performance relative to cannabis users. These results indicate that attentional bias to cannabis cues is selective to cannabis use history and not associated with impaired attentional processing.
Keywords: attentional bias, cannabis, cocaine, substance use, signal detection
1. Introduction
Although global trends vary, the use of cannabis in Western societies is gaining greater public acceptance and recent rates of use are increasing. For example, the percentage of United States (US) survey respondents who favored for some form of cannabis legalization doubled from 31% in 2000 to 61% in 2017 (Pew Research Center, 2018). Since the year 2000, at least 15 countries have decriminalized possession of “personal” or larger amounts of cannabis, and in the US, nine states, plus the District of Columbia, have legalized recreational use. The World Drug Report (2017) indicated that the annual prevalence of cannabis use increased from approximately 3% to 7% in the European Union (EU), and 9% to 14% in the US, from 1990 to 2015. However, frequent regular use (e.g., daily), which increases the risk of developing cannabis use disorder (e.g., Hall, 2009), is reported in only a subset of individuals who report recent use of cannabis (3% of the US population and 1% of the EU population; Center for Behavioral Health Statistics and Quality, 2017; European Monitoring Centre for Drugs and Drug Addiction, 2017).
The factors that contribute to the transition to habitual cannabis use and the maintenance of continued use are not entirely understood. Given the importance of attention to environmental cues in goal-directed behavior, there has been considerable interest in assessing attentional bias to drug stimuli and determining the clinical significance of this bias to uncover its role in the abuse of various substances, including cannabis. Extensive research has demonstrated an attentional bias to stimuli specific to the drug abused by the subjects under study across drug types (e.g., Marks et al., 2014 [cocaine]; Miller and Fillmore, 2010, 2011 [alcohol]). Different, and overlapping, theories have been proposed to explain how attentional bias develops (e.g., as a consequence of classical conditioning, sensitization to acquired incentive salience of cues, cues become discriminative stimuli signaling drug availability), but all emphasize that the ability of drug-associated cues to capture the attention of individuals with a history of using that drug is characteristic of problematic drug use (reviewed in Field and Cox, 2008). Consistent with this notion, there is evidence that the magnitude of attentional bias is associated with the presence or degree of a drug use disorder (see below for cannabis examples), though less evidence exists to support a direct link to relapse or the effectiveness of attentional bias training as a therapeutic approach (Field et al., 2014; Christiansen et al., 2015).
Much of the research on cannabis attentional bias has used a modified Stroop task, in which matched drug-related and neutral words that vary in text color are presented individually and the subject is instructed to indicate the color as quickly as possible while ignoring the semantic content of the word. Attentional bias is inferred when response times to accurately indicate the color of drug-related words are slower than for neutral words. A version of the Stroop task using cannabis-related words revealed attentional bias in cannabis users (≥ 1× past month use) who met dependence criteria (N=15; Cannabis Severity of Dependence Scale [C-SDS; Swift et al., 1998]) but not non-dependent users (N=13), and that attentional bias was correlated with subjective craving and frequency of cannabis use (Field, 2005). Greater attentional bias was also observed in adult “heavy” cannabis users (≥ 1× recent weekly use and ≥ 200 lifetime uses) who met criteria for cannabis dependence (N=17; Mini-International Neuropsychiatric Interview [MINI; Sheehan et al., 1998]) compared to those who did not meet CUD (N=10), and no cannabis attentional bias was found in control subjects (N=26; Cousijn et al., 2013). Another study using this task reported an attentional bias to cannabis but not alcohol words in adolescent/emerging adult cannabis users (N=57; aged 16-23) receiving outpatient treatment for CUD (Cousijn et el., 2015), demonstrating the selectivity of this bias. These results support the clinical significance of attentional bias to cannabis cues. However, factors other than attentional bias (e.g., slowed cognitive and/or motor processing; Field and Cox, 2008) could contribute to slower response times on addiction versions of the Stroop task, which has prompted the use of other measures.
Variations of a visual probe task have been used to measure biased visuo-spatial attention to cannabis-related images in cannabis users. In one version of this task, cannabis and matched neutral images are briefly presented side-by-side. Upon offset of the images, a visual probe (e.g., an X) replaces one of the images and subjects must make a choice response based on the probe location. Attentional bias is inferred if subjects respond more quickly to probes replacing cannabis images. An early study using a visual probe task revealed attentional bias to cannabis-related words in cannabis users (N=16; median cannabis cigarettes used per month = 16) with higher craving scores (upper half of a median split on the Marijuana Craving Questionnaire; Heishman et al., 2001), but not in cannabis users with lower craving scores and non-users (N=15; Field et al., 2004a). A more recent study using a visual probe task demonstrated attentional bias to cannabis images in individuals with cannabis use disorder (N=12; CUDIT-R and the Diagnostic and Statistical Manual of Mental Disorders-IV [DSM-IV; American Psychiatric Association, 2000]) compared to controls (N=13; Vujanovic et al., 2016). These results using visual probe tasks are consistent with cannabis Stroop studies, though both procedures are restricted to response time as a measure of attentional bias, which appears to have limited internal and test-retest reliability (Ataya et al., 2012; Spiegelhalder et al., 2011). Further, visual probe tasks only index final gaze direction rather than the total time that attention was directed towards the stimulus.
To overcome those limitations, eye-tracking technology has been combined with visual probe tasks to provide a more ecologically valid and objective measure of attentional allocation. Fixation (or gaze) time derived from this task is generally a more sensitive measure of attentional bias than response time (e.g., Field et al., 2006; Marks et al., 2014; Miller and Fillmore, 2010, 2011) and has greater internal reliability (Ataya et al., 2012; Field and Christiansen, 2012), though fewer studies have used this technology, likely due to the added expense and complexity. One prior study in cannabis users (N=23; ≥ 1× recent weekly use; ≥ 3 on the C-SDS, indicative of dependence) and controls (N=23) found that cannabis users had longer fixation times towards cannabis images compared to neutral images, whereas fixation times for the different cue types did not differ in non-using controls (Field et al., 2006).
This disproportionate orientation towards drug cues could be associated with compromised attentional processing; for example, an inability to disengage from drug cues and discriminate relevant environmental stimuli (Field and Cox, 2008; Franken, 2003; Waters et al., 2005). The present study sought to further address whether cannabis-cue attentional bias is associated with compromised attentional processing by incorporating signal detection metrics into a visual probe task, along with eye tracking, in daily or near-daily cannabis users (≥ 25 days per month). “Go” and “no-go” visual probe targets were presented to subjects following the offset of cannabis and neutral images, which permitted the calculation of d’ (a measure of the ability to discriminate the visual probe targets) and criterion c (a measure of response bias). We predicted that responses to targets behind neutral cues would be suboptimal in cannabis users due to disproportionate sustained attention to cannabis cues. A prior study that included signal detection metrics in a visual probe task found that cannabis users performed at least as well as controls (Vujanovic et al., 2016). A prior study that used a visual probe task variant designed to determine whether the presentation of differently-valenced probes impacted cannabis cue attentional bias failed to find impairments in signal detection in cannabis users compared to controls (Vujanovic et al., 2016). The present study therefore also enrolled cocaine users who met DSM-IV criteria for cocaine abuse or dependence as a clinical control group of individuals with a distinct drug use history associated with attention-based performance impairments (reviewed in Potvin et al., 2014) to determine whether the task variant was sensitive to group differences in performance.
2. Materials and Methods
2.1. Subjects and procedures
Thirty-four adult men and women who could speak/read English were recruited from the local community through newspaper, radio and website advertisements, as well as word-of-mouth. The cannabis group consisted of seventeen subjects who reported daily or near-daily cannabis use (at least 25 out of the past 30 days; as defined in Budney et al., 2007). The cocaine group consisted of seventeen subjects who met criteria for a DSM-IV cocaine-use disorder (cocaine dependence N=13; cocaine abuse N=4) and reported smoked crack cocaine as their typical method of cocaine use, and who used cannabis fewer than five days in the past month. All subjects completed detailed demographic, substance-use history and medical history questionnaires, and a computerized version of Structured Clinical Interview for the Diagnostic and Statistical Manual of Mental Disorders-IV (SCID; First et al., 1996) during screening. Subjects in the cannabis group endorsed between 0-7 DSM-IV cannabis dependence items (mean = 3.9 items). All but one subject in the cannabis group met DSM-IV criteria for cannabis dependence. None of the subjects in the cocaine group met DSM-IV criteria for a cannabis use disorder. Potential subjects were excluded if they had a serious medical or psychiatric condition (e.g., schizophrenia) or were currently prescribed psychiatric medication, were dependent on any drug that could produce withdrawal (e.g., alcohol, opioids or benzodiazepines), or were seeking treatment for substance use. The University of Kentucky Institutional Review Board approved all procedures, recruitment methods, and the informed consent document. Subjects provided written informed consent after the procedures and risks were fully explained, and they were monetarily compensated for their participation.
Subjects were instructed to abstain from drug and alcohol use for 12 h, caffeine for 4 h, and nicotine for 1 h prior to the experimental session. All subjects underwent a field sobriety test and provided an expired breath sample to ensure that they were not intoxicated. Following the field sobriety test, tobacco-using subjects were permitted to smoke a single cigarette 1.5 h prior to completing the session. Subjects then completed psychometric questionnaires (described below) used in previous cannabis-cue attentional bias studies (e.g., Cousijn et al., 2013; Vujanovic et al., 2016), followed by the modified visual probe task, and lastly, a valence-rating task. The modified visual probe and valence-rating tasks were administered using E-prime software (Psychology Software Tools, Pittsburgh, PA) on a PC computer.
Each subject participated in a single session. The session was conducted in a human laboratory in a single-subject room and sound from surrounding areas was attenuated with a white noise machine. During completion of the visual probe task, the lighting was dim, per the eye-tracking device instructions. Study personnel read the instructions for each task to the subjects and provided clarification if requested. All subjects completed practice versions of visual probe and valence-rating tasks prior to data collection, but practice task data were not analyzed or reported. Subjects received monetary compensation for their participation; this compensation was not based on task performance.
2.2. Measures
2.2.1. Psychometric questionnaires
The Cannabis-Use Disorders Identification Test-Revised (CUDIT-R; Adamson et al., 2010) is an 8-item questionnaire for maladaptive cannabis use, rated on a 5-point Likert scale (range: 0 – 32). The CUDIT-R has strong sensitivity and specificity (90% and 91%, respectively) for cannabis-use disorders as diagnosed by the DSM-IV.
The Perceived Stress Scale (PSS; Cohen et al., 1983) is a 10-item measure, rated on a 5-point Likert scale (total score range: 0 – 40), developed to measure the degree to which individuals perceive their life as stressful during the past month. Items in the PSS are general in nature and relatively context free with regard to specific populations.
The Barratt Impulsiveness Scale-11 (BIS-11; Patton et al., 1995) is a 30-item measure, rated on a 4-point Likert scale (total score range: 30 – 120), developed to assess the personality trait of impulsivity.
The Drug Abuse Screening Test (DAST; Skinner, 1992) is a 28-item questionnaire used to measure psychosocial problems associated with abused drugs other than alcohol, rated on a ‘Yes’/’No’ format (range: 0 – 28).
2.2.2. Modified visual probe task
A modified visual probe task that incorporated eye-tracking and a signal detection component was used to measure attentional bias to cannabis cues and determine whether this bias was associated with decrements in attention-based performance. The structure and parameters of this task were based on previous versions of the visual probe task (Field et al., 2004a, 2006; Marks et al., 2014) as well as previous work by Vujanovic et al. (2016) wherein a signal detection component was measured in conjunction with response time.
Visual probe task stimuli consisted of 10 cannabis images matched with 10 neutral images. Cannabis images contained cannabis flowers, cigarettes or paraphernalia (e.g., pipes). Neutral images were matched on the number, size and color of the objects. Each trial began with an orienting stimulus (fixation cross, 750 ms) on the computer screen followed by the presentation of two side-by-side images (cues; 13 × 18 cm, 3 cm apart) for 1000 ms. After a stimulus-onset asynchrony of 200 ms, one of two visual probe targets (‘X’ or ‘/’) appeared on either the left or right of the screen and remained for 750 ms or until a response was emitted. The ‘X’ and ‘/’ served as “go” and no-go” targets, respectively. An inter-trial interval of 750 ms was programmed. Subjects were instructed to look at and focus on both images, and then respond as quickly as possible to the ‘X’ by pressing one of two responses keys that corresponded to the side of the computer screen on which the probe appeared, and to refrain from responding to the ‘/’ when it appeared on the screen. An interval of 750 ms separated trials. The task lasted approximately 5 minutes and consisted of 80 critical trials and 40 filler trials (120 trials total). Trial sequences are presented in Figure 1. Critical trials presented a cannabis and a neutral image and varied systematically according to all possible image and visual probe type and location combinations. Filler trials were intermixed with critical trials and consisted of 10 pairs of additional neutral images that were unrelated to the cannabis and matched-neutral images used in the critical trials.
Figure 1.
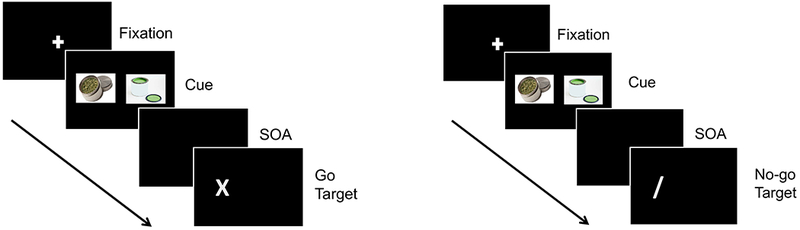
Trial sequences of the Visual-Probe Task. “Go” trials are presented on the left and “no-go” trials are presented on the right. SOA = stimulus-onset asynchrony. An inter-trial interval of 750 ms was used (not shown).
A Tobii X2-60 eye tracker (Tobii Technology, Danderyd, Sweden) was used to determine fixation time (ms) on each cue type. Eye movement was sample at 60 Hz, onsets of fixations were defined as periods of at least 100 ms, and the standard deviation of the line of gaze was less than 0.5° of visual angle. The offsets of fixations were determined by periods of at least 50 ms during which the gaze position was at least 1° of visual angle away from the initial fixation position. Fixation time on an image was defined as looking within the borders of the image.
The dependent variables of interest in this task were mean fixation times, mean response times to “go” targets, d’ values, and criterion c values. The mean fixation times for cannabis and neutral images were calculated by summing the fixation times within each cue type and then dividing each summed fixation time by the total number of critical trials (80). Response times for cannabis and neutral images were calculated as the time to respond to the “go” target when it appeared on the screen. Response times of 0 ms (i.e., omission error) and response times to the “no-go” target were not included in the calculation of mean response times. Attentional bias scores were derived from fixation time and response time data. Fixation time attentional bias scores were calculated as the difference between mean fixation time to cannabis cues minus the mean fixation time to neutral cues (greater scores = greater bias). Response time attentional bias scores were computed as the difference between mean response time to the “go target” following cannabis cues minus the mean response time to the “go” target following neutral cues (negative values = greater response bias).
The “go” and “no-go” visual probe targets permitted the determination of the signal detection metrics d’ and criterion c to assess whether cannabis cues impacted the ability to discriminate the visual probe targets or biased responding, respectively. d’ was computed using equation 1:
| (1) |
In this equation, d’ is calculated from the difference of the z scores of hits (H; i.e., correct responses) and false alarms (FA; i.e., commission errors) divided by the square root of 2. The division by the square root of 2 was included because the task is a two-alternative forced choice task and two criteria are required to make a correct response: (i) only responding to the “go” target (‘X’) and (ii) correctly indicating which side of the computer screen (left or right) the “go” target appeared, using the corresponding response key (Macmillan and Creelman, 2005). Criterion c was computed using equation 2:
| (2) |
In this equation, c is calculated as the sum of the z scores of hits (H) and false alarms (FA) divided by 2, multiplied by −1; c = 0 reflects no response bias, c < 0 reflects a greater criterion (i.e., lower hits and false alarms), and c > 0 reflects lower criterion for responding (i.e., greater hits and false alarms) (Stanislaw and Todorov, 1999).
Although misses (i.e., omission errors) and correct rejections were not included in the calculations for d’ and criterion c, means and standard deviations of these metrics for each group are also included to provide a comprehensive signal detection data set.
2.2.3. Valence-rating task
A valence-rating task of cannabis and neutral images was included for comparison to previous work that has emphasized incentive-salience in attentional bias. Explicit measures of stimulus valence (i.e., pleasantness ratings) of cannabis cues have been used to provide supplementary evidence for biased cognitive processing in cannabis-using individuals (Field et al., 2006; Metrik et al., 2015). The valence-rating task included the cannabis and neutral images used in the modified visual probe task along with an additional 10 cannabis and 10 neutral images for a total of 20 images of each type. Each trial began with a fixation cross presented in the center of the screen for 500 ms, followed by individual presentations of each image in the center of the screen for 2000 ms. Upon offset of the image, a 7-point anchored rating scale that ranged from −3 (very unpleasant) to +3 (very pleasant) appeared on the screen and remained until subjects emitted a response. The task lasted for approximately 3 minutes. The dependent variable of interest was the mean ratings of cannabis and neutral images.
2.3. Data analysis
All statistical analyses were performed in SPSS Version 22 (IBM Corporation, Armonk, NY) with an alpha level set at p ≤ 0.05 (two-tailed) for all outcomes. Independent-samples t-tests were conducted to compare demographic variables between the two groups. Task outcomes were analyzed using mixed-model ANOVAs, with group as a between-subjects factor and cue type (cannabis vs. neutral images) as a within-subjects factor. Post-hoc comparisons used paired-samples t-tests to compare the fixation times, response times, and valence ratings between cannabis and neutral images within each group. Cohen’s d effect sizes are reported for significant task results. Only statistically significant effects detected from the mixed-model ANOVAs are reported. Non-significant interaction effects and (when relevant) main effects subsumed by an interaction are not reported. Pearson’s product-moment correlations were conducted between the mean attentional bias scores from both fixation and response time data and the psychometric questionnaire scores (Total scores; CUDIT-R, PSS, BIS-11 and DAST) from the cannabis users only.
3. Results and Discussion
3.1. Demographic analysis
Demographic variables of interest are presented in Table 1. Significant group differences are shown in bold text. In summary, cannabis users were younger and had more years of education, consistent with national (US) level survey estimates of age and education associated with past month use of cannabis or crack cocaine (Center for Behavioral Health Statistics and Quality, 2017). Cocaine users were predominantly African-American, consistent with national survey estimates of crack cocaine use in the US (Center for Behavioral Health Statistics and Quality, 2017). Cannabis users also had higher CUDIT-R scores, consistent with their group assignment and endorsement of criteria for DSM-IV cannabis abuse and dependence. Cocaine users had higher DAST scores, indicative of greater psychosocial problems associated with their drug use. Within each group, age, years of education, and DAST were not statistically correlated with cannabis-cue attentional bias as measured by both fixation time and response time, or with any signal detection metric after false discovery rate correction for multiple comparisons (all ps > 0.05; Benjamini and Hochberg, 1995); suggesting that these demographic variables did not influence visual probe task results.
Table 1.
Subject demographic characteristics: means, standard deviations (SD), t-values from independent samples t-tests, and chi-square values from chi-squared tests. Bolded text indicates a statistically significant group difference.
| Group |
|||
|---|---|---|---|
| Demographic variable | Cannabis Users | Cocaine Users | χ2-/t-value |
| Group size (n): | 17 | 17 | - |
| Sex (n male/female): | 11/6 | 11/6 | 0.00 |
| Mean age (±SD): | 24.65 (5.43) | 43.60 (8.65) | 7.65 |
| Mean years of education (±SD): | 13.94 (1.60) | 12.15 (1.58) | 3.29 |
| Race/Ethnicity (n AA/C/MO): | 3/12/2 | 13/4/0 | 12.25 |
| Mean cigarettes/day (±SD): | 4.15 (7.06) | 7.09 (5.31) | 1.37 |
| Mean alcoholic drinks/week (±SD): | 4.28 (4.14) | 10.62 (14.71) | 1.17 |
| Mean days used past month (±SD): | |||
| Cannabis: | 27.94 (2.41) | 0.88 (1.17) | 41.67 |
| Cocaine: | 0.06 (0.24) | 16.24 (8.49) | 7.85 |
| Mean years of use (±SD): | |||
| Cannabis: | 7.87 (5.26) | - | - |
| Cocaine: | - | 19.32 (11.67) | - |
| Mean CUDIT-R score (±SD): | 14.94 (5.53) | 1.94 (2.90) | 8.58 |
| Mean PSS score (±SD): | 12.06 (6.04) | 10.47 (7.26) | 0.69 |
| Mean BIS-11 score (±SD): | 60.77 (10.81) | 62.88 (14.80) | 0.48 |
| Mean DAST score (±SD): | 4.35 (1.97) | 9.29 (5.21) | 3.66 |
Note: AA = African-American; C = Caucasian; MO = Mixed/Other; PSS = Perceived Stress Scale; BIS-11 = Barratt Impulsiveness Scale-11; CUDIT-R = Cannabis-Use Disorders Identification Test-Revised; DAST = Drug Abuse Screening Test.
3.2. Visual probe task
3.2.1. Attentional bias.
The left panel of Figure 2 shows the fixation time results from the visual probe task. A main effect of group was detected, with greater fixation times in cannabis users compared to cocaine users (F1,32 = 10.58, p = 0.003). A main effect of cue type was also observed, with greater fixation times for cannabis images compared to neutral images (F1,32 = 8.27, p = 0.007). Post-hoc comparisons within each group revealed increased fixation time for cannabis images compared to neutral images in cannabis users only (t16 = 3.11, p = 0.007, d = 0.75).
Figure 2.
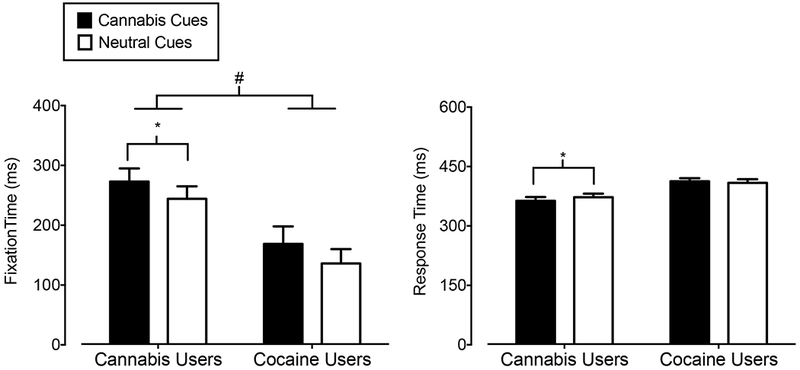
Mean Fixation Time (Y-axis; left panel) and Response Time (Y-axis; right panel) in ms on cannabis images (filled bars) and neutral images (open bars) in cannabis users (X-axis; left side) and cocaine users (X-axis; right side). Bars show means of 17 Cannabis Users and 17 Cocaine Users. Uni-directional brackets indicate 1 SEM. The pound-sign indicates significantly greater fixation time to both cue types in cannabis users compared to cocaine users (main effect of group). The asterisks indicate a significant attentional bias to cannabis cues in cannabis users reflected by increased fixation time and decreased response time, as determined from post-hoc tests.
The right panel of Figure 2 shows the response times to “go” targets following the presentation of cannabis and neutral images on the visual probe task. A significant interaction between cue type and group was found (F1,32 = 4.41, p = 0.04). Post-hoc comparisons revealed that cannabis users, but not cocaine users, responded more quickly to “go” targets following cannabis images than to “go” targets following neutral images (t16 = 2.44, p = 0.03, d = 0.59).
Fixation and response time results on the visual probe task demonstrated a cannabis-cue attentional bias in cannabis users. These results are consistent with previous studies using cannabis versions of the Stroop and visual probe tasks, as reviewed above. This study extended prior research by showing that attentional bias to cannabis cues was not present in cocaine-dependent subjects with limited cannabis use histories. Prior research has demonstrated that cocaine users display attentional bias to cocaine cues as assessed with visual probe tasks and eye-tracking technology (Marks et al., 2014), suggesting that the group differences are due to the presentation of drug-specific cues. These results are also in agreement with a previous study that reported an attentional bias to cannabis, but not alcohol, words on a Stroop task in young cannabis users (Cousijn et el., 2015), and contribute to a growing body of literature including attentional bias research with other drugs demonstrating the selectivity of attentional bias to cues associated with the abused drug (e.g., Marks et al., 2015; but see Carpenter et al., 2006).
3.2.2. Signal detection.
Figure 3 shows d’ (left panel) and criterion c (right panel) values. Cannabis users displayed greater d’ values (F1,32 = 21.69, p = 0.001) and lower mean criterion c values (F1,32 = 22.54, p = 0.001) compared to cocaine users (i.e., main effects of group). There were no significant main effects or interactions of cue type for these signal detection metrics. The lower d’ values and greater criterion c values in the cocaine group appear to be due to more omission errors (i.e., misses) to “go” targets following both cannabis and neutral images (means [SDs] = 0.33 [0.22] and 0.35 [0.24], respectively) relative to the cannabis group (means [SDs] = 0.09 [0.08] and 0.09 [0.11], respectively). In contrast, commission errors (i.e., false alarms) to “no-go” targets following cannabis and neutral images were comparable in the cannabis (means [SDs] = 0.03 [0.01] to both cue types) and cocaine (means [SDs] = 0.03 [0.01] to both cue types) groups. Hits to “go” targets following cannabis and neutral cues were comparable within both the cannabis group (means [SDs] = 0.91 [0.08] and 0.91 [0.11], respectively) and cocaine group (means [SDs] = 0.67 [0.22] and 0.65 [0.24], respectively). The rates of correct rejections to “no-go “targets following cannabis and neutral cues were the same between the groups (both group means [SDs] = 0.97 [0.01], for both cue types).
Figure 3.
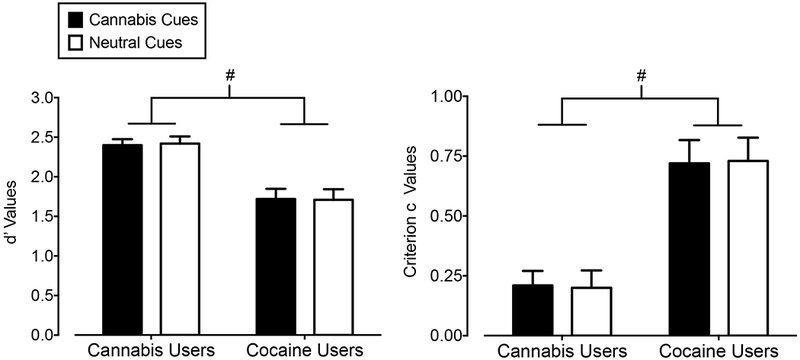
Mean d’ (Y-axis; left panel) and criterion c (Y-axis; right panel) values associated with “go” and “no-go” visual probe targets following cannabis images (filled bars) and neutral images (open bars) in cannabis users (X-axis; left side) and cocaine users (X-axis; right side). Bars show means of 17 Cannabis Users and 17 Cocaine Users. Uni-directional brackets indicate 1 SEM. Pound-signs indicate significantly worse attentional control in cocaine users compared to cannabis users, regardless of cue type (main effect of group).
Compared to cannabis users, cocaine users were worse at discriminating visual probe targets and were biased towards not responding to the visual probe target regardless of image type. These results are in line with prior studies, which showed that cannabis users performed at least as well as controls on a visual probe task that included a signal detection component (Vujanovic et al., 2016), whereas stimulant (cocaine and/or amphetamine) users displayed poor attentional control using similar metrics compared to controls (e.g., Lane et al., 2007; Levine et al., 2006). Together, these data suggest that the cannabis-cue attentional bias in cannabis users is not due to deficits in attentional processing.
3.2.3. Association between attentional bias and psychometrics.
No significant correlations between fixation time or response time on the visual probe task and scores on the CUDIT-R, PSS, BIS-11, or DAST were detected within the cannabis-using and cocaine-using groups (Table 2). The sample sizes of cannabis users and cocaine users in the present study might have contributed to the lack of statistical significance in these correlations.
Table 2.
Pearson’s correlations between attentional bias scores from the visual-probe task and psychometric questionnaires within each group.
| Fixation time Bias Scores |
Response time Bias Scores |
|||
|---|---|---|---|---|
| Cannabis users | r | p | r | p |
| CUDIT-R | 0.37 | 0.15 | −0.13 | 0.62 |
| PSS | 0.11 | 0.69 | −0.28 | 0.27 |
| BIS-11 | 0.07 | 0.80 | −0.33 | 0.20 |
| DAST | 0.40 | 0.11 | 0.47 | 0.06 |
| Cocaine Users | ||||
| CUDIT-R | −0.25 | 0.33 | −0.15 | 0.58 |
| PSS | 0.10 | 0.70 | −0.42 | 0.09 |
| BIS-11 | 0.18 | 0.50 | −0.42 | 0.10 |
| DAST | −0.21 | 0.42 | −0.33 | 0.19 |
Note: CUDIT-R = Cannabis-Use Disorders Identification Test-Revised; PSS = Perceived Stress Scale; BIS-11 = Barratt Impulsiveness Scale-11
Although non-significant, there were modest correlations between fixation time and scores on the CUDIT-R (r = 0.37) and DAST (r = 0.40) in the cannabis-using group, suggesting that eye-tracking measures of cannabis-cue attentional bias in cannabis users might be related to cannabis use history and the psychosocial problems that arise from cannabis use. The only other study that used eye-tracking to measure cannabis-cue attentional bias did not report a correlation between cannabis dependence criteria (i.e., C-SDS scores) and fixation time in a group of cannabis users reporting at least weekly use however (N = 23; Field et al., 2006). Two prior studies using a cannabis-Stroop task independently demonstrated that attentional bias was greater in cannabis users who met dependence criteria via either the C-SDS or the MINI, compared to non-dependent cannabis users and controls (Field, 2005; Cousijn et al., 2013). Further, Cousijn and colleagues (2013) reported that greater problem severity (i.e., CUDIT-R) was moderately and positively correlated with attentional bias across both dependent and non-dependent cannabis users (r = 0.44, p = 0.02). One possible explanation for these discrepancies is that there is a limit to the attentional bias that develops with drug use, and this ceiling makes it difficult to detect correlations between attentional bias and problematic cannabis use outcomes (Field and Cox, 2008).
The response time measure of cannabis cue attentional bias was moderately, but non-significantly, associated with BIS-11 (r = −0.33) and DAST (r = 0.47) scores in the cannabis-using group. This association between greater trait impulsivity and response bias was also observed in cocaine users (r = −0.42). One interpretation of these findings is that impulsivity and drug-related psychosocial problems are associated with faster motor responding following presentation of salient cues in general (see Field and Cox, 2008), though further work is needed to explore this possibility.
That PSS scores were not related to either index of attentional bias in cannabis users is consistent with a prior study (Vujanovic et al., 2016). Perceived stress was moderately, but non-significantly, correlated the response time measure of bias in the cocaine group. A prior study did not find a significant correlation between PSS scores and an anti-saccade measure of cocaine-cue attentional bias in cocaine-dependent adults (Dias et al., 2015). Given that PSS scores were not associated with the fixation time cannabis-cue attentional bias in cocaine users but BIS-11 scores were associated with response time bias, this finding might represent general pre-potent motor responding to drug cues.
3.3. Valence-rating task
Figure 4 shows the results from the valence-rating task. Cannabis users provided greater ratings of pleasantness for both cue types compared to cocaine users (main effect of group; F1,32 = 7.34, p = 0.01) and across both groups, cannabis images were rated as more pleasant than neutral images (main effect of cue type; F1,32 = 23.45, p = 0.001). Paired-samples t-tests comparing cannabis to neutral images within each group revealed that cannabis users rated cannabis images as more pleasant than neutral images (t16 = 7.66, p = 0.001, d = 1.86), whereas cocaine users did not rate cannabis images differently than neutral images (t16 = 1.64, p = 0.12). Greater ratings of pleasantness of cannabis images in the cannabis group is consistent with prior results in cannabis users (e.g., Field et al., 2006, Metrik et al., 2015) as well as the positive drug-cue rating bias that has been demonstrated in users of other drugs (e.g., Mogg et al., 2003; Bradley et al., 2004; Field et al., 2004b). These data also suggest that the “attractiveness” of drug cues is specific to the substance-using population.
Figure 4.
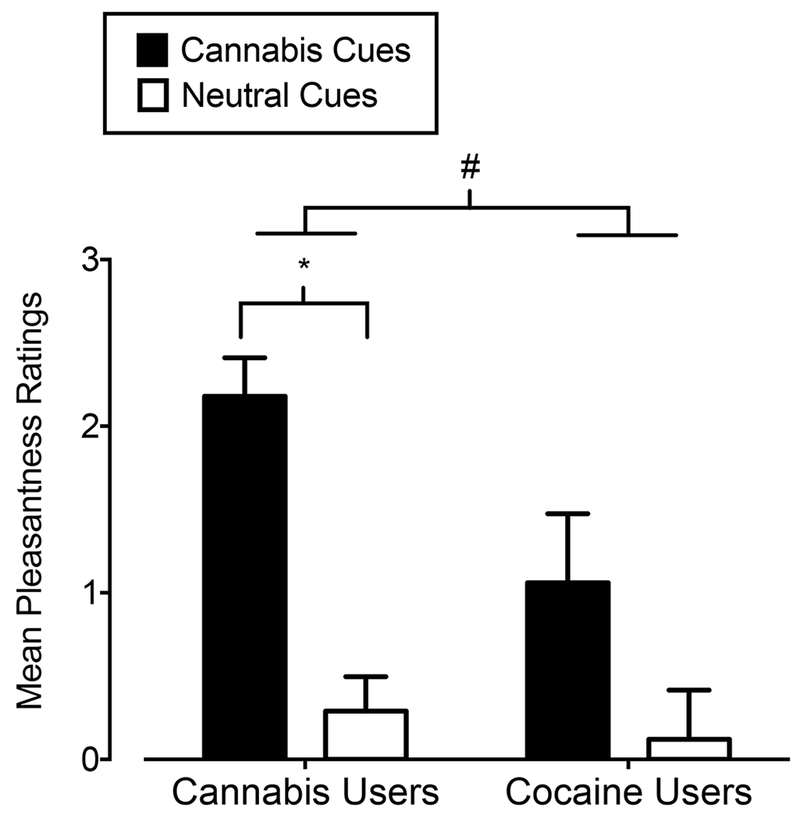
Mean ratings of pleasantness of cannabis images (filled bars) and neutral images (open bars) on the valence-rating task in cannabis users (X-axis; left side) and cocaine users (X-axis; right side). Bars show means of 17 Cannabis Users and 17 Cocaine Users. Uni-directional brackets indicate 1 SEM. The pound-sign indicates significantly greater pleasantness ratings to both cue types in cannabis users compared to cocaine users (main effect of group). The asterisk indicates significantly higher ratings of pleasantness of cannabis images compared to neutral images in cannabis users, as determined from post-hoc tests.
4. Conclusions
This study replicated the cannabis-cue attentional bias that has been demonstrated previously in individuals with problematic cannabis use patterns and extended that research by showing the selectivity of this attentional bias through the inclusion of a cocaine-using control group. This study also demonstrated that, despite the presence of cannabis-cue attentional bias, cannabis users were more capable of discriminating between visual probe targets, and either emitting or inhibiting a response, as appropriate, compared to cocaine users. These findings did not support the prediction that there would be poorer signal detection performance following neutral cues in cannabis users due to disproportionate sustained attention to cannabis cues. However, these findings are consistent with a prior study that failed to find impairments in signal detection in cannabis users compared to controls (Vujanovic et al., 2016). Together, these results indicate that attentional bias is dissociable from attentional processing deficits.
Nonetheless, impairment in other aspects of attentional processing not captured by these visual probe tasks might underlie cannabis-cue attentional bias, and/or promote cannabis use decisions following disproportionate attention to cannabis cues. Further, visual probe tasks that present neutral and drug stimuli simultaneously such as the one used here do not permit a determination of whether drug cues directly impact attentional processing or if an attentional bias is due to pre-existing attentional processing deficits. Other procedures (e.g., spatial-cueing or saccade tasks) are better suited for elucidating potential interactions between attentional bias and attentional processing. Given the importance of attention in goal-directed behavior and the consistent association between attentional bias to drug cues and problematic drug use, future research on the cognitive mechanisms and clinical significance of drug-cue attentional bias is needed.
Acknowledgements
We acknowledge the expert technical assistance of the Laboratory of Human Behavioral Pharmacology staff, Jessica Fogel for her work on a pilot version of this study and Justin Strickland for statistical consultation.
Role of Funding Sources
This work was supported by the National Institutes of Health (NIH; grant numbers R01 DA036550, T32 DA07304, R01 DA025032, R01 DA032254, R01 DA033394, R01 DA036827, R21 DA035376, R01 DA036553, R01 DA033364, and UL1TR001998). The NIH had no role in the design, implementation, data collection, or analyses and/or interpretation of the results, writing of the manuscript, and the decision to submit the manuscript for publication.
Footnotes
Conflicts of Interest
The authors declare no conflicts of interest relevant to this work. This manuscript represents original research and all applicable subject protection guidelines and regulations were followed in the conduct of the research.
References
- Adamson SJ, Kay-Lambkin FJ, Baker AL, Lewin TJ, Thornton L, Kelly BJ, Sellman JD, 2010. An improved brief measure of cannabis misuse: the Cannabis Use Disorders Identification Test-Revised (CUDIT-R). Drug Alcohol Depend. July 1;110(1-2):137–43. doi: 10.1016/j.drugalcdep.2010.02.017. [DOI] [PubMed] [Google Scholar]
- American Psychiatric Association, 2000. Diagnostic and statistical manual of mental disorders, fourth ed. American Psychiatric Association, Washington D.C. Text Revision. [Google Scholar]
- Ataya AF, Adams S, Mullings E, Cooper RM, Attwood AS, Munafò MR, 2012. Internal reliability of measures of substance-related cognitive bias. Drug Alcohol Depend. February 1;121(1–2):148–51. doi: 10.1016/j.drugalcdep.2011.08.023. [DOI] [PubMed] [Google Scholar]
- Benjamini Y, Hochberg Y, 1995. Controlling the false discovery rate: a practical and powerful approach to multiple testing. J Roy Statist Soc, Ser B. 57(1):289–300. [Google Scholar]
- Bradley B, Field M, Mogg K, De Houwer J, 2004. Attentional and evaluative biases for smoking cues in nicotine dependence: component processes of biases in visual orienting. Behav Pharmacol February;15(1):29–36. [DOI] [PubMed] [Google Scholar]
- Budney AJ, Vandrey RG, Hughes JR, Moore BA, Bahrenburg B, 2007. Oral delta-9-tetrahydrocannabinol suppresses cannabis withdrawal symptoms. Drug Alcohol Depend. January 5;86(1):22–9. [DOI] [PubMed] [Google Scholar]
- Carpenter KM, Schreiber E, Church S, McDowell D, 2006. Drug Stroop performance: relationships with primary substance of use and treatment outcome in a drug-dependent outpatient sample. Addict Behav. January;31(1):174–81. [DOI] [PubMed] [Google Scholar]
- Center for Behavioral Health Statistics and Quality, Substance Abuse and Mental Health Services Administration, 2017. Key substance use and mental health indicators in the United States: Results from the 2016 National Survey on Drug Use and Health. HHS Publication No. SMA 17–5033, NSDUH Series H-52; Rockville, MD. [Google Scholar]
- Christiansen P, Schoenmakers TM, Field M, 2015. Less than meets the eye: reappraising the clinical relevance of attentional bias in addiction. Addict Behav. May; 44:43–50. doi: 10.1016/j.addbeh.2014.10.005. [DOI] [PubMed] [Google Scholar]
- Cohen S, Kamarck T, Mermelstein R, 1983. A global measure of perceived stress. J Health Soc Behav. December;24(4):385–96. [PubMed] [Google Scholar]
- Cousijn J, Watson P, Koenders L, Vingerhoets WA, Goudriaan AE, Wiers RW, 2013. Cannabis dependence, cognitive control and attentional bias for cannabis words. Addict Behav. December;38(12):2825–32. doi: 10.1016/j.addbeh.2013.08.011. [DOI] [PubMed] [Google Scholar]
- Cousijn J, van Benthem P, van der Schee E, Spijkerman R, 2015. Motivational and control mechanisms underlying adolescent cannabis use disorders: A prospective study. Dev Cogn Neurosci December; 16:36–45. doi: 10.1016/j.dcn.2015.04.001. [DOI] [PMC free article] [PubMed] [Google Scholar]
- Dias NR, Schmitz JM, Rathnayaka N, Red SD, Sereno AB, Moeller FG, Lane SD, 2015. Anti-saccade error rates as a measure of attentional bias in cocaine dependent subjects. Behav Brain Res October 1; 292:493–9. doi: 10.1016/j.bbr.2015.07.006 [DOI] [PMC free article] [PubMed] [Google Scholar]
- European Monitoring Centre for Drugs and Drug Addiction, 2017. European Drug Report 2017: Trends and Developments, Publications Office of the European Union, Luxembourg: ISBN 978–92-9497–083-1. ISSN 2314–9086. doi: 10.2810/144609. TD-AT-17–001-EN-E. [DOI] [Google Scholar]
- Field M, Mogg K, Bradley BP, 2004a. Cognitive bias and drug craving in recreational cannabis users. Drug Alcohol Depend. April 9;74(1):105–11. [DOI] [PubMed] [Google Scholar]
- Field M, Mogg K, Bradley BP, 2004b. Eye movements to smoking-related cues: effects of nicotine deprivation. Psychopharmacology. April;173(1–2):116–23. [DOI] [PubMed] [Google Scholar]
- Field M, 2005. Cannabis ‘dependence’ and attentional bias for cannabis-related words. Behav Pharmacol. September;16(5–6):473–6. [DOI] [PubMed] [Google Scholar]
- Field M, Eastwood B, Bradley BP, Mogg K, 2006. Selective processing of cannabis cues in regular cannabis users. Drug Alcohol Depend October 15;85(1):75–82. [DOI] [PubMed] [Google Scholar]
- Field M, Cox WM, 2008. Attentional bias in addictive behaviors: a review of its development, causes, and consequences. Drug Alcohol Depend. September 1;97(1–2):1–20. doi: 10.1016/j.drugalcdep.2008.03.030. [DOI] [PubMed] [Google Scholar]
- Field M, Christiansen P, 2012. Commentary on, ‘Internal reliability of measures of substance-related cognitive bias’. Drug Alcohol Depend. August1;124(3):189–90. doi: 10.1016/j.drugalcdep.2012.02.009. [DOI] [PubMed] [Google Scholar]
- Field M, Marhe R, Franken IH, 2014. The clinical relevance of attentional bias in substance use disorders. CNS Spectr June;19(3):225–30. doi: 10.1017/S1092852913000321. [DOI] [PubMed] [Google Scholar]
- First MB, Spitzer RL, Gibbon M, Williams JB, 1996. Structured clinical interview for DSM-IV axis I disorders (Patient edition). New York: Biometrics Research Department, New York State Psychiatric Institute. [Google Scholar]
- Franken IH, 2003. Drug craving and addiction: integrating psychological and neuropsychopharmacological approaches. Prog Neuropsychopharmacol Biol Psychiatry. June;27(4):563–79. [DOI] [PubMed] [Google Scholar]
- Hall W, 2009. The adverse health effects of cannabis use: what are they, and what are their implications for policy? Int J Drug Policy. November;20(6):458–66. doi: 10.1016/j.drugpo.2009.02.013. [DOI] [PubMed] [Google Scholar]
- Heishman SJ, Singleton EG, Liguori A, 2001. Marijuana Craving Questionnaire: development and initial validation of a self-report instrument. Addiction. July;96(7):1023–34. [DOI] [PubMed] [Google Scholar]
- Lane SD, Moeller FG, Steinberg JL, Buzby M, Kosten TR, 2007. Performance of cocaine dependent individuals and controls on a response inhibition task with varying levels of difficulty. Am J Drug Alcohol Abuse. 33(5):717–26. [DOI] [PubMed] [Google Scholar]
- Levine AJ, Hardy DJ, Miller E, Castellon SA, Longshore D, Hinkin CH, 2006. The effect of recent stimulant use on sustained attention in HIV-infected adults. J Clin Exp Neuropsychol. January;28(1):29–42. [DOI] [PubMed] [Google Scholar]
- Macmillan NA, Creelman CD, 2005. Detection theory. Mahwah, NJ: Erlbaum. [Google Scholar]
- Marks KR, Roberts W, Stoops WW, Pike E, Fillmore MT, Rush CR, 2014. Fixation time is a sensitive measure of cocaine cue attentional bias. Addiction. September;109(9):1501–8. doi: 10.1111/add.12635. [DOI] [PMC free article] [PubMed] [Google Scholar]
- Marks KR, Pike E, Stoops WW, Rush CR, 2015. The magnitude of drug attentional bias is specific to substance use disorder. Psychol Addict Behav. September;29(3):690–5. doi: 10.1037/adb0000084. [DOI] [PMC free article] [PubMed] [Google Scholar]
- Metrik J, Aston ER, Kahler CW, Rohsenow DJ, McGeary JE, Knoplik VS, 2015. Marijuana’s acute effects on cognitive bias for affective and marijuana cues. Exp Clin Psychopharmacol. October; 23(5): 339–50. doi: 10.1037/pha0000030. [DOI] [PMC free article] [PubMed] [Google Scholar]
- Miller MA, Fillmore MT, 2010. The effect of image complexity on attentional bias towards alcohol-related images in adult drinkers. Addiction. May;105(5):883–90. doi: 10.1111/j.1360-0443.2009.02860.x. [DOI] [PMC free article] [PubMed] [Google Scholar]
- Miller MA, Fillmore MT, 2011. Persistence of attentional bias toward alcohol-related stimuli in intoxicated social drinkers. Drug Alcohol Depend. September 1;117(2–3):184–9. doi: 10.1016/j.drugalcdep.2011.01.016. [DOI] [PubMed] [Google Scholar]
- Mogg K, Bradley BP, Field M, De Houwer J, 2003. Eye movements to smoking-related pictures in smokers: relationship between attentional biases and implicit and explicit measures of stimulus valence. Addiction. June;98(6):825–36. [DOI] [PubMed] [Google Scholar]
- Patton JH, Stanford MS, Barratt ES, 1995. Factor structure of the Barratt Impulsiveness Scale. J Clin Psychol. November;51(6):768–74. [DOI] [PubMed] [Google Scholar]
- Pew Research Center, 2018. About six-in-ten Americans supports marijuana legalization. http://www.pewresearch.org/fact-tank/2018/01/05/americans-support-marijuana-legalization/ (accessed 2018).
- Potvin S, Stavro K, Rizkallah E, Pelletier J, 2014. Cocaine and cognition: a systematic quantitative review.J Addict Med. Sep-Oct;8(5):368–76. doi: 10.1097/ADM.0000000000000066. [DOI] [PubMed] [Google Scholar]
- Sheehan DV, Lecrubier Y, Sheehan KH, Amorim P, Janavs J, Weiller E, Hergueta T, Baker R, Dunbar GC, 1998. The Mini-International Neuropsychiatric Interview (M.I.N.I.): The development and validation of a structured diagnostic psychiatric interview for DSM-IV and ICD-10. J Clin Psychiatry. 59 Suppl 20:22–33; quiz 34–57. [PubMed] [Google Scholar]
- Skinner HA, 1992. The drug abuse screening test. Addict Behav. 7: 363–71. [DOI] [PubMed] [Google Scholar]
- Spiegelhalder K, Jähne A, Kyle SD, Beil M, Doll C, Feige B, Riemann D, 2011. Is smoking-related attentional bias a useful marker for treatment effects? Behav Med January;37(1):26–34. doi: 10.1080/08964289.2010.543195. [DOI] [PubMed] [Google Scholar]
- Stanislaw H, Todorov N, 1999. Calculation of signal detection theory measures. Behav Res Methods Instrum Comput. February;31(1):137–49. [DOI] [PubMed] [Google Scholar]
- Swift W, Copeland J, Hall W, 1998. Choosing a diagnostic cut-off for cannabis dependence. Addiction. November;93(11):1681–92. [DOI] [PubMed] [Google Scholar]
- United Nations Office on Drug and Crime, 2017. World Drug Report. United Nations publication; ISBN: 978–92-1–148291-1, eISBN: 978–92-1–060623-3, Sales No. E.17.XI.6. [Google Scholar]
- Vujanovic AA, Wardle MC, Liu S, Dias NR, Lane SD, 2016. Attentional bias in adults with cannabis use disorders. J Addict Dis 35(2):144–53. doi: 10.1080/10550887.2015.1116354. [DOI] [PMC free article] [PubMed] [Google Scholar]
- Waters AJ, Sayette MA, Franken IHA, Schwartz JE, 2005. Generalizability of carry-over effects in the emotional Stroop task. Behav Res Ther. June;43(6):715–32. [DOI] [PubMed] [Google Scholar]