Abstract
Recent advances in ion mobility spectrometry (IMS) have illustrated its power in determining the structural characteristics of a molecule, especially when coupled with other separations dimensions such as liquid chromatography (LC) and mass spectrometry (MS). However, these three separation techniques together greatly complicate data analyses, making better informatics tools essential for assessing the resulting data. In this manuscript, Skyline was adapted to analyze LC-IMS-CID-MS data from numerous instrument vendor datasets and determine the effect of adding the IMS dimension into the normal LC-MS molecular pipeline. For the initial evaluation, a tryptic digest of bovine serum albumin (BSA) was spiked into a yeast protein digest at seven different concentrations and Skyline was able to rapidly analyze the MS and CID-MS data for 38 of the BSA peptides. Calibration curves for the precursor and fragment ions were assessed with and without the IMS dimension. In all cases, addition of the IMS dimension removed noise from co-eluting peptides with close m/z values, resulting in calibration curves with greater linearity and lower detection limits. This study presents an important informatics development since to date LC-IMS-CID-MS data from the different instrument vendors is often assessed manually and cannot be analyzed quickly. Because these evaluations require days for the analysis of only a few target molecules in a limited number of samples, it is unfeasible to evaluate hundreds of targets in numerous samples. Thus, this study showcases Skyline’s ability to work with the multidimensional LC-IMS-CID-MS data and provide biological and environmental insights rapidly.
Keywords: ion mobility spectrometry, Skyline, data independent acquisition, proteomics
Introduction
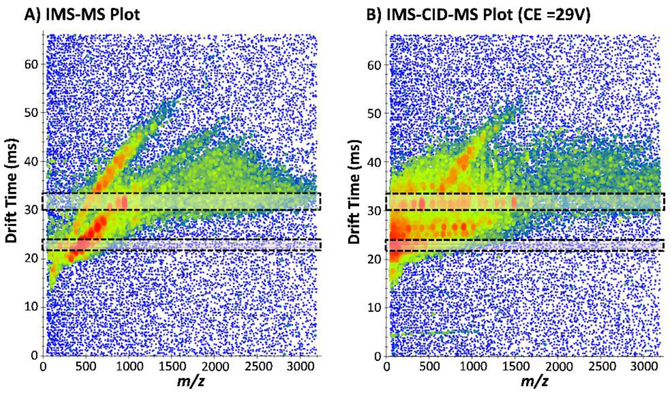
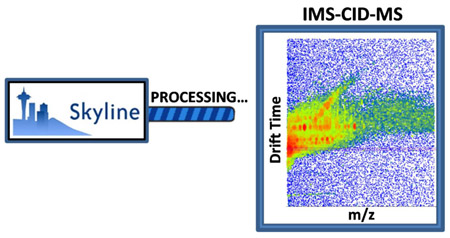
As the demand for faster and more informative sample analyses continues to grow, so does the need for better informatics programs to assess the resulting data. Ion mobility spectrometry (IMS) provides a promising separation technique capable of increasing the throughput, sensitivity and selectivity of current liquid chromatography and mass spectrometry (LC-MS) omic analyses 1-8. However, evaluating the multidimensional LC-IMS-MS data has proven to be extremely challenging as the extra IMS dimension adds complexity to bioinformatics analyses. Over the last decade, attempts have been made to alter LC-MS tools to accommodate the multidimensional LC-IMS-MS data 9-13. This adaptation of tools has worked well for feature extractions and library matching of the precursor ion spectra, however, automated analyses of the LC-IMS-CID-MS fragmentation data from numerous instrument vendors has proven to be more difficult, especially when all-ions fragmentation is performed using a data independent acquisition (DIA) approach 14-15. Since the IMS technique can provide benefits for DIA analyses such as the precursors having the same drift time as their fragments to enable groupings which are not possible with MS alone (Figure 1) 16-17, there is a great desire to have informatics programs to process these data. Unfortunately to date, a majority of LC-IMS-CID-MS analyses from the different vendors are evaluated manually and only focus on a small number of target molecules and datasets as increasing this number would quickly increase the analysis times beyond available resources. This limitation restricts studies and has hindered a true understanding of the benefits of using IMS in DIA analyses, even though several studies have shown very promising results 18-22. To address this challenge, we adapted the Skyline software program 23 to accept and process IMS data from Agilent, Waters, and Bruker, in addition to also retaining all the other Skyline capabilities. In this manuscript, LC-IMS-CID-MS data from the Agilent instrument is showcased, but Skyline has also been adapted to support chromatogram extraction with IMS filtering for all of these vendors based on peptide search results from Spectrum Mill, ProteinLynx Global Server, and Mascot. Additionally, recent changes allow Skyline to support a compensation voltage optimization workflow for precursor selection by high field asymmetric IMS (FAIMS) on the SCIEX SelexION device.
Figure 1.
Precursor and fragment ions have the same IMS drift times in the IMS-MS and IMS-CID-MS spectra. Plots for 5 nM BSA spiked into yeast illustrating the A) IMS-MS and B) IMS-CID-MS spectra taken consecutively at 17.74 and 17.75 min. The fragment ions in B) can be observed at the same drift times as their precursors in A) due to IMS separation followed by CID. Two different regions are highlighted illustrated the precursors and corresponding fragments.
Skyline is an open source informatics tool, which has been validated in data dependent (DDA) and DIA approaches using both the LC and MS dimensions 24-27. To enable analyses of data having the IMS dimension, Skyline was modified to automatically extract peak areas using IMS drift times for a list of target peptides, in addition to the corresponding LC elution times and MS information. Furthermore, this modification allowed peak area extraction for both the precursor and all-ions fragmentation spectra, enabling an assessment of how the IMS dimension effected the quantitation and limit of detection for each peptide. This manuscript illustrates the changes to Skyline to read the IMS data, provides a tutorial of how to process LC-IMS-CID-MS data files with Skyline, and showcases the benefits afforded by adding the IMS dimension to DIA analyses of complex samples.
Materials and Methods
Dilution series acquisition
Bovine serum albumin (BSA) was purchased from Sigma-Aldrich (St. Louis, MO) and a tryptically digested yeast protein extract was purchased from Promega (Madison, WI). The BSA was tryptically digested and diluted with water to a total protein concentration of 0.5 μg/μL. The BSA was then spiked into the tryptically digested yeast extract at 7 different concentrations (100 pM, 1 nM, 5 nM, 10 nM, 50 nM 100 nM, 500 nM, and 1 μM), where a final concentration of 0.1 μg/μL was used for the yeast in all samples. A sample of BSA peptides in water was also prepared at 100 nM to develop the Skyline parameters for the target peptides.
Datasets for each sample were acquired by LC-IMS-MS using a Waters NanoAcquity HPLC system (Waters Corporation, Milford MA) and an Agilent 6560 IM-QTOF MS platform (Agilent Technologies, Santa Clara) 28-29. The HPLC system used reverse phase columns prepared in-house by slurry packing 3 μm Jupiter C18 (Phenomenex, Torrence, CA) into 40 cm × × 360 μm o.d. × 75 μm i.d. fused silica (Polymicro Technologies Inc., Phoenix, AZ) having a 1-cm sol-gel frit for media retention. Trapping columns were prepared similarly by slurry packing 5μm Jupiter C18 into a 4-cm length of 150 μm i.d. fused silica and fritted on both ends. Sample injections (5 μL) were trapped and washed on the trapping columns at 3 μL/min for 20 min prior to alignment with analytical columns. Mobile phases consisted of 0.1% formic acid in water (A) and 0.1% formic acid acetonitrile (B) and were operated at 300 nL/min with a 100-min gradient profile as follows (min:%B); 0:5, 2:8, 20:12, 75:35, 97:60, 100: 85. The LC was connected directly to the Agilent nanoESI source. Upon entering the source of the Agilent 6560 IM-QTOF MS platform, ions were passed through the inlet glass capillary, focused by a high-pressure ion funnel, and accumulated in an ion funnel trap. Ions were then pulsed into the 78.24 cm long IMS drift tube filled with ~ 3.95 torr of nitrogen gas, where they travelled under the influence of a weak electric field (10-20 V/cm). Ions exiting the drift tube were refocused by a rear ion funnel and the collision energy was alternated between 0 V and 29 V for acquisition of MS and all ions fragmentation spectra. The ions were then detected with the TOF MS and their arrival time (tA) were recorded for the 100-3200 m/z range.
Data processing in Skyline
43 peptides and 54 peptide precursors were placed in the library Skyline document and used for targets to determine the presence of BSA in the solutions. The 1 μM, 100 nM and 10 nM BSA digest samples in water were imported into Skyline 3.7.0.11317 using 20,000 TOF resolving power over the entire gradient for both MS1 and the CID-MS without any IMS filtering. The target set was then further reduced to the best 34 peptides and 38 precursors by inspecting the chromatograms of each precursor at the 3 different concentrations and eliminating any with large interferences. Finally, the dataset for 100 nM BSA in water was imported into this refined method document. This training set was used to determine expected elution and drift time for each targeted ion as described in the supplementary tutorial. After these characteristics were acquired, the document was saved once with the resulting drift times and once without them. The 8 yeast datasets were imported both with and without drift time filtering to evaluate the effect of the IMS dimension. Manual adjustment of the chromatogram peak integration took less than 1 hour for each document and was required at low concentrations because of the lack of matching labeled reference standards. Finally, the precursor and fragment area reports are included in the supplementary Skyline documents on Panorama 27 (http://panoramaweb.org/baker-ims.url) and resulted in 4 reports (LC-MS precursor extraction, LC-IMS-MS precursor extraction, LC-MS fragment extraction, and LC-IMS-MS fragment extraction). These reports contained peak area totals for 3 isotopes in MS1 and the 6 to 8 most intense y and b transitions in the fragmentation data - excluding y1, y2, b1, and b2 - from the library spectra (where 2 targets had 6 transitions, 3 had 7 and 33 had 8). These total peak areas were then analyzed to assess the impact of IMS drift time filtering on the observed linear dynamic range of the integrated peaks.
Results and Discussion
To evaluate the effect of utilizing the IMS dimension in multidimensional analyses and determine the performance of Skyline in analyzing the LC-IMS-CID-MS data, tryptically digested BSA was spiked at seven concentrations (100 pM, 1 nM, 5 nM, 10 nM, 100 nM, 500 nM, and 1 μM) into a tryptic yeast digest with a final peptide concentration of 0.1 μg/μL. Yeast was picked as the matrix of interest since most of the peptide components have a similar concentration range, providing more interfering peaks than samples with a higher dynamic range (e.g. plasma). MS1 and IMS-CID-MS all-ions fragmentation spectra were alternated every other second during each 100 minute LC run. Skyline was then utilized to extract the ion chromatograms and calculate peak areas for 38 different tryptic BSA target peptides in four ways including: LC-MS precursor extraction, LC-IMS-MS precursor extraction; LC-MS fragment extraction and LC-IMS-MS fragment extraction. These different extraction techniques enable the evaluation of how the IMS dimension effects the MS1 and fragment analyses. Using Skyline, a researcher was able to assess the multiple datasets and different analysis conditions in just a few hours and a step-by-step tutorial illustrating how to analyze the LC-IMS-CID-MS data with Skyline is included in the Supplemental Information. These analyses were then evaluated to determine the effect of the IMS dimension on the peptide quantitation and the results are shown below.
Effect of Using IMS Filtering on MS1 Spectral Analyses
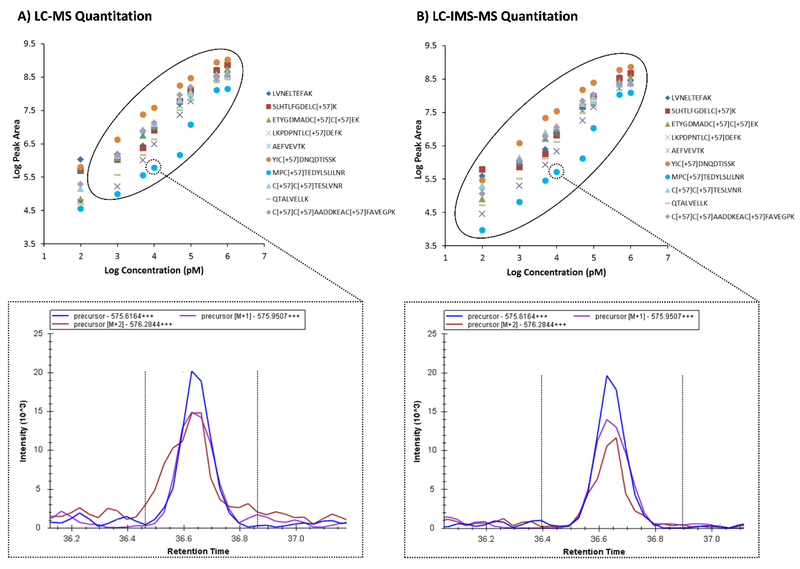
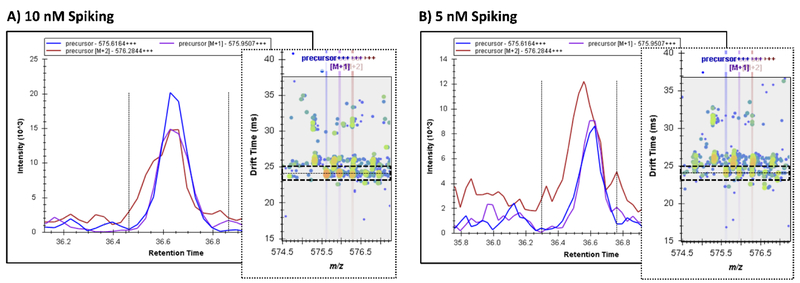
To assess the effect of the IMS dimension in complex proteomic sample analyses, initially we compared the MS1 peak extraction results, where first the LC and MS dimensions were used for peak area extraction (Figure 2, left) and then all three dimensions (LC, IMS and MS) were used (Figure 2, right). Only 10 BSA peptides are illustrated in Figure 2 for clarity. In these assessments, we found that the calibration curves for each peptide were more linear and had lower limits of detection when the IMS dimension was utilized. LODs of ~100 pM were observed for most peptides when the IMS dimension was applied in the analyses, and 1 nM when it was not. We also noted saturation at the 1 μM concentration level with and without IMS filtering, thus a dynamic range of ~3.5 orders of magnitude was noted with IMS filtering and 2.5 without. The linear regions for a majority of the peptides are circled in Figure 2. This effect was further evaluated by analyzing the MS1 extracted ion chromatograms (XICs) for each of the peptides and their monoisotopic m/z and the M+1 isotope peak. We found that at low concentration spiking levels when IMS filtering was not utilized, interferences from other peptides or background ions were noted in the XICs for either the precursors or their isotopes. This can be clearly seen for the second isotope of MPCTEDYSLILNR3+ in the 10 nM BSA/yeast sample (Figure 2, bottom), where its red peak appears to have a shoulder at an earlier retention time when IMS filtering was not applied. Since this effect appeared to be magnified at lower concentrations, both the 5 nM and 10 nM XICs of MPCTEDYSLILNR3+ and its isotopes were analyzed (Figure 3). Again, the second isotopic peak was greatly affected by an interfering ion from the yeast extract that was not changing in intensity with dilution of the BSA mixture. Fortunately, however, the BSA peptide of interest had an IMS drift time of 24 ms, while the interfering peptide occurred at 26 ms. This IMS separation allowed the interfering peak to be easily filtered out, resulting in better quantitation in the Skyline analyses.
Figure 2.
Addition of the IMS dimension enables better quantitation of MS1 data. Calibration curves for 10 of the BSA target peptides spiked into yeast and extracted in the MS1 spectra either A) without or B) with IMS filtering. IMS filtering illustrated a greater dynamic range for all peptides due to the reduction of noise in the monoisotopic and subsequent isotopic peaks. A specific example of interference is illustrated in the bottom XICs for the second isotope of MPCTEDYSLILNR3+ in the 10 nM BSA/yeast sample, where the red peak appears to have a shoulder at an earlier retention time when IMS filtering was not applied.
Figure 3.
Noise and peptides interference in MS1 evaluations of LC-MS data can be reduced using the IMS dimension. MS1 spectra for MPCTEDYSLILNR3+ and its isotopes are shown at A) 10 nM and B) 5 nM without IMS filtering. The [M+2] isotope is affected by a co-eluting peptide of a similar mass, however, the plots to the right of each XIC show that the two peptides are separated by the IMS dimension and IMS filtering would resolve the interference as shown in Figure 2B. The peptide of interested is shown at 24 ms, while the interfering peptide occurs at 26 ms and its contribution affects the [M+2] isotope peak, especially at lower concentrations.
Effect of Using IMS Filtering on Fragmentation Analyses
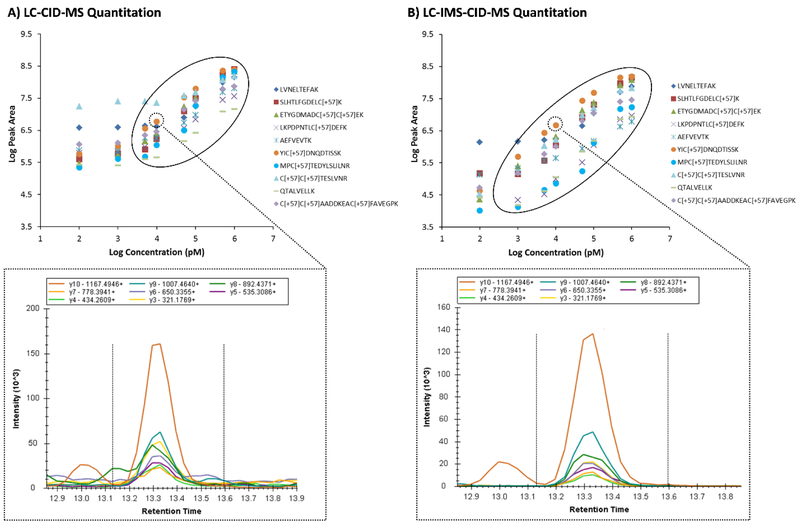
To evaluate the effect of the IMS dimension on the all-ions fragmentation data, again the peak area extraction data for the LC and MS dimensions (Figure 4, left) was compared to that using all three dimensions (LC, IMS and MS) (Figure 4, right). Ten BSA peptides are illustrated in Figure 4 for clarity. In these assessments, the 6-8 most intense y and b transition ions from the library spectra were analyzed for each peptide of interest. The calibration curves are shown for the extracted fragment peaks with the regions of linearity for a majority of the peptides circled. Interestingly, there was a much greater fall off in linearity for the fragmentation data than the MS1 data when IMS filtering was not employed. This caused the LOD to be approximately 1 nM for most peptides when the IMS dimension was utilized in the analyses, but 10 to 100 nM when it was not. Further, the dynamic range was reduced from 3 to 2 when IMS filtering was not utilized. To further investigate why the IMS dimension had such an impact on the all-ions fragmentation data, the XICs for different transition ions were evaluated. Due to the data being acquired with a DIA approach, numerous fragment ions occurred in each spectrum causing more interferences than when only MS1 conditions were used. This can be seen in the high baseline level of the XICs for the transition ions of YIC[+57]DNQDTISSK+ in the 10 nM BSA/yeast sample (bottom of Figure 4). Similar to the MS1 data, these interferences influenced the data more at the lower concentration levels making the calibration curves level off at much higher intensity levels than the peptides were spiked at. However, utilizing IMS filtering greatly reduced these interferences and cleaned up the background as shown in the XICs in the bottom right of Figure 4. To further illustrate this point, another example of the high amount of interference at low concentration levels is shown for the transition ions of SLHTLFGDELC[+57]K2+ in the 100 pM BSA/yeast sample (Figure 5). In this example, two ions co-elute in the LC dimension, but are separated by IMS. Since the transition ion of interest occurs at 29 ms and the interfering peak is at 33 ms, IMS filtering removes the interference and allows the Skyline software to acquire the transition ion signal without the background ion interference signal added. This enables more linearity in the calibration curves and lower limits of detection for all peak areas when IMS filtering is utilized.
Figure 4.
Addition of the IMS dimension enables better quantitation in fragmentation data. Calibration curves for 10 BSA target peptides spiked into yeast and extracted in the A) LC-CID-MS and B) LC-IMS-CID-MS all-ions fragmentation spectra. Like the MS1 spectra, IMS filtering illustrated a greater dynamic range for all peptides due to the reduction of noise. A specific example of interference is illustrated in the bottom XICs for the baseline area around the transitions of YiC[+57]DNQDTISSK+ in the 10 nM BSA/yeast sample.
Figure 5.
Interferences increase at lower concentrations in the all-ions fragmentation spectra when IMS filtering is not utilized. LC-CID-MS spectra for the transition ions of SLHTLFGDELC[+57]K2+ are shown at 100 pM A) without and B) with IMS filtering. The plots on the right of each XIC show two ions co-eluting in the LC dimension, but being separated by IMS. The transition of interest occurs at 29 ms, while the interfering ion is at 33 ms, causing noise around the transitions if IMS filtering is not utilized.
Conclusion
Due to the need to better characterize complex samples, we utilized multidimensional LC-IMS-CID-MS analyses to assess samples where BSA was spiked into a yeast extract at varying levels. To evaluate this multidimensional data, we also adapted the Skyline software to rapidly read and process these files. For the study, each sample was analyzed by alternating between MS1 and all-ions fragmentation using a DIA approach. Skyline was then used to extract the peak areas for 38 different tryptic BSA target peptides in four ways (LC-MS precursor extraction, LC-IMS-MS precursor extraction; LC-MS fragment extraction and LC-IMS-MS fragment extraction). These different extraction techniques allowed insight into how the IMS separation effected the quantitation and limits of detection for each peptide and transition ion in the MS1 and all-ions fragmentation spectra. In all cases, the addition of the IMS dimension removed noise from interfering peptides and fragments, resulting in better calibration curves and lower limits of detection for the peptides and transitions of interest. This data illustrates the power of adding the IMS dimension into LC-MS analyses when the DIA approach is used for complex sample analyses. However, without the newly added capabilities of Skyline to automatically and quickly process the LC-IMS-CID-MS, instead of taking hours, these different peak area extractions would have taken much longer or been impractical for the Agilent datasets. Therefore, this study presents an important informatics development enabling the use of multidimensional separations to characterize complex samples and provide rapid biological and environmental insights into various studies performed by the scientific community. Furthermore, a tutorial and all the data illustrated in this manuscript are provided in the Supplemental Information, so evaluation of the Skyline program with this data type can be assessed.
Supplementary Material
Acknowledgements
The authors would like to acknowledge John Fjeldsted for his help in editing the tutorial. Portions of this research were supported by grants from the National Institute of Environmental Health Sciences of the NIH (R01 ES022190 and P42 ES027704), National Institute of General Medical Sciences (P41 GM103493, R01 GM103551, and R01 GM121696), National Cancer Institute (R21 CA192983), and the Laboratory Directed Research and Development Program at Pacific Northwest National Laboratory. This research used capabilities developed by the Pan-omics program (funded by the U.S. Department of Energy Office of Biological and Environmental Research Genome Sciences Program). This work was performed in the W. R. Wiley Environmental Molecular Sciences Laboratory (EMSL), a DOE national scientific user facility at the Pacific Northwest National Laboratory (PNNL). PNNL is operated by Battelle for the DOE under contract DE-AC05-76RL0 1830.
Footnotes
Competing Financial Interests
The authors declare no competing financial interests.
References
- 1.Suhr H, Plasma Chromatography. Plenum Press: New York, 1984. [Google Scholar]
- 2.Henderson SC; Valentine SJ; Counterman AE; Clemmer DE, ESI/ion trap/ion mobility/time-of-flight mass spectrometry for rapid and sensitive analysis of biomolecular mixtures. Anal Chem 1999, 71 (2), 291–301. [DOI] [PubMed] [Google Scholar]
- 3.Valentine SJ; Counterman AE; Hoaglund CS; Reilly JP; Clemmer DE, Gas-phase separations of protease digests. J Am Soc Mass Spectrom 1998, 9 (11), 1213–6. [DOI] [PubMed] [Google Scholar]
- 4.Baker ES; Burnum-Johnson KE; Ibrahim YM; Orton DJ; Monroe ME; Kelly RT; Moore RJ; Zhang X; Theberge R; Costello CE; Smith RD, Enhancing bottom-up and top-down proteomic measurements with ion mobility separations. Proteomics 2015, 15 (16), 2766–76. [DOI] [PMC free article] [PubMed] [Google Scholar]
- 5.Guevremont R; Siu KW; Wang J; Ding L, Combined Ion Mobility/Time-of-Flight Mass Spectrometry Study of Electrospray-Generated Ions. Anal Chem 1997, 69 (19), 3959–65. [DOI] [PubMed] [Google Scholar]
- 6.Steiner WE; Clowers BH; Fuhrer K; Gonin M; Matz LM; Siems WF; Schultz AJ; Hill HH Jr., Electrospray ionization with ambient pressure ion mobility separation and mass analysis by orthogonal time-of-flight mass spectrometry. Rapid Commun Mass Spectrom 2001, 15 (23), 2221–6. [DOI] [PubMed] [Google Scholar]
- 7.Valentine SJ; Liu XY; Plasencia MD; Hilderbrand AE; Kurulugama RT; Koeniger SL; Clemmer DE, Developing liquid chromatography ion mobility mass spectometry techniques. Expert Rev Proteomic 2005, 2 (4), 553–565. [DOI] [PubMed] [Google Scholar]
- 8.Valentine SJ; Kurulugama RT; Bohrer BC; Merenbloom SI; Sowell RA; Mechref Y; Clemmer DE, Developing IMS-IMS-MS for rapid characterization of abundant proteins in human plasma. International Journal of Mass Spectrometry 2009, 283 (1-3), 149–160. [Google Scholar]
- 9.Crowell KL; Slysz GW; Baker ES; LaMarche BL; Monroe ME; Ibrahim YM; Payne SH; Anderson GA; Smith RD, LC-IMS-MS Feature Finder: detecting multidimensional liquid chromatography, ion mobility and mass spectrometry features in complex datasets. Bioinformatics 2013, 29 (21), 2804–5. [DOI] [PMC free article] [PubMed] [Google Scholar]
- 10.Crowell KL; Baker ES; Payne SH; Ibrahim YM; Monroe ME; Slysz GW; LaMarche BL; Petyuk VA; Piehowski PD; Danielson WF 3rd; Anderson GA; Smith RD, Increasing Confidence of LC-MS Identifications by Utilizing Ion Mobility Spectrometry. Int J Mass Spectrom 2013, 354–355, 312–317. [DOI] [PMC free article] [PubMed] [Google Scholar]
- 11.Burnum-Johnson KE; Nie S; Casey CP; Monroe ME; Orton DJ; Ibrahim YM; Gritsenko MA; Clauss TR; Shukla AK; Moore RJ; Purvine SO; Shi T; Qian W; Liu T; Baker ES; Smith RD, Simultaneous Proteomic Discovery and Targeted Monitoring using Liquid Chromatography, Ion Mobility Spectrometry, and Mass Spectrometry. Mol Cell Proteomics 2016, 15 (12), 3694–3705. [DOI] [PMC free article] [PubMed] [Google Scholar]
- 12.Lee S; Li Z; Valentine SJ; Zucker SM; Webber N; Reilly JP; Clemmer DE, Extracted Fragment Ion Mobility Distributions: A New Method for Complex Mixture Analysis. Int J Mass Spectrom 2012, 309, 154–160. [DOI] [PMC free article] [PubMed] [Google Scholar]
- 13.Distler U; Kuharev J; Navarro P; Tenzer S, Label-free quantification in ion mobility-enhanced data-independent acquisition proteomics. Nat Protoc 2016, 11 (4), 795–812. [DOI] [PubMed] [Google Scholar]
- 14.Purvine S; Eppel JT; Yi EC; Goodlett DR, Shotgun collision-induced dissociation of peptides using a time of flight mass analyzer. Proteomics 2003, 3 (6), 847–850. [DOI] [PubMed] [Google Scholar]
- 15.Doerr A, DIA mass spectrometry. Nature Methods 2015, 12 (1), 35–35. [Google Scholar]
- 16.Baker ES; Tang K; Danielson WF 3rd; Prior DC; Smith RD, Simultaneous fragmentation of multiple ions using IMS drift time dependent collision energies. J Am Soc Mass Spectrom 2008, 19 (3), 411–9. [DOI] [PMC free article] [PubMed] [Google Scholar]
- 17.Merenbloom SI; Koeniger SL; Valentine SJ; Plasencia MD; Clemmer DE, IMS-IMS and IMS-IMS-IMS/MS for separating peptide and protein fragment ions. Anal Chem 2006, 78 (8), 2802–9. [DOI] [PubMed] [Google Scholar]
- 18.Daly CE; Ng LL; Hakimi A; Willingale R; Jones DJ, Qualitative and quantitative characterization of plasma proteins when incorporating traveling wave ion mobility into a liquid chromatography-mass spectrometry workflow for biomarker discovery: use of product ion quantitation as an alternative data analysis tool for label free quantitation. Anal Chem 2014, 86 (4), 1972–9. [DOI] [PMC free article] [PubMed] [Google Scholar]
- 19.Geromanos SJ; Hughes C; Ciavarini S; Vissers JPC; Langridge JI, Using ion purity scores for enhancing quantitative accuracy and precision in complex proteomics samples. Analytical and Bioanalytical Chemistry 2012, 404 (4), 1127–1139. [DOI] [PubMed] [Google Scholar]
- 20.Distler U; Kuharev J; Navarro P; Levin Y; Schild H; Tenzer S, Drift time-specific collision energies enable deep-coverage data-independent acquisition proteomics. Nature Methods 2014, 11 (2), 167–+. [DOI] [PubMed] [Google Scholar]
- 21.Shliaha PV; Bond NJ; Gatto L; Lilley KS, Effects of Traveling Wave Ion Mobility Separation on Data Independent Acquisition in Proteomics Studies. Journal of Proteome Research 2013, 12 (6), 2323–2339. [DOI] [PubMed] [Google Scholar]
- 22.Rodriguez-Suarez E; Hughes C; Gethings L; Giles K; Wildgoose J; Stapels M; Fadgen KE; Geromanos SJ; Vissers JPC; Elortza F; Langridge JI, An Ion Mobility Assisted Data Independent LC-MS Strategy for the Analysis of Complex Biological Samples. Curr Anal Chem 2013, 9 (2), 199–211. [Google Scholar]
- 23.MacLean B; Tomazela DM; Shulman N; Chambers M; Finney GL; Frewen B; Kern R; Tabb DL; Liebler DC; MacCoss MJ, Skyline: an open source document editor for creating and analyzing targeted proteomics experiments. Bioinformatics 2010, 26 (7), 966–8. [DOI] [PMC free article] [PubMed] [Google Scholar]
- 24.Schilling B; Rardin MJ; MacLean BX; Zawadzka AM; Frewen BE; Cusack MP; Sorensen DJ; Bereman MS; Jing E; Wu CC; Verdin E; Kahn CR; Maccoss MJ; Gibson BW, Platform-independent and label-free quantitation of proteomic data using MS1 extracted ion chromatograms in skyline: application to protein acetylation and phosphorylation. Mol Cell Proteomics 2012, 11 (5), 202–14. [DOI] [PMC free article] [PubMed] [Google Scholar]
- 25.Rardin MJ; Schilling B; Cheng LY; MacLean BX; Sorensen DJ; Sahu AK; MacCoss MJ; Vitek O; Gibson BW, MS1 Peptide Ion Intensity Chromatograms in MS2 (SWATH) Data Independent Acquisitions. Improving Post Acquisition Analysis of Proteomic Experiments. Mol Cell Proteomics 2015, 14 (9), 2405–19. [DOI] [PMC free article] [PubMed] [Google Scholar]
- 26.Navarro P; Kuharev J; Gillet LC; Bernhardt OM; MacLean B; Rost HL; Tate SA; Tsou CC; Reiter L; Distler U; Rosenberger G; Perez-Riverol Y; Nesvizhskii AI; Aebersold R; Tenzer S, A multicenter study benchmarks software tools for label-free proteome quantification. Nat Biotechnol 2016, 34 (11), 1130–1136. [DOI] [PMC free article] [PubMed] [Google Scholar]
- 27.Sharma V; Eckels J; Schilling B; Ludwig C; Jaffe JD; MacCoss MJ; MacLean B, Panorama Public: A public repository for quantitative data sets processed in Skyline. Mol Cell Proteomics 2018. [DOI] [PMC free article] [PubMed] [Google Scholar]
- 28.May JC; Goodwin CR; Lareau NM; Leaptrot KL; Morris CB; Kurulugama RT; Mordehai A; Klein C; Barry W; Darland E; Overney G; Imatani K; Stafford GC; Fjeldsted JC; McLean JA, Conformational Ordering of Biomolecules in the Gas Phase: Nitrogen Collision Cross Sections Measured on a Prototype High Resolution Drift Tube Ion Mobility-Mass Spectrometer. Anal. Chem. 2014, 86 (4), 2107–2116. [DOI] [PMC free article] [PubMed] [Google Scholar]
- 29.Ibrahim YM; Baker ES; Danielson Iii WF; Norheim RV; Prior DC; Anderson GA; Belov ME; Smith RD, Development of a new ion mobility time-of-flight mass spectrometer. Int. J. Mass Spectrom 2015, 377, 655–662. [DOI] [PMC free article] [PubMed] [Google Scholar]
Associated Data
This section collects any data citations, data availability statements, or supplementary materials included in this article.


