

Abstract
Background
No study has examined how the pattern of income dynamics influence both of children’s BMI trajectory and health behaviors.
Objectives
To examine the association between household poverty dynamics and childhood overweight risk in the US.
Methods
Using the longitudinal data of 16,800 children (from kindergarten to the 8th grade) in the nationally representative US cohort-ECLS-K 1998–99, we examined the differences in BMI trajectory, weight-related health behaviors, and risk of overweight in association with household poverty dynamics during follow-up (never [no experience of poverty], transient [once], recurrent [≥2 times], and persistent poor [remained]) using mixed models with fractional polynomial functions and estimating equation models.
Results
Overall, children experiencing poverty were more likely to have adverse BMI growth trajectory and eating and sedentary behaviors compared to the never-poor. The recurrently poor children (12.8%) had the fastest BMI trajectory, highest overweight/obesity prevalence from 5 to 16 years old, and highest proportion of excessive soda/fast food consumption and irregular exercise at 8th grade than did others (p < 0.05). The persistently poor (8.4%) were the lowest in BMI growth trajectory, but became the second highest in childhood obesity through a steady increase in BMI over time. Children in the recurrently poor group had a 1.5 times (95% CI= 1.0–2.2) higher risk of overweight than those having never experienced poverty during follow-up.
Conclusions
The experience of recurrent household poverty had a significant association with children’s adverse eating behaviors and increased obesity risk subsequently.
Keywords: Household income, poverty, child, adolescent, obesity
Introduction
The relationship between socio-economic status (SES) and obesity is complex, varies by population groups, and may change over time1–3. Family SES is viewed as a major risk factor for childhood obesity.4–7 Children from low-socioeconomic households had a three to four times higher odds of obesity than children from higher-socioeconomic households.8 The magnitude of the socioeconomic disparities in overweight/obesity prevalence increased between 2003 and 2007, with substantial social inequalities persisting even after controlling for behavioral factors.8
For offspring during the years of childhood, the economic conditions of their families can be more dynamic than their parents’ educational achievements. Experiencing poverty during childhood has especially shown its associations with a wide variety of children’s health outcomes, as well as with their occupational and educational achievements, according to findings from cross-sectional studies.2, 9 A few longitudinal studies suggested the associations between income dynamics and children’s risk of obesity. One study found that children whose families had moved into low-income status during their childhood had a 2.4 times higher odds of being adolescents with obesity than children who had never experienced low income.10 Also, an increase in family income over a 4-year period was associated with a significant decrease in BMI Z-scores among girls.11
However, variable definitions of household income and statistical modeling approaches for classifying income dynamics have impeded consistent findings in the association with children’s obesity risk in previous studies.12, 13 No study has examined how the pattern of income dynamics influence both of children’s BMI trajectory and health behaviors.
Utilizing federal poverty thresholds and rigorous statistical methods, this study aimed to better understand the impact of household SES dynamics on child health behaviors and overweight/obesity risk from early childhood to adolescence. The findings may provide further insight about the vulnerable health needs of children and how to support them during times of economic challenge.
Methods
1. Study design and study sample
We used data from The Early Childhood Longitudinal Study, Kindergarten Class of 1998–99 (ECLS-K 1998–99), which followed a nationally representative sample of kindergarteners from diverse socioeconomic and ethnic backgrounds in the US to 8th grade. The present study included children with complete data on sex, ethnicity, height and weight (measured at least once during follow-up), and household poverty status (reported at least once during follow-up); the final sample size in this analysis was 16,800. All reported numbers about the sample size were rounded to the nearest 10 due to the confidentiality policy of the US Department of Education.
2. Assessment and measures
1) Household poverty dynamics
ECLS-K 1998–99 data provide a composite variable indicating whether the child lived in households with an income below, at, or above the federal poverty threshold during follow-up.14 Household poverty dynamics were classified as never poor; the transient poor (household became poor only once during follow-up); the recurrent poor (household became poor more than once); and the persistent poor (household was poor for four consecutive waves during follow-up), corresponding to classifications in previous literature.10, 12 Additional analysis was done by excluding those who had only a one-time observation of household poverty status during follow-up (n = 3460; 17.3% of the never poor and 59.9% of the persistent poor) to examine whether including a one-time poverty report may result in a different association between poverty dynamics and childhood obesity risk.
2) Child weight status
Child height and weight were measured twice by trained test administrators during the direct child assessments of the ECLS following the standardized protocol.14 More than 90% of ECLS-K participants had ≥ 1 times of repeated height and weight measurements, and the missing rates of anthropometric measurements remained relatively low across follow-up waves. Children’s BMI was obtained as a composite variable of the ECLS. We defined child BMI Z-score by age- and sex-specific BMI percentiles in the 2000 US CDC Growth Charts; overweight was defined as ≥ the 85th BMI percentile.15
3) Child health behaviors
Soda/fast food consumption
The ECLS-K asked about the frequency of eating a meal or snack from a fast food restaurant and drinking soda pop, sports drinks, or fruit drinks in the past week using a seven-point scale. The answers were converted into daily frequencies of consumption: 0, 0.2, 0.5, 1, 2, 3, and 4 times per day.14 We classified soda/fast food consumption levels as binary dietary behavior outcomes for the analysis: ≥ 4 times per week or less.16
Daily exercise
Children were asked how many of the past 7 days they had exercised or participated in physical activity that made them sweat and breathe hard for at least 20 minutes, such as soccer, running, swimming laps, or similar aerobic exercise. We defined the appropriate level of exercise as daily physical activity compared to irregular exercise.17
Screen time
We assessed children’s time spent on watching television, playing computer/video games or using the Internet for e-mailing, school work, etc. on typical weekdays. We set > 3 hours of daily recreational screen time as an excessive sedentary behavior.18
4) Socio-demographic characteristics
To consider the effects of family and household socio-demographic characteristics on childhood obesity, we used information about child age, sex, ethnicity (non-Hispanic White, non-Hispanic Black or African American, Hispanic, and Asian/Native Hawaiian or other Pacific Islander/American Indian or Alaska Native/non-Hispanic more-than-one-race), parental educational level (up to high school, above), the structure of the family (single parent, two parents), and maternal job status (full-time, part-time, not working).
3. Statistical analysis
We examined the distribution of socio-demographic characteristics of children and their families using baseline data (kindergarten, n = 16,240) and described children’s BMI Z-scores and overweight/obesity prevalence in five waves of the ECLS-K cohort (kindergarten, 1st grade (n = 14,840), 3rd (n = 13,490), 5th (n = 10,890), and 8th grades (n = 8,760) according to household poverty dynamics. Also, we compared the distributions of children’s adverse health behaviors at the last follow-up wave (8th grade) in the ECLS-K cohort, e.g., soda/fast food intakes, exercise, and screen time, also according to household poverty dynamics.
To define children’s BMI trajectories from 5 years to 16 years under different household poverty dynamics, we used mixed effect models with fractional polynomial functions. We chose the best combination of fractional polynomial functions (Figure 1) for modeling childhood BMI trajectories as a function of age after testing the models’ goodness of fits in diverse combinations of age terms19. With the estimated household poverty subgroup-specific fixed beta coefficients for fractional polynomial terms, we fit and plotted four BMI trajectory curves to present household poverty-specific predicted mean BMI by age (in months).
Figure 1.
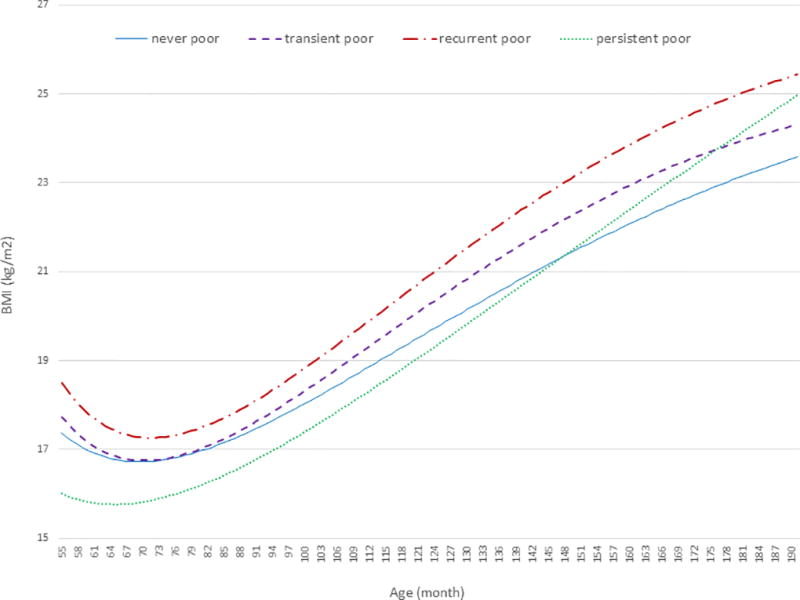
Household poverty dynamic-specific predicted mean BMI from 5 to 16 years among the US children: the ECLS-K 1998–99 of the US (n=16,800)
Data collected during five waves from ECLS-K were analyzed using mixed effect models with fractional polynomial functions for the household poverty dynamic-specific BMI growth curves with considering the complex sample design of ECLS.
Household poverty dynamics during follow-up was classified as the never poor; the transient poor (household became poor only once from 1st to 8th grade); the recurrent poor (household became poor more than once); and the persistent poor (household was poor for four consecutive waves).
The best fit mixed effect models for BMI trajectories by subgroups of household poverty dynamics were: Expected value of BMI= −165.9 + 640.4*age(−2) + 16.3*age(−0.5) − 0.4*age + e in never poor group; −250.4 + 924.4*age(−2) + 24.4*age(−0.5) − 0.7*age + e in transient poor group; 3) −272.6 + 1012.0*age(−2) + 26.2*age(−0.5) − 0.7*age + e in recurrent poor group; 4) −84.4 + 371.3*age(−2) + 7.8*age(−0.5) − 0.1*age + e in persistent poor group.
Finally, to examine the longitudinal association between household poverty dynamics (classified as four groups, see above) and risk of childhood overweight/obesity (repeated measures in five consecutive waves), we used estimating equation models using logistic link and unstructured covariance matrix after adjusting for sex, race/ethnicity, wave, family structure, parental education, mother’s work status, and the interaction between household income dynamic and race/ethnicity. Our models included fixed and random effects (allowing individuals to have their own intercepts) and combinations of age terms (age, age2, and age3) based on the statistical significance of the model.
All analyses were conducted using SAS 9.3 (SAS Institute, Cary, NC) and STATA 14 (StataCorp., College Station, TX) after considering the longitudinal sampling weights of the ECLS to reflect the outcomes of the initial population and give nationally representative estimates.
Results
Household poverty dynamics and childhood trajectories in BMI and overweight/obesity
At baseline, the children’s average age was 6.3 years (standard deviation = 0.4); about 50% were boys (Supplemental material 1). During the 8-year period, about 30% of these children experienced household poverty at least once, 12.8% were in poverty more than two times (‘recurrent poor’), and 8.4% maintained poverty status (‘persistent poor’) through follow-up.
The recurrent and persistent poor groups had similar socio-demographic characteristics: they had a higher rate of African American (31.5, 45.0%, respectively) and Hispanic (33.3, 30.6%, respectively) populations, lower levels of parental education (up to high school: 71.6%, 83.3%, respectively), and greater single-parent status (43.5%, 53.4%, respectively) than those in the transient (became poor only once during follow-up) or never-poor groups. The persistently poor group had the highest rate of non-working mothers (59.3%) compared to other groups that experienced poverty.
Table 1 shows the cross-sectional comparison of mean BMI Z-scores and overweight/obesity rates by household poverty dynamics. The recurrently poor maintained the highest mean BMI Z-scores and overweight/obesity rates in the four consequent waves, although there was no significant difference in this group for the initial kindergarten wave. The transient poor followed, with higher BMI Z-scores than the other poverty groups; however, the persistently poor became the second-highest group in childhood obesity by the 8th grade.
Table 1.
Comparing mean BMI Z-score and overweight/obesity prevalence (%) by household poverty dynamics1 in five waves of ECLS-K 1998–99 of the US
| Kindergarten (n=16240) |
1st grade (n=14840) |
3rd grade (n=13490) |
5th grade (n=10890) |
8th grade (n=8760) |
|
|---|---|---|---|---|---|
| 1. BMI Z score | |||||
| full sample | 0.35 | 0.34 | 0.51 | 0.60 | 0.57 |
| never poor | 0.32 | 0.31 | 0.48 | 0.53 | 0.51 |
| transient poor | 0.39 | 0.39 | 0.57 | 0.76 | 0.62 |
| recurrent poor | 0.50 | 0.48 | 0.65 | 0.87 | 0.82 |
| persistent poor | 0.31 | 0.35 | 0.48 | 0.59 | 0.70 |
| p | 0.14 | <0.001 | 0.12 | 0.003 | <0.001 |
| 2. Overweight/ obesity prevalence2 (%) | |||||
| full sample | 25.2 | 24.9 | 32.5 | 38.1 | 34.6 |
| never poor | 24.4 | 23.7 | 30.8 | 34.8 | 31.7 |
| transient poor | 26.4 | 27.2 | 36.1 | 44.7 | 38.2 |
| recurrent poor | 30.0 | 30.1 | 39.5 | 51.4 | 45.3 |
| persistent poor | 23.0 | 23.5 | 31.7 | 37.9 | 39.0 |
| p | 0.24 | 0.09 | 0.02 | <0.001 | <0.001 |
Sample sizes rounded to the nearest 10 according to the ECLS-K requirement for restricted-use data.
Population projected percentage was presented from Survey procedures in SAS after accounting the complex sample design of ECLS.
Household Poverty level was obtained as composite variables of ECLS (living in households with incomes below the federal poverty threshold vs. at or above). Household poverty dynamics during follow-up were classified as the never poor; the transient poor (household became poor only once from 1st to 8th grade); the recurrent poor (household became poor more than once); the persistent poor (household was poor for four consecutive waves).
BMIs were obtained as composite variables of ECLS and BMI Z-score was defined by the in the age-sex-specific CDC 2000 growth chart. Overweight and obese were defined by ≥85 percentile of CDC growth charts 2000.
Our longitudinal analysis described household-poverty-dynamic-specific childhood BMI trajectories (Figure 1). The recurrent poor had the highest BMI curves from ages 5 to 16 years. The transient poor kept the second-highest BMI up to 177 months. The persistent poor had the lowest BMI at an early age; however, they had the steepest slope of BMI increase afterward and became the second-highest group in BMI trajectory starting at 178 months and beyond. The never-poor became the lowest BMI group after 143 months. Additional data analysis without the children having only a one-time poverty report showed a similar association between household poverty dynamics and childhood BMI trajectory (not reported).
Association between household poverty dynamics and childhood health behaviors at 8th grade
We cross-sectionally compared childhood obesity-related health behaviors by household income dynamics and found a significant difference in children’s soda and fast food intakes, exercise frequency, and screen time duration at the 8th grade (the last follow-up wave; p < 0.05, Table 2). Overall, about one-third of the children drank soda more than three times per week (31.8%); two-thirds did not exercise for at least 20 minutes a day (75.1%) and had heavy screen time (> 3hours/ day, 72.1%).
Table 2.
Association between household poverty dynamics and child eating and physical activity behaviors at the 8th grade (the final wave): the ECLS-K 1998–99 of the US
| n3 | % full sample |
never poor |
transient poor |
recurrent poor |
persistent poor |
p | |
|---|---|---|---|---|---|---|---|
| 1) Soda ≥ 4 times per week | 5,320 | 31.8 | 30.1 | 35.5 | 38.8 | 32.5 | 0.03 |
| 2) fast food ≥ 4 times per week | 6,190 | 16.6 | 13.1 | 22.0 | 27.9 | 24.6 | <0.001 |
| 3) Doing exercise1 not everyday | 6,440 | 75.1 | 73.4 | 79.2 | 81.5 | 75.6 | 0.005 |
| 4) screen time2 > 3hr/day | 6,320 | 72.1 | 68.5 | 79.9 | 80.8 | 81.6 | <0.001 |
Do exercise or participate in physical activity for at least 20 minutes that made child sweat and breathe hard, such as basketball, soccer, running, swimming laps, fast bicycling, fast dancing, or similar aerobic exercise.
Defined by the sum of time spent on TV, video, and internet use in a week.
Available data was varied by children’s response rates for each survey questions.
In general, children experiencing poverty were more likely to have adverse eating and sedentary behaviors compared to the never-poor; the recurrent poor had higher rates of frequent soda and fast food consumption (≥ four times per week: 38.8%, 27.9%, respectively) and more irregular exercise (81.5%) than the others. The persistently poor had the highest rate of excessive screen time (81.6%).
Longitudinal association of household poverty dynamics with overweight and obesity risk
Longitudinal analysis of the association between household income dynamics and overweight/obesity risk during the 8-year follow-up showed that the recurrent poor were 1.5 times more likely to be children with overweight/obesity than the never-poor (OR = 1.49 [95% CI = 1.01–2.18]) during follow-up from ages 5 to 16 years, after adjusting for individual and household characteristics. No significant difference was shown in the childhood obesity risk among transiently (OR = 1.17 [95% CI = 0.89–1.55]) or persistently poor children (OR = 1.11 [95% CI = 0.59–2.08]) vs. the never-poor. No significant interactions were found between race/ethnicity (p = 0.42), gender (p = 0.41), and weight status at baseline (p = 0.28) with household poverty dynamics on the longitudinal risk of childhood overweight/obesity. Our additional sensitivity analysis of data without the children having only a one-time poverty report showed a similar association between household poverty dynamics and childhood obesity risk (not reported).
Discussion
This is study used nationally representative longitudinal data and reported the relationship between family SES and BMI trajectories and overweight risk during childhood and adolescence with a large study sample. The pattern of household poverty dynamics affects childhood BMI growth and overweight/obesity risk in the US. Recurrently and persistently poor groups were characterized by being primarily African American and Hispanic, having less-educated parents, and having more single parents than the other groups. In particular, the recurrent poor had the highest BMI and overweight/obesity rate from the ages of 5 to 16 years; the persistently poor had started with the lowest BMI level in the early ages but became the second-highest in BMI trajectories and overweight/obesity rate by the 8th grade. The experience of childhood poverty was associated with child health behaviors at the 8th grade as well: the recurrently poor were more likely to have excessive soda and fast food intake and irregular exercise than the other poverty groups. More than 80% of the persistently poor had excessive screen time. In the longitudinal analysis, the recurrently poor had a 1.5 times higher risk of being children with overweight/obesity during follow-up than the never-poor, after adjusting for various socio-demographics.
The US population has a higher poverty rate ratio than other developed countries (USA: 0.17 vs. Finland: 0.07, France: 0.08, United Kingdom: 0.10, Canada:0.13 in OECD 2013).20 The official US Census Bureau statistics estimated that 43 million persons were poor in 2015, and 19.7% of children were living in poverty.21 African American and Hispanic children have a higher poverty rate than white children2. Children experiencing the longest years in poverty were those with mothers who were unmarried (average time: 5.4 years) or did not have a high school degree (5.0 years).22 Our study also found consistent socio-demographic characteristics in poor groups defined by household poverty dynamics. Children from persistently and recurrently poor households were reported to constitute 21.2% of those in the US in 1999, and they were more likely to be African American or Hispanic, having a low parental education level, and more single parents than other poverty status groups.
While entire households experience poverty, children are especially vulnerable to inadequate food, energy, transportation, and housing and the absence of psychological buffering from the stresses and harms of poverty, which can lead to adverse physical health, socioemotional development, and academic achievement through a lifetime.23 In life course perspective, patterns of poverty experience during childhood could have a strong effect in a person’s health trajectories. Children may remain in poverty throughout childhood or rotate in and out of poverty over time. Worldwide, about 37% of children experience some level of poverty for some period of time.24 Most studies investigating the association between childhood SES and adulthood obesity or chronic diseases use cross-sectional data for one measure of childhood SES.10 The few longitudinal studies have found that downward mobility or persistently low income were associated with a greater risk of obesity during childhood in the US.10, 11, 25 A birth cohort in New York state found that children who moved into low-income during their childhoods were 2.4 times more likely to be adolescents with obesity, while children who were held in poverty were 2.4 times more likely to maintain overweight.10 Girls in the Early Childhood Longitudinal Survey Birth Cohort also had a significant decrease in BMI Z-score during the ages of two to six years due to an increase in poverty to income ratio (= family income divided by poverty status; β = −0.002; 95% CI = [−0.042, −0.002]).11 However, variable definitions of household income and statistical modeling approaches for classifying income dynamics have impeded consistent findings in the association with children’s obesity risk in previous studies;12, 13 and no study has examined how children’s BMI trajectory and health behaviors are influenced by the pattern of income dynamics with which they live.26, 27
Our study found that children from recurrently poor households were 1.5 times more likely to be children with overweight or obesity during follow-up from ages 5 to 16 years compared to children who had never been poor. The recurrently poor were also the highest in BMI level and overweight/obesity prevalence compared to the persistently or transiently poor groups, as well. The persistently poor had the lowest rate of childhood obesity at the beginning of follow-up but grew to be the second highest group at 8th grade after steady increases in BMI throughout childhood. There are two potential explanations for these findings. First, the mechanisms that could cause obesity in children who rotated in and out of poverty over time compared to children who remained in poverty are likely different.10 Children with persistent household poverty may have low birth weight and premature risks in early life and be used to food insecurity and fewer physical activity resources in low-income neighborhoods.28 In contrast, some family events such as divorce, loss of jobs, or accidents/ disasters may place children in more stressful circumstances due to experiencing the ups and downs of SES throughout cycles of rotating in and out of poverty, which may lead to further mental stress and worsen child eating behaviors and levels of physical activity.10, 29 In addition, the accumulated exposure of adverse eating habits and an excessively sedentary life may lead both recurrently and persistently poor groups to have higher risks of childhood obesity than the other poor groups.30 We found that at the age of 16, the recurrently poor had the highest BMI and overweight/obesity rate, but the persistently poor could exceed the obesity risk of the recurrently poor group during late adolescence or adulthood. Much additional work is needed to confirm our results and to examine the mechanisms connecting poverty dynamics to obesity risk.
This study has some limitations. Due to missing responses and those lost to follow-up, only a part of child health behaviors in the 8th grade was examined. The relatively small sample size of the poor groups may not allow us to detect significant differences in the association between household poverty dynamics and childhood obesity risk by ethnicity, gender, or baseline weight status. However, this study uses a nationally representative sample, longitudinal data, and offers a life course perspective on examining how household poverty experience influences the development of adverse child health behaviors and overweight/obesity risks. Further investigation may help to address whether the obesity risk among the persistently poor would increase more than that in the recurrently poor if there were long-term follow-up. These findings provide insight as to how to better support child health when families experience economic challenges.
In conclusion, childhood poverty experience associates with significant differences in children’s health behaviors and obesity risks in the US. Supporting effort for the children who rotate in and out of poverty needs to focus on healthy eating and physical activity to prevent childhood obesity.
Supplementary Material
What is already known about this subject
Family socioeconomic status (SES) is viewed as a major risk factor for childhood obesity.
Cross-sectional studies found that experiencing poverty during childhood is associated with children’s adverse health outcomes.
What this study adds
This study reported how children’s BMI trajectories and their health behaviors were associated with family income dynamics during 8 years.
The recurrently poor had the fastest BMI trajectory and the highest overweight/obesity prevalence over a 8-year period and the highest proportion of adverse eating and exercise habits at the 8th grade.
Children among the recurrent poor had a 1.5 times higher risk of overweight/obesity during follow-up than those having never experienced poverty.
Supporting effort for the children who rotate in and out of poverty needs to focus on healthy behaviors to prevent childhood obesity.
Acknowledgments
The present study is funded in part by a research grant from the US National Institutes of Health (NIH), the Eunice Kennedy Shriver National Institute of Child Health & Human Development (NICHD, 1R01HD064685-01A1). The content of the paper is solely the responsibility of the authors and does not necessarily represent the official views of the funder.
JM was responsible for the research idea, study design, data management and analysis, interpreting the analysis results, and drafting the manuscript. YW directed the study, secured research funding, provided administrative support, and critically revised the manuscript. HX critically revised the manuscript. All authors contributed to study design, data analysis, and writing of the manuscript. All authors had final responsibility for the decision to submit for publication. We would like to thank Dr. Brenda Denzler for her assistance in improving the manuscript.
Footnotes
Conflicts of interest
The authors declare no conflict of interest.
No financial disclosures were reported by the authors of this paper.
References
- 1.Powell LM, Wada R, Krauss RC, Wang Y. Ethnic disparities in adolescent body mass index in the United States: the role of parental socioeconomic status and economic contextual factors. Soc Sci Med. 2012;75(3):469–476. doi: 10.1016/j.socscimed.2012.03.019. [DOI] [PMC free article] [PubMed] [Google Scholar]
- 2.Wang Y, Zhang Q. Are American children and adolescents of low socioeconomic status at increased risk of obesity? Changes in the association between overweight and family income between 1971 and 2002. Am J Clin Nutr. 2006;84(4):707–716. doi: 10.1093/ajcn/84.4.707. [DOI] [PubMed] [Google Scholar]
- 3.Wang Y, Beydoun MA. The obesity epidemic in the United States--gender, age, socioeconomic, racial/ethnic, and geographic characteristics: a systematic review and meta-regression analysis. Epidemiol Rev. 2007;29:6–28. doi: 10.1093/epirev/mxm007. [DOI] [PubMed] [Google Scholar]
- 4.Cameron AJ, Spence AC, Laws R, Hesketh KD, Lioret S, Campbell KJ. A Review of the Relationship Between Socioeconomic Position and the Early-Life Predictors of Obesity. Curr Obes Rep. 2015;4(3):350–362. doi: 10.1007/s13679-015-0168-5. [DOI] [PubMed] [Google Scholar]
- 5.Ulijaszek SJ, Pentecost M, Marcus C, Karpe F, Fruhbeck G, Nowicka P. Inequality and childhood overweight and obesity: a commentary. Pediatr Obes. 2017;12(3):195–202. doi: 10.1111/ijpo.12128. [DOI] [PubMed] [Google Scholar]
- 6.Morris TT, Northstone K, Howe LD. Examining the association between early life social adversity and BMI changes in childhood: a life course trajectory analysis. Pediatr Obes. 2016;11(4):306–312. doi: 10.1111/ijpo.12063. [DOI] [PMC free article] [PubMed] [Google Scholar]
- 7.Young DR, Koebnick C, Hsu JY. Sociodemographic associations of 4-year overweight and obese incidence among a racially diverse cohort of healthy weight 18-year-olds. Pediatr Obes. 2017;12(6):502–510. doi: 10.1111/ijpo.12173. [DOI] [PubMed] [Google Scholar]
- 8.Singh GK, Siahpush M, Kogan MD. Rising social inequalities in US childhood obesity, 2003–2007. Ann Epidemiol. 2010;20(1):40–52. doi: 10.1016/j.annepidem.2009.09.008. [DOI] [PubMed] [Google Scholar]
- 9.Gordon-Larsen P, Adair LS, Popkin BM. The relationship of ethnicity, socioeconomic factors, and overweight in US adolescents. Obes Res. 2003;11(1):121–129. doi: 10.1038/oby.2003.20. [DOI] [PubMed] [Google Scholar]
- 10.Demment MM, Haas JD, Olson CM. Changes in family income status and the development of overweight and obesity from 2 to 15 years: a longitudinal study. BMC Public Health. 2014;14:417. doi: 10.1186/1471-2458-14-417. [DOI] [PMC free article] [PubMed] [Google Scholar]
- 11.Oddo VM, Jones-Smith JC. Gains in income during early childhood are associated with decreases in BMI z scores among children in the United States. Am J Clin Nutr. 2015;101(6):1225–1231. doi: 10.3945/ajcn.114.096693. [DOI] [PMC free article] [PubMed] [Google Scholar]
- 12.Margerison-Zilko CE, Cubbin C. Dynamic poverty experiences and development of overweight in a prospective cohort of US children aged 4–14 years. Obesity (Silver Spring) 2013;21(7):1438–1445. doi: 10.1002/oby.20333. [DOI] [PMC free article] [PubMed] [Google Scholar]
- 13.Jones-Smith JC, Dieckmann MG, Gottlieb L, Chow J, Fernald LC. Socioeconomic status and trajectory of overweight from birth to mid-childhood: the Early Childhood Longitudinal Study-Birth Cohort. PLoS One. 2014;9(6):e100181. doi: 10.1371/journal.pone.0100181. [DOI] [PMC free article] [PubMed] [Google Scholar]
- 14.Tourangeau K, Nord C, Lê T, Sorongon AG, Najarian M. Early Childhood Longitudinal Study, Kindergarten Class of 1998–99 (ECLS-K), Combined User’s Manual for the ECLS-K Eighth-Grade and K–8 Full Sample Data Files and Electronic Codebooks (NCES 2009–004) National Center for Education Statistics, Institute of Education Sciences, U.S. Department of Education; Washington, DC: 2009. [Google Scholar]
- 15.CDC. [cited 2016 Jul. 19];2000 growth chart. Defining childhood obesity. Available from: https://www.cdc.gov/obesity/childhood/defining.html.
- 16.American Heart Association. [cited 2015 Dec. 19];American Heart Association Comments on the World Health Organization's "Guideline: Sugars intake for adults and children". 2014 Available from: https://www.heart.org/idc/groups/ahaecc-public/@wcm/@adv/documents/downloadable/ucm_463487.pdf.
- 17.Global recommendations on physical activity for health. Geneva, Switzerland: World Health Organization (WHO) Press; 2010. [PubMed] [Google Scholar]
- 18.American Academy of Pediatrics, Committee on Public Education. Media education. Pediatrics. 2010 In press. [Google Scholar]
- 19.Wen X, Kleinman K, Gillman MW, Rifas-Shiman SL, Taveras EM. Childhood body mass index trajectories: modeling, characterizing, pairwise correlations and socio-demographic predictors of trajectory characteristics. BMC Med Res Methodol. 2012;12:38. doi: 10.1186/1471-2288-12-38. [DOI] [PMC free article] [PubMed] [Google Scholar]
- 20.OECD. [cited 2017 May 19];Poverty rate (indicator) 2017 doi: 10.1787/0fe1315d-en. Available from: https://data.oecd.org/inequality/poverty-rate.htm. [DOI]
- 21.U.S. Census Bureau. [cited 2017 May 19];Income and Poverty in the United States. 2015 Available from: https://www.census.gov/library/publications/2016/demo/p60-256.html.
- 22.Magnuson K. Reducing the effects of poverty through early childhood interventions. Fast Focus-Institute for Research on Poverty. 2013;17 [Google Scholar]
- 23.AAP COUNCIL ON COMMUNITY PEDIATRICS. Poverty and Child Health in the United States. Pediatrics. 2016;137(4):e20160339. doi: 10.1542/peds.2016-0339. [DOI] [PubMed] [Google Scholar]
- 24.Ratcliffe C, McKernan SM. Childhood poverty persistence: facts and consequences. [cited 2017 May 19];Urban Institute Brief. 2010 Jun; Available from: www.urban.org/UploadedPDF/412126-child-povertypersistence.pdf.
- 25.Kendzor DE, Caughy MO, Owen MT. Family income trajectory during childhood is associated with adiposity in adolescence: a latent class growth analysis. BMC Public Health. 2012;12:611. doi: 10.1186/1471-2458-12-611. [DOI] [PMC free article] [PubMed] [Google Scholar]
- 26.Jin Y, Jones-Smith JC. Associations between family income and children's physical fitness and obesity in California, 2010–2012. Prev Chronic Dis. 2015;12:E17. doi: 10.5888/pcd12.140392. [DOI] [PMC free article] [PubMed] [Google Scholar]
- 27.Appelhans BM, Fitzpatrick SL, Li H, Cail V, Waring ME, Schneider KL, et al. The home environment and childhood obesity in low-income households: indirect effects via sleep duration and screen time. BMC Public Health. 2014;14:1160. doi: 10.1186/1471-2458-14-1160. [DOI] [PMC free article] [PubMed] [Google Scholar]
- 28.Miller JE, Korenman S. Poverty and children's nutritional status in the United States. Am J Epidemiol. 1994;140(3):233–243. doi: 10.1093/oxfordjournals.aje.a117242. [DOI] [PubMed] [Google Scholar]
- 29.Adler NE, Stewart J. Health disparities across the lifespan: meaning, methods, and mechanisms. Ann N Y Acad Sci. 2010;1186:5–23. doi: 10.1111/j.1749-6632.2009.05337.x. [DOI] [PubMed] [Google Scholar]
- 30.Ferraro KF, Shippee TP, Schafer MH. Cumulative inequality theory for research on aging and the life course. In: Bengtson VL, Gans D, Putney N, Silverstein M, editors. Handbook of theories of aging. 2. New York: Springer Publishing Company; 2008. pp. 413–33. [Google Scholar]
Associated Data
This section collects any data citations, data availability statements, or supplementary materials included in this article.