

Abstract
The salience network is a distributed neural system that maintains homeostasis by regulating autonomic nervous system activity and social-emotional function. Here we examined how within-network connectivity relates to individual differences in human (including males and females) baseline parasympathetic and sympathetic nervous activity. We measured resting autonomic nervous system physiology in 24 healthy controls and 23 patients with behavioral variant frontotemporal dementia (bvFTD), a neurodegenerative disease characterized by baseline autonomic deficits. Participants also underwent structural and task-free fMRI. First, we used voxel-based morphometry to determine whether salience network atrophy was associated with lower baseline respiratory sinus arrhythmia (a parasympathetic measure) and skin conductance level (a sympathetic measure) in bvFTD. Next, we examined whether functional connectivity deficits in 21 autonomic-relevant, salience network node-pairs related to baseline autonomic dysfunction. Lower baseline respiratory sinus arrhythmia was associated with smaller volume in left ventral anterior insula (vAI), weaker connectivity between bilateral vAI and bilateral anterior cingulate cortex (ACC), and stronger connectivity between bilateral ACC and bilateral hypothalamus/amygdala. Lower baseline skin conductance level, in contrast, was associated with smaller volume in inferior temporal gyrus, dorsal mid-insula, and hypothalamus; weaker connectivity between bilateral ACC and right hypothalamus/amygdala; and stronger connectivity between bilateral dorsal anterior insula and periaqueductal gray. Our results suggest that baseline parasympathetic and sympathetic tone depends on the integrity of lateralized salience network hubs (left vAI for parasympathetic and right hypothalamus/amygdala for sympathetic) and highly calibrated ipsilateral and contralateral network connections. In bvFTD, deficits in this system may underlie resting parasympathetic and sympathetic disruption.
SIGNIFICANCE STATEMENT The salience network maintains homeostasis and regulates autonomic nervous system activity. Whether within-network connectivity patterns underlie individual differences in resting parasympathetic and sympathetic nervous system activity, however, is not well understood. We measured baseline autonomic nervous system activity in healthy controls and patients with behavioral variant frontotemporal dementia, a neurodegenerative disease characterized by resting autonomic deficits, and probed how salience network dysfunction relates to diminished parasympathetic and sympathetic outflow. Our results indicate that baseline parasympathetic and sympathetic tone are the product of complex, opposing intranetwork nodal interactions and depend on the integrity of highly tuned, lateralized salience network hubs (i.e., left ventral anterior insula for parasympathetic activity and right hypothalamus/amygdala for sympathetic activity).
Keywords: autonomic nervous system, frontotemporal dementia, parasympathetic, salience network, sympathetic
Introduction
The salience network is a distributed brain system that produces emotions and monitors the dynamic conditions of the body (Seeley et al., 2007). With hubs in ventral anterior insula (vAI) and anterior cingulate cortex (ACC) and tight connections with ventral striatum and central pattern generators, including the hypothalamus, amygdala, and periaqueductal gray (PAG), the salience network participates in, and may coordinate, autonomic nervous system (ANS) regulation. During emotions, the salience network triggers visceromotor changes that disrupt quiescence and move an organism from rest to action. At rest, the salience network adjusts the internal milieu to meet current metabolic and motivational conditions (Benarroch, 1993; Carmichael and Price, 1995; Ongür and Price, 2000; Saper, 2002; Barbas et al., 2003a; Critchley, 2005; Beissner et al., 2013; Critchley and Harrison, 2013). A continuous stream of sensory information travels from the spinal cord through the brainstem via the lamina I spinothalamic pathway and vagal afferents. This interoceptive information is then relayed to the dorsal posterior insula, mid-insula, and onward to vAI, a physiological integration site that is thought to represent internal feeling states that color subjective emotional experience and shape behavior (Craig, 2002, 2009; Critchley, 2004; Damasio and Carvalho, 2013).
The salience network influences both the sympathetic and parasympathetic branches of the ANS. The sympathetic ANS (SANS) responds to arousing or threatening stimuli and mobilizes behavior (Saper, 2002). The parasympathetic ANS (PANS), in contrast, downregulates arousal via the inhibitory influence of the vagus nerve. The vagus sends efferent signals from the brain to the internal organs, reducing heart rate to a pace that is slower than that set by the sinoatrial node (Carlson et al., 1992; Levy et al., 1993; Saper, 2002; Thayer and Siegle, 2002) and creating a “rest and digest” state that fosters interpersonal engagement and emotional attunement (Porges, 2001). These two ANS branches appear to be asymmetrically organized in the brain. Whereas right-lateralized (i.e., nondominant hemisphere) neural pathways promote SANS outflow, left-lateralized (i.e., dominant hemisphere) systems facilitate PANS activity (Oppenheimer et al., 1992, 1996; Yoon et al., 1997; Wittling et al., 1998a, b; Craig, 2005; Guo et al., 2016).
Although previous research has examined how salience network connectivity relates to PANS activity (Guo et al., 2016), it remains unknown how within-network nodal interactions relate to individual differences in resting PANS and SANS function. The behavioral variant of frontotemporal dementia (bvFTD) is a neurodegenerative disease that targets the salience network (Seeley et al., 2007; Zhou et al., 2010) and offers a unique opportunity to examine how salience network integrity relates to ANS deficits. In bvFTD, there is progressive deterioration of social behavior, empathy, and emotion (Rascovsky et al., 2007; Seeley et al., 2008, 2012; Kumfor and Piguet, 2012; Barsuglia et al., 2014; Joshi et al., 2014b; Levenson et al., 2014; Mendez et al., 2014). In addition to deficits in emotion generation (Sturm et al., 2006, 2008; Eckart et al., 2012), patients with bvFTD also exhibit PANS and SANS deficits at rest (Joshi et al., 2014a; Guo et al., 2016).
In the present study, we investigated whether specific patterns of salience network dysfunction related to resting PANS and SANS deficits. We measured baseline ANS activity in patients with bvFTD and healthy controls (HCs) during a laboratory-based testing session. Participants also underwent structural MRI and task-free fMRI. Building on previous studies (Benarroch, 1993; Thayer and Lane, 2000; Craig, 2002; Saper, 2002; Seeley et al., 2012; Critchley and Harrison, 2013; Damasio and Carvalho, 2013), we developed a neural systems model (see Fig. 1A) to guide our examination of nodes and edges (i.e., connectivity between node-pairs) that are embedded in the salience network and support ANS activity. We hypothesized that lateralized network impairment would be associated with resting ANS deficits such that left-sided dysfunction would predict diminished PANS activity whereas right-sided dysfunction would predict lower SANS activity.
Figure 1.

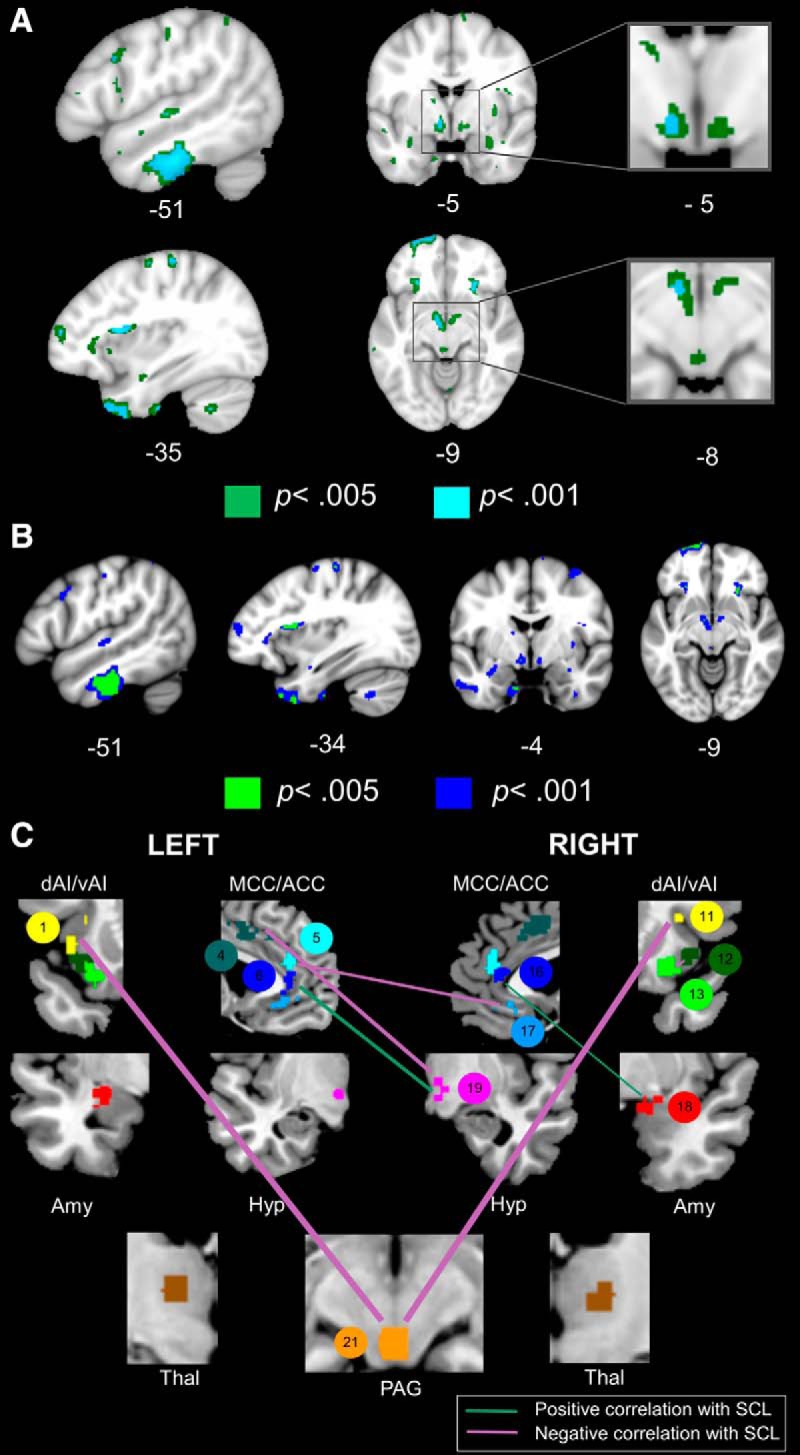
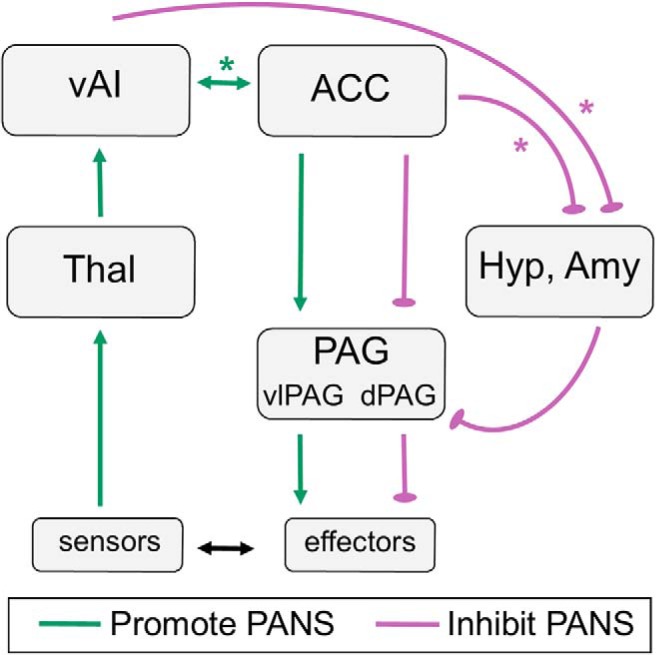
Anatomical framework of autonomic functioning and relevant ROIs. A, Building on previous studies, we developed a lateralized schematic of PANS and SANS functioning. The salience network is anchored by hubs in anterior insula (AI) and ACC and has tight connections with central pattern generators, including the amygdala, hypothalamus, and PAG. Although this framework does not include many brainstem regions that are also integral for ANS activity (e.g., nucleus of the solitary tract, parabrachial nucleus, nucleus ambiguus, dorsal motor nucleus of the vagus, and rostral ventrolateral medulla, among others), it does include critical cortical and subcortical regions that can be measured with neuroimaging techniques. Thus, this represents a simplified yet testable conceptualization of the neural system that supports resting physiological activity as well as phasic emotional reactions. B, We extracted the BOLD time series from 21 ROIs that pertained to our neuroanatomical model of ANS functioning. Connectivity strength between each node-pair (or edge) was calculated by correlating the BOLD time series of each ROI with the BOLD time series of every other ROI, which provided us with a matrix of 210 edges to correlate with measures of baseline RSA and SCL. The ROIs were functionally connected to the insula and were obtained from task-free fMRI data in an independent cohort of healthy older controls. These ROIs (with the numerical labels that we assigned to them denoted in parentheses) included the following: left dorsal AI (1), right dorsal AI (11), left ventral AI node 1 (2), right ventral AI node 1 (12), left ventral AI node 2 (3), right ventral AI node 2 (13), left anterior midcingulate cortex (4), right anterior midcingulate cortex (14), left pregenual ACC node 1 (5), right pregenual ACC node 1 (15), left pregenual ACC node 2 (6), right pregenual ACC node 2 (16), left subgenual ACC (7), right subgenual ACC (17), left amygdala (8), right amygdala (18), left hypothalamus (9), right hypothalamus (19), left thalamus (10), right thalamus (20), and PAG (21). Amy, Amygdala; Hyp, hypothalamus; Thal, thalamus.
Materials and Methods
Participants
We included 47 participants in the present study: 24 HCs (56.7–79.6 years of age) and 23 patients with bvFTD (34.2–71.2 years of age) (Rascovsky et al., 2007). The HCs were recruited from advertisements and were free of current or previous neurological or psychiatric disorders. Patients underwent an interdisciplinary team evaluation at the University of California–San Francisco, Memory and Aging Center that included a clinical interview, neurological examination, functional assessment, MRI, and neuropsychological testing (Table 1). A functional assessment of dementia severity was obtained using the Clinical Dementia Rating Scale (Morris, 1993). Body mass index was calculated for all patients and for 20 of 21 HCs with available height and weight data. Participants were not taking medications at the time of the laboratory assessment (described below) that could significantly affect ANS functioning (i.e., stimulants, β-blockers, or acetylcholinesterase inhibitors). Power calculations based on previous studies of ANS dysfunction in bvFTD (Joshi et al., 2014a; Guo et al., 2016) showed that an α = 0.05 level test in a sample of this size had power >80% to detect a difference between the groups.
Table 1.
Participant characteristics classified by diagnostic groupa
| bvFTD | HCs | p | ηp2 | |
|---|---|---|---|---|
| N | 23 | 24 | ||
| Age (yr) | 58.4 (8.4) | 67.9 (5.4) | <0.001 | 0.31 |
| Sex: % female | 30.4 | 54.2 | 0.10 | |
| Education | 15.7 (2.9) | 17.6 (2.3) | 0.02 | 0.12 |
| Handedness: % right-handed | 100.0 | 91.7 | 0.16 | |
| BMI | 32.2 (29.1) | 25.8 (12.3) | 0.37 | 0.02 |
| CDR total | 1.2 (0.6) | 0.0 (0.0) | <0.001 | 0.72 |
| CDR-SB | 7.2 (2.8) | 0.0 (0.0) | <0.001 | 0.77 |
| MMSE | 23.9 (5.2) | 29.6 (0.6) | <0.001 | 0.38 |
| California Verbal Learning Test- Short Form 10-Minute Recall (/9)b | 3.8 (2.3) | — | — | — |
| Benson Figure Copy 10-Minute Recall (/17) | 6.8 (4.4) | 11.4 (2.6) | 0.001 | 0.29 |
| Modified Trails (correct lines per minute) | 13.9 (13.0) | 39.6 (12.1) | <0.001 | 0.53 |
| Modified Trails Errors | 2.4 (2.4) | 0.2 (0.4) | 0.001 | 0.31 |
| Phonemic Fluency (no. correct in 60 s) | 5.5 (3.8) | 19.2 (4.3) | <0.001 | 0.76 |
| Semantic Fluency (no. correct in 60 s) | 9.1 (4.7) | 24.0 (5.3) | <0.001 | 0.70 |
| Design Fluency Correct (no. correct in 60 s) | 4.8 (3.3) | 11.8 (2.8) | <0.001 | 0.58 |
| Design Fluency Repetitions | 7.3 (6.3) | 1.8 (2.4) | 0.001 | 0.26 |
| Digits Backward | 3.2 (0.9) | 6.0 (1.4) | <0.001 | 0.61 |
| Benson Figure Copy (/17) | 13.8 (2.1) | 15.3 (1.0) | 0.015 | 0.16 |
| Calculations (/5) | 3.3 (1.1) | 4.9 (0.2) | <0.001 | 0.54 |
| Boston Naming Test Spontaneous Correct (/15) | 11.8 (3.1) | 14.6 (0.7) | <0.001 | 0.30 |
| Peabody Picture Vocabulary Test (/16) | 13.7 (3.3) | 15.7 (0.6) | 0.025 | 0.15 |
aData are mean (SD), unless otherwise noted. Neuropsychological testing included assessment of verbal and visual episodic memory, executive function (e.g., set-shifting, working memory, and fluency), language, and visuospatial functioning. A total of 19 of 23 patients and 17 of 24 HCs completed neuropsychological testing in close proximity (within 4 months for patients and 12 months for the HC) to the laboratory assessment. The CDR Total and Sum of the Boxes were computed for each participant, with higher scores indicating greater impairment. BMI, Body mass index; CDR Total, Clinical Dementia Rating Total score; CDR-SB, Clinical Dementia Rating Sum of Boxes; MMSE, Mini-Mental State Examination.
bHCs received the California Verbal Learning Test-II (16 word list) instead of the Short Form. Their performance on the 20 min delay was also in the average range (13.6 ± 2.1). We used ANOVA and χ2 tests, when appropriate, to examine group differences. Partial eta squared (ηp2) is provided as a measure of effect size.
Experimental design and statistical analysis
Laboratory assessment of autonomic physiology
Procedure.
After informed consent, participants' physiological functioning was assessed at the Berkeley Psychophysiology Laboratory at the University of California–Berkeley (Levenson et al., 2008).
Resting baseline autonomic physiology.
Eleven 35 s resting baseline periods were extracted from a task in which participants viewed 11 short films (for complete details, see previous task descriptions) (Goodkind et al., 2015). During these prefilm baseline periods, participants were instructed to relax and to watch an “X” on a white monitor screen.
Measures.
Physiological measures were monitored continuously using a Grass Model 7 or Biopac polygraph, a computer with analog-to-digital capability, and an online data acquisition and analysis software package written by Robert W. Levenson. The software computed second-by-second averages for the following measures: (1) heart rate (Beckman miniature electrodes with Redux paste were placed in a bipolar configuration on opposite sides of the participant's chest; the interbeat interval was calculated as the interval, in milliseconds, between successive R waves); (2) respiratory sinus arrhythmia (RSA), the peak-valley method was used, which measures the time differences between the shortest interbeat interval during inspiration and the longest interbeat interval during expiration on each breath (Grossman et al., 1990); (3) skin conductance level (SCL), a constant-voltage device was used to pass a small voltage between Beckman regular electrodes (using an electrolyte of sodium chloride in Unibase) attached to the palmar surface of the middle phalanges of the ring and index fingers of the nondominant hand; (4) respiration period (a pneumatic bellows was stretched around the thoracic region, and the intercycle interval was measured in milliseconds between successive inspirations); and (5) finger temperature (a thermistor attached to the distal phalanx of the little finger of the nondominant hand recorded temperature in degrees Fahrenheit).
This array of measures was selected to sample from major ANS (cardiovascular, electrodermal, and respiratory) systems and enabled us to examine both PANS and SANS integrity. RSA is a measure of vagally mediated, beat-to-beat variation in heart rate, an index of PANS activity (Berntson et al., 1997). RSA is closely linked to respiration, with heart rate decelerating during expiration and accelerating during inspiration. We used the peak-valley method, which quantifies the difference between the longest heart period during expiration and the shortest heart period during inspiration (Grossman et al., 1990; Grossman and Taylor, 2007). The natural logarithm of RSA was used to improve proximity to a normal distribution and was used in all analyses. SCL, which increases as there is greater innervation of the eccrine sweat glands, is a relatively pure SANS measure (Critchley, 2002). Heart rate, respiration period, and temperature are influenced by both ANS branches and, therefore, were not the focus of our neuroimaging analyses.
Mean levels of physiological responding were computed for each 33 s prefilm baseline (1 s at the beginning and end of each baseline and trial was omitted to account for measurement error in the timing of trial onset and offset) and were then averaged across all 11 baseline trials. We calculated a Cronbach's α reliability coefficient for each channel and found high reliability for each measure across the 11 baseline periods (interbeat interval = 0.99, RSA = 0.94, SCL = 0.99, respiration period = 0.92, and temperature = 0.99), which suggests that the overall baseline means were an accurate reflection of stable, trait-like baseline ANS physiology.
Image acquisition
Structural imaging.
The majority of participants (17 HCs and 22 patients) underwent research-quality MRI within close proximity of the laboratory assessment of autonomic physiology (4 months for patients and 12 months for HCs). Structural images were obtained on a 3.0 tesla TIM Trio scanner (Siemens) equipped with a 12-channel head coil located at the University of California–San Francisco, Neuroscience Imaging Center. Whole-brain images were acquired using volumetric MPRAGE (acquisition time = 8:53, sagittal orientation, FOV of 160 × 240 × 256 mm with an isotropic voxel resolution of 1 mm3, TR = 2300 ms, TE = 2.98 ms, TI = 900 ms, flip angle = 9°).
Functional imaging.
Task-free fMRI scans were also obtained in 14 HCs and 17 patients with bvFTD. The 3T scanner acquired 240 task-free T2*-weighted echoplanar fMRI volumes (acquisition time = 8:06, axial orientation with interleaved ordering, FOV = 230 × 230 × 129 mm, matrix size = 92 × 92, effective voxel resolution = 2.5 × 2.5 × 3.0 mm, TR = 2000 ms, TE = 27 ms).
Image preprocessing
Structural imaging.
Structural T1 images were visually inspected for movement artifacts before being processed with SPM12 (http://www.fil.ion.ucl.ac.uk/spm/software/spm12/). One patient was excluded because of poor scan quality, leaving a total of 21 bvFTD and 17 HCs. Within the same generative model (Ashburner and Friston, 2005), the T1-weighted images were segmented into gray matter and white matter (WM) using the segment program in SPM12. To guarantee voxelwise comparability, gray matter images were normalized to MNI space by applying 12-parameter linear transformation and nonlinear warping, modulated, and smoothed with an 8 mm FWHM Gaussian kernel.
Functional imaging.
For each fMRI scan, the first five volumes were discarded. SPM12 and FSL (http://fsl.fmrib.ox.ac.uk/fsl) software was used for subsequent fMRI preprocessing. The remaining 235 volumes were slice-time corrected, realigned to the mean functional image, and assessed for rotational and translational head motion. Volumes were next coregistered to the MPRAGE image and then normalized to the standard MNI-152 healthy adult brain template using SPM segment, producing MNI-registered volumes with 2 mm3 isotropic resolution. These volumes were spatially smoothed with a 6 mm radius Gaussian kernel and temporally bandpass filtered in the 0.008–0.15 Hz frequency range using fslmaths. Nuisance parameters in the preprocessed data were estimated for the CSF using a mask in the central portion of the lateral ventricles and for the WM using a mask of the highest probability cortical WM as labeled in the FSL tissue prior mask. Additional nuisance parameters included the 3 translational and 3 rotational motion parameters, the temporal derivatives of the previous 8 terms (WM/CSF/6 motion), and the squares of the previous 16 terms (Satterthwaite et al., 2013). Any participant with a maximum relative head translation >3 mm, maximum relative rotation >3 degrees, or >10% of frames with a motion spike >1 mm was excluded from the analysis. Previous work has shown that the edges tested in the present study have moderate to good test-retest reliability with this level of head movement excluded (Guo et al., 2012) and that resting state measures are reliable when these preprocessing strategies are used (Varikuti et al., 2017). We excluded two patients for excessive motion, leaving 14 HCs and 15 patients with bvFTD. The groups (controlling for age, sex, and education) did not significantly differ on total head movement during the scan, F(1,24) = 1.43, p = 0.24, ηp2 = 0.06.
Analyses
Structural neuroimaging analyses.
We conducted separate whole-brain voxel-based morphometry (VBM) analyses (Bates et al., 2003) in the patients to identify brain regions in which smaller gray matter volume was associated with baseline RSA and SCL deficits in bvFTD (Table 2). We chose to run the structural neuroimaging analyses in the patients only because they have significantly more atrophy than the controls in many of the regions that we expected would be related to the ANS measures and, thus, might unduly bias the analyses if we combined all of the participants. Age, sex, and education were included as nuisance covariates. In a follow-up analysis, we added SCL as an additional covariate in the RSA analysis and RSA as an additional covariate in the SCL analysis, which further allowed us to examine the independence of the neural correlates of each measure. A priori significance was established at uncorrected p < 0.001. A total of 1000 permutation analyses using combined peak and extent thresholds were run to derive a study-specific error distribution to determine the one-tailed T-threshold at pFWE < 0.05, corrected for multiple comparisons (Nichols and Holmes, 2002).
Table 2.
Resting baseline physiological levelsa
| bvFTD | HCs | F | p | ηp2 | |
|---|---|---|---|---|---|
| Interbeat interval (ms) | 906.6 (156.74) | 981.9 (133.9) | 0.3 | 0.57 | 0.01 |
| Respiratory sinus arrhythmia (ms)* | 39.1 (22.9) | 62.9 (55.3) | 10.0 | 0.003 | 0.20 |
| SCL (μmhos)* | 2.0 (0.9) | 2.9 (1.7) | 4.6 | 0.037 | 0.10 |
| Respiration period (ms)* | 4035.6 (915.5) | 4750.3 (946.6) | 9.4 | 0.004 | 0.19 |
| Finger temperature (°F) | 80.7 (5.5) | 80.5 (5.6) | 0.0 | 0.97 | 0.00 |
aData are mean (SD), unless otherwise noted. Analyses of covariance (controlling for age, sex, and education) found that patients with bvFTD (n = 22) had significantly lower respiratory sinus arrhythmia, lower SCL, and shorter respiration period than the HCs (n = 22). When we added additional covariates that might influence RSA (i.e., resting interbeat interval, resting respiration period, and body mass index) to the model (while also controlling for education, sex, and age), patients continued to have lower RSA (F(1,33) = 469, p = 0.038, ηp2 = 0.13). For SCL, although including resting interbeat interval, resting respiration period, and body mass index as additional covariates caused the difference to fall to trend levels, the pattern of results was in the expected direction, with patients having lower SCL than controls (F(1,32) = 2.82, p < 0.11, ηp2 = 0.08). To examine whether the results of the original model (controlling for age, sex, and education) held in a smaller, age-matched sample, we removed patients under age 58 (n = 6) and HCs over age 70 (n = 8). In this subset of participants (17 bvFTD and 15 HCs), the patients and controls did not differ in age (F(1,31) = 3.2, p = 0.09, ηp2 = 0.09). In this smaller sample, the group differences in baseline autonomic activity remained significant. Compared with HCs, patients with bvFTD had lower RSA (F(1,27) = 5.6, p = 0.03, ηp2 = 0.17), lower SCL (F(1,27) = 4.2, p = 0.05, ηp2 = 0.14), and shorter respiration period (F(1,27) = 8.1, p = 0.008, ηp2 = 0.23). Partial eta squared (ηp2) is provided as a measure of effect size.
*p < 0.05, significant difference in the first model described above.
Functional connectivity neuroimaging analyses.
Using a graph theoretical framework, we identified “connectivity clusters” that corresponded to the ROIs in our model (Fig. 1B). The clusters were obtained from task-free fMRI data in an independent cohort of 40 healthy older controls (20 males, all <66 years old) as previously described (Guo et al., 2012). In brief, we used four vAI and dorsal anterior insula (dAI) seeds, drawn from a meta-analysis of task-based fMRI studies that activated the insula (Kurth et al., 2010) to derive four connectivity maps. These four maps were entered into a full-factorial analysis, which identified brain regions with connectivity to the dAI clusters, to the vAI clusters, or to both the dAI and vAI clusters. We extracted the BOLD time series from 21 clusters that corresponded to the ROIs in our a priori theoretical model (Fig. 1A) and created a matrix that consisted of the connectivity strength of the edges in that model. Because the clusters are data-driven and have connectivity-based contours, they may sample a more homogeneous functional signal and be better suited for matrix-based analyses than typical spherical or landmark-based ROIs (Shirer et al., 2012).
We used previously established methods (Sturm et al., 2013) to identify key edges associated with RSA and SCL. First, edge weights were r-to-z transformed, and we then ran correlation analyses across the patients and controls between RSA and the connectivity strength of all 210 edges in our matrix. We planned to include any regions for which the correlation coefficient was ≥0.20, a small to medium effect size (Cohen, 1992), and a permissive inclusion threshold as additional candidate predictor variables in subsequent regression analyses. Next, we ran hierarchical regression analyses to determine which edges were significant predictors of RSA, a conservative test of our hypotheses because edges must emerge as significant predictors from a group of candidate predictor regions. In Step 1, we entered age, sex, education, and diagnosis into the model. In Step 2, we used a “forward” entry model to determine which edges accounted for a significant amount of variance above and beyond the control variables; thus, edges that did not account for significant variance were excluded from the model. In this second step, we included as predictor candidates all of the edges that passed the 0.2 inclusion threshold from our correlation analyses. We ran three separate regression analyses for ipsilateral left-hemisphere edges, ipsilateral right-hemisphere edges, and edges that crossed to the contralateral hemisphere (i.e., left to right or right to left) to minimize potential collinearity between homologous regions. We also examined our models to confirm that there was only weak multicollinearity among variables (variance inflation factor < 4). We next repeated this entire process to identify edges that were significant predictors of baseline SCL. For each regression, we visually inspected the histogram and P-P plot of the standardized residuals to ensure that the error terms were normally distributed. The plots showed that the points generally followed the normal (diagonal) line with no outliers or strong deviations, indicating that the assumptions of the regression models were met.
To ensure that any associations between functional connectivity and ANS physiology were not due to atrophy, we conducted another set of hierarchical regression analyses for RSA and SCL. From the structural scans, we extracted the total gray matter volume from each ROI. Here, in addition to the other nuisance covariates (age, sex, education, and diagnosis), we also included the mean ROI volumes for each of the edges (i.e., the mean volume of each node that comprised the relevant edges) that had entered the original forward-entry regression models in Step 1. In Step 2, we included the connectivity strength of the edges that had entered the models in our original analyses.
We anticipated that any associations that we detected between ANS activity and functional connectivity would reflect a general relationship that is not specific to either diagnosis. To confirm that this was the case, we repeated the final regression models (for ipsilateral left-hemisphere edges, ipsilateral right-hemisphere edges, and edges that crossed to the contralateral hemisphere) for RSA and SCL in each diagnosis separately. Here, we included age, sex, and education as nuisance covariates in Step 1. In Step 2, we entered the edges that had explained a significant portion of the variance in the forward-entry regression models we had conducted across the sample. Although each diagnostic group was much smaller than the total sample and, thus, our power was substantially reduced in these analyses, our aim was to investigate whether the effect sizes of any the associations between functional connectivity and ANS activity that we detected across the sample were comparable in each of the diagnostic groups when examined separately.
Finally, in an additional set of regressions, we examined whether the mean connectivity strength of the edges that entered the regression RSA and SCL models were lower in bvFTD compared with HCs. In these analyses, the independent variable was diagnosis (bvFTD or HC), and the covariates included age, sex, and years of education.
Results
Smaller left vAI volume and lower vAI-ACC connectivity are associated with lower baseline PANS activity
In bvFTD, lower RSA was related to atrophy in a large cluster within left vAI, among other regions (Table 3; Fig. 2A). When we also controlled for SCL in this RSA analysis, the results remained largely unchanged, although some regions that were more weakly associated with RSA no longer remained significant (Table 3; Fig. 2B). Forward-entry hierarchical regression analyses across the bvFTD and HC groups determined that weaker functional connectivity in bilateral vAI-ACC edges, including left vAI-left ACC (2–5), left vAI-right ACC (2–16), and right vAI-right ACC (13–15), was associated with lower baseline RSA (Table 4; Fig. 2C). The functional connectivity results remained significant after atrophy correction. When we repeated the original regression analyses in each diagnosis separately, there were similar associations between RSA and the functional connectivity measures (Fig. 4-1). Patients with bvFTD had significantly lower connectivity strength than the HCs in the right vAI-right ACC (13–15) and left ACC-right amygdala (6–18) edges (Table 5). These findings indicate that structural and functional deterioration of vAI (left > right) and its connections with ACC are associated with a loss of basal parasympathetic tone, as measured by RSA.
Table 3.
Anatomical correlates of baseline PANS and SANS activitya
| Anatomical region | Cluster volume (mm3) | x | y | z | Maximum T score | β |
|---|---|---|---|---|---|---|
| RSA | ||||||
| Left ventral anterior insulab | 1312 | −41 | 12 | −15 | 5.41 | 0.79 |
| Left inferior temporal lobeb | 448 | −32 | 2 | −36 | 4.96 | 0.59 |
| Right parahippocampal gyrus | 320 | 15 | 11 | −30 | 4.50 | 0.63 |
| Left parahippocampal gyrusb | 168 | −14 | 8 | −26 | 4.28 | 0.68 |
| SCL | ||||||
| Left inferior temporal gyrusb,c | 6120 | −51 | −21 | −27 | 6.57 | 0.77 |
| Left temporal poleb | 1528 | −33 | 9 | −50 | 5.02 | 0.72 |
| Right fusiform gyrusb | 1200 | 27 | −15 | −41 | 5.05 | 0.69 |
| Left precentral gyrus | 1160 | −41 | −18 | 59 | 4.31 | 0.75 |
| Left dorsal mid-insulab | 1088 | −36 | 14 | 15 | 7.08 | 0.61 |
| Left orbitofrontal cortexb | 1080 | −21 | 18 | −16 | 4.71 | 0.65 |
| Left orbitofrontal cortexb | 1080 | −18 | 47 | −21 | 5.34 | 0.67 |
| Right orbitofrontal cortexb | 912 | 26 | 21 | −11 | 5.16 | 0.54 |
| Right frontal poleb | 880 | 8 | 71 | 14 | 5.77 | 0.81 |
| Right frontal pole | 776 | −15 | 69 | −11 | 5.38 | 0.67 |
| Left parahippocampal gyrusb | 712 | −11 | −8 | −35 | 5.60 | 0.79 |
| Right middle frontal gyrusb | 672 | 50 | 14 | 51 | 6.20 | 0.89 |
| Left superior frontal gyrus | 600 | −17 | 41 | 51 | 4.65 | 0.81 |
| Right postcentral gyrus | 584 | 23 | −30 | 74 | 4.25 | 0.76 |
| Right precentral gyrusb | 496 | 44 | −20 | 60 | 4.30 | 0.69 |
| Left precuneus | 424 | −17 | −41 | 71 | 4.94 | 0.70 |
| Left frontal poleb | 424 | −38 | 56 | 9 | 4.30 | 0.66 |
| Left hypothalamus | 424 | −8 | −5 | −9 | 4.14 | 0.60 |
| Left fusiform gyrus | 416 | −33 | −17 | −44 | 4.17 | 0.73 |
| Right gyrus rectus | 352 | 9 | 33 | −17 | 4.16 | 0.54 |
| Right precentral gyrus | 320 | 35 | −8 | 62 | 4.75 | 0.80 |
| Left fusiform gyrus | 304 | 51 | −11 | −29 | 4.33 | 0.60 |
| Left inferior parietal lobe | 280 | −47 | −50 | 54 | 4.29 | 0.73 |
| Right superior frontal gyrusb | 280 | 23 | 57 | 36 | 5.16 | 0.67 |
| Left precentral gyrusb | 264 | −32 | −9 | 63 | 4.33 | 0.77 |
| Right cerebellumb | 232 | 35 | −50 | −45 | 4.02 | 0.50 |
| Left pars triangularis | 200 | −33 | 33 | 3 | 4.09 | 0.75 |
| Right inferior parietal lobe | 192 | 48 | −42 | 59 | 4.38 | 0.66 |
| Left supplementary motor area | 160 | −9 | 8 | 65 | 4.61 | 0.63 |
aWhole-brain VBM analyses in patients with bvFTD (controlling for age, sex, and education) revealed that atrophy in many ANS network nodes was associated with lower baseline RSA (n = 21) and SCL (n = 20). MNI coordinates (x, y, z) given for maximum T score for the cluster (cluster size >150 mm3). Results are significant at p < 0.001, uncorrected. To identify the independent neural correlates of PANS and SANS activity, we conducted follow-up VBM analyses when controlling for the opposing autonomic measure (i.e., including SCL as an additional covariate in the RSA VBM analysis and SCL as an additional covariate in the RSA VBM analysis).
bSignificance at p < 0.001, uncorrected, when also controlling for the opposing autonomic measure.
cSignificance at pFWE < 0.05.
Figure 2.

Baseline PANS activity is determined by the strength of certain salience network connections and the suppression of others. A, Atrophy in left vAI was associated with lower RSA at p < 0.001, uncorrected (controlling for age, sex, and education) in 21 patients with bvFTD. Cyan represents T scores at p < 0.001, uncorrected (T > 3.69). Green represents T scores at p < 0.005, uncorrected (T > 2.92). B, We conducted a follow-up VBM analysis of RSA in which we added SCL as an additional covariate to the model. The results remained largely unchanged, although some weaker clusters no longer remained significant. Cyan represents T scores at p < 0.001, uncorrected (T > 3.79). Green represents T scores at p < 0.005, uncorrected (T > 2.98). C, The fMRI analyses revealed that lower baseline PANS activity was associated with lower vFI-ACC connectivity and higher connectivity primarily in ACC-hypothalamus/amygdala. Line thickness is scaled to reflect the percentage of variance that each edge explained (i.e., R2 change, which ranged from 0.06 to 0.30) in the hierarchical regression model. Statistical maps are superimposed on the MNI template brain.
Table 4.
Node-pair connections (i.e. edges) that explained a significant portion of variance in RSA and SCL in the regression analysesa
| Edge category | Edge label | Zero-order correlation | β | R2 change | p value of F change | |
|---|---|---|---|---|---|---|
| RSA | ||||||
| Positive correlation | Left vAI-left ACC | 2–5 | 0.41 | 0.48 | 0.22 | 0.002 |
| Left vAI-right ACCb | 2–16 | 0.33 | 0.51 | 0.14 | 0.01 | |
| Right vAI-right ACC | 13–15 | 0.29 | 0.83 | 0.12 | 0.03 | |
| Negative correlation | Left ACC-left hypothalamus | 7–9 | −0.57 | −0.56 | 0.20 | 0.01 |
| Left ACC-right hypothalamus | 7–19 | −0.57 | −0.52 | 0.30 | 0.001 | |
| Right ACC-right hypothalamusb | 16–19 | −0.33 | −0.37 | 0.12 | 0.01 | |
| Right vAI1-right vAI2 | 12–13 | −0.32 | −0.61 | 0.09 | 0.04 | |
| Right ACC-right hypothalamusc | 17–19 | −0.30 | −0.43 | 0.06 | 0.04 | |
| Right vAI-right hypothalamusb,c | 13–19 | −0.26 | 0.11 | 0.21 | 0.01 | |
| Right vAI-right ACCb | 12–17 | −0.25 | −0.32 | 0.06 | 0.01 | |
| Left ACC-right amygdalab | 6–18 | −0.22 | −0.42 | 0.09 | 0.02 | |
| SCL | ||||||
| Positive correlation | Left ACC-right hypothalamus | 6–19 | 0.31 | 0.65 | 0.14 | 0.02 |
| Right ACC-right amygdala | 16–18 | 0.23 | 0.38 | 0.08 | 0.04 | |
| Negative correlation | Left dAI-PAG | 1–21 | −0.37 | −0.54 | 0.25 | 0.003 |
| Right vAI1-right vAI2 | 12–13 | −0.31 | −0.39 | 0.10 | 0.03 | |
| Right ACC-left ACC | 17–5 | −0.30 | −0.40 | 0.12 | 0.01 | |
| Right dAI-PAG | 11–21 | −0.28 | −0.71 | 0.25 | 0.003 | |
| Left aMCC-right hypothalamus | 4–19 | −0.20 | −0.59 | 0.16 | 0.02 |
aForward-entry hierarchical regression analyses in 15 patients with bvFTD and 13 HCs (controlling for age, sex, education, and diagnosis) were used to determine which edges were significant predictors of baseline PANS and SANS. Edges with positive and negative associations with RSA and SCL entered the models, suggesting that a combination of strong and weak functional connectivity in the ANS network is necessary for resting physiological activity.
bEdge that lost significance when controlling for mean resting respiration period and interbeat interval.
cEdges that lost significance when controlling for the mean gray matter volume of the nodes in that edge.
Table 5.
Edge weight connectivity strength in bvFTD versus HCsa
| Edge category | Edge label | bvFTD, mean (SD) | HCs, mean (SD) | T | p | |
|---|---|---|---|---|---|---|
| RSA | ||||||
| Positive correlation | Left vAI-left ACC | 2–5 | 0.40 (0.28) | 0.46 (0.31) | −1.17 | 0.25 |
| Left vAI-right ACC | 2–16 | 0.41 (0.29) | 0.49 (0.24) | −0.77 | 0.45 | |
| Right vAI-right ACC | 13–15 | 0.44 (0.29) | 0.51 (0.28) | −2.42 | 0.02 | |
| Negative correlation | Left ACC-left hypothalamus | 7–9 | 0.17 (0.31) | 0.14 (0.25) | −0.01 | 0.99 |
| Left ACC-right hypothalamus | 7–19 | 0.14 (0.25) | 0.20 (0.17) | 0.08 | 0.94 | |
| Right ACC-right hypothalamus | 16–19 | 0.13 (0.24) | 0.32 (0.19) | 1.43 | 0.17 | |
| Right vAI1-right vAI2 | 12–13 | 0.66 (0.26) | 0.66 (0.25) | −0.17 | 0.87 | |
| Right ACC-right hypothalamus | 17–19 | 0.12 (0.26) | 0.28 (0.18) | 0.22 | 0.83 | |
| Right vAI-right hypothalamus | 13–19 | 0.20 (0.24) | 0.35 (0.21) | 0.30 | 0.77 | |
| Right vAI-right ACC | 12–17 | 0.31 (0.28) | 0.33 (0.22) | −0.73 | 0.47 | |
| Left ACC-right amygdala | 6–18 | 0.20 (0.24) | 0.41 (0.34) | −2.28 | 0.03 | |
| SCL | ||||||
| Positive correlation | Left ACC-right hypothalamus | 6–19 | 0.11 (0.23) | 0.37 (0.17) | −2.04 | 0.05 |
| Right ACC-right amygdala | 16–18 | 0.18 (0.18) | 0.39 (0.33) | −2.14 | 0.04 | |
| Negative correlation | Left dAI-PAG | 1–21 | 0.06 (0.27) | 0.12 (0.32) | −1.04 | 0.31 |
| Right vAI1-right vAI2 | 12–13 | 0.66 (0.26) | 0.66 (0.25) | −0.17 | 0.86 | |
| Right ACC-left ACC | 17–5 | 0.47 (0.19) | 0.52 (0.25) | −2.21 | 0.04 | |
| Right dAI-PAG | 11–21 | −0.05 (0.22) | 0.15 (0.24) | −2.31 | 0.03 | |
| Left aMCC-right hypothalamus | 4–19 | 0.14 (0.25) | 0.36 (0.22) | −2.24 | 0.04 |
aMean connectivity strengths of the edges that entered the RSA and SCL regression models for bvFTD (n = 15) and HC (n = 14) groups.
Stronger connectivity in ACC-hypothalamus/amygdala edges relates to lower baseline PANS activity
Although lower RSA was associated with weaker vAI-ACC connectivity, the regression analyses also revealed that lower RSA was associated with stronger connectivity in other edges. Most notably, stronger connections between bilateral ACC and predominantly right-sided hypothalamus/amygdala edges were associated with lower RSA (Table 4; Fig. 2C). This pattern was not mirrored in the VBM analyses in that there were no regions where larger volume was associated with lower RSA. All of the functional connectivity results held with atrophy correction, with the exception of the right pregenual ACC-right hypothalamus (p = 0.07) and right vAI-right hypothalamus (p = 0.30) edges. These results suggest that RSA depends on both functional integrity of vAI-ACC edges and suppressed connectivity in ACC-hypothalamus and ACC-amygdala edges (particularly in the right hemisphere), regions that appear to inhibit PANS activity, perhaps by promoting SANS outflow.
Stronger connectivity in ACC-hypothalamus/amygdala edges relates to higher SANS activity
If the hypothalamus and amygdala promote SANS activity, as suggested by the RSA analyses, then we would expect that preserved volume and connectivity in these regions would be associated with higher SCL. Consistent with this framework, a larger volume in left inferior temporal gyrus and left hypothalamus as well as right hypothalamus, amygdala, and PAG (at a more permissive threshold of p < 0.005) was associated with higher SCL (Table 3; Fig. 3A). Furthermore, when we also controlled for RSA in this SCL analysis, the results remained largely unchanged though some regions that were more weakly associated with SCL no longer remained significant (Table 3; Fig. 3B). Stronger bilateral ACC-hypothalamus connectivity was also associated with higher baseline SCL (Table 4; Fig. 3C). Although there were no regions for which larger volume was associated with lower SCL, stronger connectivity in bilateral dAI-PAG and left anterior midcingulate cortex (aMCC)-right hypothalamus edges did relate to lower SCL (Table 4; Fig. 3C). All functional connectivity results held with atrophy correction. When we repeated the original regression analyses in each diagnosis separately, there were similar associations between SCL and the functional connectivity measures (Fig. 4-1). Together, these findings suggest that the right hypothalamus in particular is a key hub in SANS outflow and that atrophy and diminished connectivity in right hypothalamus/amygdala edges impede SCL. Patients with bvFTD had significantly lower connectivity strength than the HCs in the left ACC-right hypothalamus (6–19), right ACC-right amygdala (16–18), right ACC-left ACC (17–5), right dAI-PAG (11–21), and left aMCC-right hypothalamus (4–19) edges (Table 5). Visual inspection of the data confirmed that significant associations that emerged between the functional connectivity measures and ANS activity were not driven by group effects (Fig. 4).
Figure 3.
Baseline SANS activity is determined by the strength of certain salience network connections and the suppression of others. A, Atrophy in inferior temporal gyrus, dorsal mid-insula, and hypothalamus was associated with lower SCL at p < 0.001, uncorrected (controlling for age, sex, and education) in 20 patients with bvFTD. At more permissive thresholds (p < 0.005, uncorrected), smaller volume in the amygdala and PAG was also associated with lower SCL. The inferior temporal gyrus was the only cluster that survived permutation analysis, pFWE < 0.05. Cyan represents T scores at p < 0.001, uncorrected (T > 3.73). Green represents T scores at p < 0.005, uncorrected (T > 2.95). B, We conducted a follow-up VBM analysis of SCL in which we added RSA as an additional covariate to the model. The results remained largely unchanged, although some weaker clusters no longer remained significant. Blue represents T scores at p < 0.001, uncorrected (T > 3.79). Green represents T scores at p < 0.005, uncorrected (T > 2.98). C, Baseline SANS deficits were associated with lower connectivity in right amygdala/hypothalamus edges and higher connectivity primarily in bilateral dAI-PAG edges. Line thickness is scaled to reflect the percentage of variance that each edge explained (i.e., R2 change, which ranged from 0.08 to 25) in the hierarchical regression model. Statistical maps are superimposed on the MNI template brain.
Figure 4.

Regression plots for the functional imaging analyses. Partial residual plots for the four edges that explained the greatest percentage of variance (R2 change) in RSA and SCL (controlling for age, sex, education, and diagnosis). Higher resting RSA was associated with (A) greater left vAI-left ACC (edge 2–5) and (B) lower left ACC-right hypothalamus (edge 7–19) functional connectivity. Higher SCL was associated with (C) greater left ACC-right hypothalamus (edge 6–19) and (D) lower right dAI-PAG (edge 11–21) functional connectivity. Given that we controlled for diagnosis in the regression models, these plots show that the association that we detected between edge connectivity and resting autonomic activity was present in both diagnostic groups and, thus, was not driven by group membership. When we repeated the original analyses in each diagnosis separately, RSA and SCL had similar associations with the functional connectivity measures (Figure 4-1). For other abbreviations, see Figure 1.
Node-pair connections (i.e. edges) that explained a significant portion of variance in RSA and SCL in each diagnosis separately. To examine whether the associations that we found between the functional connectivity data and ANS physiology across the groups held in each diagnosis, we conducted hierarchical regression analyses for RSA and SCL in each group separately (15 patients with bvFTD and 13 healthy controls). In step one we included age, sex, and education as nuisance covariates, and in step two we entered the edges that had explained a significant portion of the variance in our forward-entry regression models conducted across the sample. Although some edges were no longer significant predictors in these smaller groups, the effect sizes were largely comparable in each diagnosis separately, which suggests that the associations we detected between functional connectivity and ANS physiology are not specific to either group. * This edge was negatively correlated in the models conducted across the groups, but in the diagnostic groups separately it has a very weak positive association with RSA. Download Figure 4-1, DOCX file (14.8KB, docx)
Discussion
The salience network coordinates the parasympathetic and sympathetic branches of the ANS (Benarroch, 1993; Ongür and Price, 2000; Thayer and Lane, 2000; Saper, 2002; Seeley et al., 2007; Beissner et al., 2013; Critchley and Harrison, 2013). This system enables the brain to trigger changes in the periphery and to receive continuous feedback about the physiological conditions of the body (Craig, 2002; Seeley et al., 2012; Critchley and Harrison, 2013). Previous research has revealed cerebral hemispheric asymmetry in PANS and SANS neural systems organization (Oppenheimer et al., 1992; Craig, 2005). Whereas the left hemisphere is essential for PANS functioning (Wittling et al., 1998a; Guo et al., 2016), the right hemisphere plays a dominant role in SANS activation (Yoon et al., 1997; Wittling et al., 1998b). In keeping with this anatomical framework, our results suggest that healthy PANS and SANS activities are the product of complex, opposing intranetwork nodal interactions. We found that the structural and functional integrity of specific hubs, which have been identified in prior studies (left vAI for PANS and right hypothalamus/amygdala for SANS) (Xavier et al., 2013; Guo et al., 2016), was critical for maintaining resting ANS outflow. Although the left vAI and right hypothalamus/amygdala hubs were lateralized and located in the predicted hemispheres, they had connections with ipsilateral and contralateral network nodes that were also integral for baseline ANS activity. While ipsilateral pathways may facilitate within-hemisphere generation of PANS or SANS activity, contralateral projections may foster communication between hemispheres and enable system-level integration of PANS and SANS information. A distributed, bilateral ANS network that is anchored by asymmetric hubs may provide an efficient physiological system in which opposing PANS and SANS influences remain in a dynamic equilibrium at rest but can generate emotional reactions when needed.
RSA depends on strong vAI-ACC integrity and weak ACC-hypothalamus/amygdala connectivity
Our analyses revealed a constellation of nodes and edges that were associated with resting RSA. Consistent with previous findings, vAI and pregenual ACC emerged as key hubs of PANS control (Oppenheimer et al., 1996; Gianaros et al., 2004; Thayer et al., 2012; Allen et al., 2015; Guo et al., 2016; Jennings et al., 2016). Left vAI volume was positively associated with RSA in the structural neuroimaging analyses, and stronger connectivity in left vAI edges was also associated with higher RSA. vAI and pregenual ACC have tight reciprocal connections (Mesulam and Mufson, 1982; Carmichael and Price, 1996) and send projections to ANS brainstem nuclei, including the nucleus ambiguus and dorsal motor nucleus of the vagus (Shipley, 1982; Hurley et al., 1991), a system that may promote the relay of PANS commands from cortical and subcortical hubs to peripheral organs, such as the heart (Gatti et al., 1996).
In addition to edges in which stronger connectivity was associated with higher RSA, patients with weaker ACC-hypothalamus and ACC-amygdala connectivity had higher RSA. Interestingly, stronger connectivity in ACC-hypothalamus and ACC-amygdala edges was also associated with higher SCL, suggesting that the hypothalamus and amygdala (particularly in the right hemisphere) are central pattern generators essential for SANS outflow (Barbas and De Olmos, 1990; Laine et al., 2009; Xavier et al., 2013). Direct connections from ACC to the intermediolateral cell column (Bacon and Smith, 1993), or indirect connections through hypothalamus or amygdala (Saper et al., 1976; ter Horst et al., 1984; Barbas et al., 2003b), may promote SANS outflow. Therefore, higher connectivity between these regions and ACC may impede PANS activity by stimulating SANS outflow, consistent with prior studies showing an antagonistic relation between PANS and SANS activity (Levy, 1990; Saku et al., 2014). Our results suggest that RSA depends not only on strong connectivity in vAI-ACC, which promotes vagal tone, but also on relatively weak, or suppressed, connectivity in ACC-hypothalamus/amygdala, connections that encourage sympathetic responding.
SCL depends on ACC-hypothalamus/amygdala integrity and weak dAI-PAG connectivity
Together with ACC, the amygdala and hypothalamus are integral SANS hubs (Bandler and Carrive, 1988; An et al., 1998; Ongür et al., 1998; Price, 1999; Ongür and Price, 2000). Our results indicate that stronger pregenual ACC-hypothalamus/amygdala connectivity was associated with higher SCL. Larger volume in inferior temporal gyrus, hypothalamus, amygdala, and PAG, among other regions, also predicted greater SCL activity. The integrity of pregenual ACC, and its direct projections with hypothalamus and amygdala, therefore, appears to be essential for SANS outflow (Barbas and De Olmos, 1990; Davis and Whalen, 2001; Ghashghaei and Barbas, 2002; Laine et al., 2009).
Like RSA, SCL depended on stronger connectivity in some edges but weaker connectivity in others. Lower bilateral dAI-PAG and left aMCC-right hypothalamus connectivity were associated with higher SANS tone. Both aMCC and dAI are key structures in an inhibitory control system that constrains cognition and behavior and may also downregulate physiological arousal (Aron et al., 2004; Nee et al., 2007; Touroutoglou et al., 2012; Enriquez-Geppert et al., 2013; Hoffstaedter et al., 2014). Through connections with lateral frontoparietal task control networks (Mesulam and Mufson, 1982; Mufson and Mesulam, 1982), dAI plays a central role in response inhibition and emotion suppression (Aron, 2007; Giuliani et al., 2011). The structural and functional integrity of aMCC has been associated with greater heart rate variability (Critchley et al., 2003; Winkelmann et al., 2017), and connectivity in this region, therefore, may contribute to dampening, rather than inducing, physiological arousal. Although we were unable to examine substructures within our subcortical ROIs, this hypothesis would be especially compelling if the connectivity strength from our PAG and hypothalamus ROIs primarily captured the activity of their PANS-relevant subregions (Bandler and Shipley, 1994; da Silva et al., 2003) (Fig. 5). Weakened connectivity in a PANS-mediated visceromotor braking system, therefore, may facilitate SANS activity. In bvFTD, atrophy and connectivity disruption involving both PANS and SANS structures likely resulted in a net loss of RSA and SCL activity despite altered intranetwork nodal interactions.
Figure 5.
Hypothesized RSA network. Our results suggest that resting PANS tone depends on the integrity of both strong and weak edges in the salience network. Stronger vAI-ACC connectivity and weaker ACC-hypothalamus/amygdala connectivity were associated with higher resting RSA. RSA, therefore, depends on intact connections between vAI (left > right) and ACC and weaker connections between ACC and hypothalamus/amygdala (right > left), suggesting that nodes that support SANS outflow must be inhibited to facilitate PANS activity. We hypothesize that PANS-specific (e.g., ventrolateral PAG) and SANS-specific (e.g., dorsal PAG) subregions in each node as well as untested connections with brainstem nuclei that are difficult to image (e.g., nucleus ambiguus) may also play important roles in this network that we were not able to evaluate. Green lines indicate edges in which stronger connectivity promoted RSA (i.e., edges 2–5, 2–16, and 13–15). Purple lines indicate edges in which stronger connectivity inhibited RSA (i.e., 13–19, 7–9, 16–19, 17–19, and 6–18). *Edges that emerged as significant predictors of RSA in the regression models. Laterality has been omitted for visual simplicity but is alluded to in the figure layout. dPAG, Dorsal PAG; vlPAG, ventrolateral PAG. For other abbreviations, see Figure 1.
Limitations
There are several limitations of the present study that should be considered. First, the HCs were older than the patients with bvFTD. Given that RSA and SCL decline in normal aging (Barontini et al., 1997; Masi et al., 2007), the age distribution of our sample would work against our hypothesis and make it more difficult for us to detect ANS impairment in the younger bvFTD group. Furthermore, we took several additional steps to mitigate the potential impact of age on our results: (1) our primary analyses were regression analyses rather than group comparisons, which allowed us to investigate how brain volume and functional connectivity related to ANS activity across the diagnostic groups; (2) we included age as a covariate in all analyses; and (3) we conducted a follow-up analysis on ANS activity in a subgroup of patients who were age-matched and continued to find PANS and SANS deficits in bvFTD, a pattern that is consistent with previous studies (Joshi et al., 2014a; Guo et al., 2016). We also found that patients had faster baseline respiration rates, an alteration that may also reflect disruption of vagal pathways (Carlson et al., 1992; Critchley, 2002; Rybak et al., 2004). Given that our sample size was relatively small, however, additional studies are needed to detect the more subtle relationships that might exist between functional connectivity and ANS outflow. Larger studies of bvFTD will also be critical for elucidating whether RSA deficits relate to the alterations in respiration that we detected. Second, our study was not able to examine the functional connectivity of many relevant ANS brainstem nuclei, and many of our subcortical ROIs could have been deconstructed further into anatomically meaningful subregions with specific PANS and SANS roles. The hypothalamus and PAG, for example, can be divided into subregions that receive distinct projections from ACC and vAI and play different roles in PANS and SANS (Bandler and Shipley, 1994; Price, 1999). Because of this limitation, we may have failed to detect important associations between these subregions and our ANS measures. Future studies that are able to subdivide these small structures into even finer parcels will continue to elucidate the neural architecture of ANS functioning. Third, whereas our PANS measure, RSA, was a cardiovascular measure, our SANS measure, SCL, was an electrodermal measure. Future studies that use cardiovascular measures of SANS activity, such as impedance cardiography, could help to determine whether all aspects of SANS activity are similarly disrupted in bvFTD or whether the SANS impairment is specific to electrodermal outflow. Given that SCL is a cholinergic, rather than an adrenergic, SANS measure, it is also possible that cholinergic dysfunction in bvFTD may underlie both the RSA and SCL deficits that we detected. Whether the adrenergic system is also altered in bvFTD will need to be addressed in future studies.
In conclusion, although a single distributed salience network supports ANS physiology, opposing PANS and SANS subsystems within this network play distinct roles in homeostasis maintenance. Our results suggest that highly calibrated connections within the PANS and SANS subnetworks promote ANS outflow. Disruption of these subsystems in bvFTD may tip the autonomic balance and alter resting physiology as well as emotional responding. These findings may have wider implications for the study of psychiatric conditions with alterations in emotion and behavior.
Footnotes
This work was supported by National Institutes of Health, National Institute on Aging Grants P50AG023501, P01AG019724, R01AG052496, R01AG032306, R01AG057204, 1K23AG040127, and 1K23AG045289, Larry L. Hillblom Foundation Grants 2013-A-029-SUP and 2005/2T, the John Douglas French Foundation, the Consortium for Frontotemporal Dementia Research, and the Tau Consortium. We thank the patients, healthy controls, and families that have participated in our research studies.
The authors declare no competing financial interests.
References
- Allen B, Jennings JR, Gianaros PJ, Thayer JF, Manuck SB (2015) Resting high-frequency heart rate variability is related to resting brain perfusion. Psychophysiology 52:277–287. 10.1111/psyp.12321 [DOI] [PMC free article] [PubMed] [Google Scholar]
- An X, Bandler R, Ongür D, Price JL (1998) Prefrontal cortical projections to longitudinal columns in the midbrain periaqueductal gray in macaque monkeys. J Comp Neurol 401:455–479. [DOI] [PubMed] [Google Scholar]
- Aron AR. (2007) The neural basis of inhibition in cognitive control. Neuroscientist 13:214–228. 10.1177/1073858407299288 [DOI] [PubMed] [Google Scholar]
- Aron AR, Robbins TW, Poldrack RA (2004) Inhibition and the right inferior frontal cortex. Trends Cogn Sci 8:170–177. 10.1016/j.tics.2004.02.010 [DOI] [PubMed] [Google Scholar]
- Ashburner J, Friston KJ (2005) Unified segmentation. Neuroimage 26:839–851. 10.1016/j.neuroimage.2005.02.018 [DOI] [PubMed] [Google Scholar]
- Bacon SJ, Smith AD (1993) A monosynaptic pathway from an identified vasomotor centre in the medial prefrontal cortex to an autonomic area in the thoracic spinal cord. Neuroscience 54:719–728. 10.1016/0306-4522(93)90242-8 [DOI] [PubMed] [Google Scholar]
- Bandler R, Carrive P (1988) Integrated defence reaction elicited by excitatory amino acid microinjection in the midbrain periaqueductal grey region of the unrestrained cat. Brain Res 439:95–106. 10.1016/0006-8993(88)91465-5 [DOI] [PubMed] [Google Scholar]
- Bandler R, Shipley MT (1994) Columnar organization in the midbrain periaqueductal gray: modules for emotional expression? Trends Neurosci 17:379–389. 10.1016/0166-2236(94)90047-7 [DOI] [PubMed] [Google Scholar]
- Barbas H, De Olmos J (1990) Projections from the amygdala to basoventral and mediodorsal prefrontal regions in the rhesus monkey. J Comp Neurol 300:549–571. 10.1002/cne.903000409 [DOI] [PubMed] [Google Scholar]
- Barbas H, Saha S, Rempel-Clower N, Ghashghaei T (2003a) Serial pathways from primate prefrontal cortex to autonomic areas may influence emotional expression. BMC Neurosci 10:25. 10.1186/1471-2202-4-25 [DOI] [PMC free article] [PubMed] [Google Scholar]
- Barbas H, Saha S, Rempel-Clower N, Ghashghaei T (2003b) Serial pathways from primate prefrontal cortex to autonomic areas may influence emotional expression. BMC Neurosci 4:25 10.1186/1471-2202-4-25 [DOI] [PMC free article] [PubMed] [Google Scholar]
- Barontini M, Lázzari JO, Levin G, Armando I, Basso SJ (1997) Age-related changes in sympathetic activity: biochemical measurements and target organ responses. Arch Gerontol Geriatr 25:175–186. 10.1016/S0167-4943(97)00008-3 [DOI] [PubMed] [Google Scholar]
- Barsuglia JP, Kaiser NC, Wilkins SS, Joshi A, Barrows RJ, Paholpak P, Panchal HV, Jimenez EE, Mather MJ, Mendez MF (2014) A scale of socioemotional dysfunction in frontotemporal dementia. Arch Clin Neuropsychol 29:793–805. 10.1093/arclin/acu050 [DOI] [PMC free article] [PubMed] [Google Scholar]
- Bates E, Wilson SM, Saygin AP, Dick F, Sereno MI, Knight RT, Dronkers NF (2003) Voxel-based lesion-symptom mapping. Nat Neurosci 6:448–450. 10.1038/nn1050 [DOI] [PubMed] [Google Scholar]
- Beissner F, Meissner K, Bär KJ, Napadow V (2013) The autonomic brain: an activation likelihood estimation meta-analysis for central processing of autonomic function. J Neurosci 33:10503–10511. 10.1523/JNEUROSCI.1103-13.2013 [DOI] [PMC free article] [PubMed] [Google Scholar]
- Benarroch EE. (1993) The central autonomic network: functional organization, dysfunction, and perspective. Mayo Clin Proc 68:988–1001. 10.1016/S0025-6196(12)62272-1 [DOI] [PubMed] [Google Scholar]
- Berntson GG, Bigger JT Jr, Eckberg DL, Grossman P, Kaufmann PG, Malik M, Nagaraja HN, Porges SW, Saul JP, Stone PH, van der Molen MW (1997) Heart rate variability: origins, methods, and interpretive caveats. Psychophysiology 34:623–648. 10.1111/j.1469-8986.1997.tb02140.x [DOI] [PubMed] [Google Scholar]
- Carlson MD, Geha AS, Hsu J, Martin PJ, Levy MN, Jacobs G, Waldo AL (1992) Selective stimulation of parasympathetic nerve fibers to the human sinoatrial node. Circulation 85:1311–1317. 10.1161/01.CIR.85.4.1311 [DOI] [PubMed] [Google Scholar]
- Carmichael ST, Price JL (1995) Limbic connections of the orbital and medial prefrontal cortex in macaque monkeys. J Comp Neurol 363:615–641. 10.1002/cne.903630408 [DOI] [PubMed] [Google Scholar]
- Carmichael ST, Price JL (1996) Connectional networks within the orbital and medial prefrontal cortex of macaque monkeys. J Comp Neurol 371:179–207. [DOI] [PubMed] [Google Scholar]
- Cohen J. (1992) A power primer. Psychol Bull 112:155–159. 10.1037/0033-2909.112.1.155 [DOI] [PubMed] [Google Scholar]
- Craig AD. (2002) How do you feel? Interoception: the sense of the physiological condition of the body. Nat Rev Neurosci 3:655–666. 10.1038/nrn894 [DOI] [PubMed] [Google Scholar]
- Craig AD. (2005) Forebrain emotional asymmetry: a neuroanatomical basis? Trends Cogn Sci 9:566–571. 10.1016/j.tics.2005.10.005 [DOI] [PubMed] [Google Scholar]
- Craig AD. (2009) How do you feel now? The anterior insula and human awareness. Nat Rev Neurosci 10:59–70. 10.1038/nrn2555 [DOI] [PubMed] [Google Scholar]
- Critchley HD. (2002) Electrodermal responses: what happens in the brain. Neuroscientist 8:132–142. 10.1177/107385840200800209 [DOI] [PubMed] [Google Scholar]
- Critchley HD. (2004) The human cortex responds to an interoceptive challenge. Proc Natl Acad Sci U S A 101:6333–6334. 10.1073/pnas.0401510101 [DOI] [PMC free article] [PubMed] [Google Scholar]
- Critchley HD. (2005) Neural mechanisms of autonomic, affective, and cognitive integration. J Comp Neurol 493:154–166. 10.1002/cne.20749 [DOI] [PubMed] [Google Scholar]
- Critchley HD, Harrison NA (2013) Visceral influences on brain and behavior. Neuron 77:624–638. 10.1016/j.neuron.2013.02.008 [DOI] [PubMed] [Google Scholar]
- Critchley HD, Mathias CJ, Josephs O, O'Doherty J, Zanini S, Dewar BK, Cipolotti L, Shallice T, Dolan RJ (2003) Human cingulate cortex and autonomic control: converging neuroimaging and clinical evidence. Brain 126:2139–2152. 10.1093/brain/awg216 [DOI] [PubMed] [Google Scholar]
- Damasio A, Carvalho GB (2013) The nature of feelings: evolutionary and neurobiological origins. Nat Rev Neurosci 14:143–152. 10.1038/nrn3403 [DOI] [PubMed] [Google Scholar]
- da Silva LG, de Menezes RC, dos Santos RA, Campagnole-Santos MJ, Fontes MA (2003) Role of periaqueductal gray on the cardiovascular response evoked by disinhibition of the dorsomedial hypothalamus. Brain Res 984:206–214. 10.1016/S0006-8993(03)03157-3 [DOI] [PubMed] [Google Scholar]
- Davis M, Whalen PJ (2001) The amygdala: vigilance and emotion. Mol Psychiatry 6:13–34. 10.1038/sj.mp.4000812 [DOI] [PubMed] [Google Scholar]
- Eckart JA, Sturm VE, Miller BL, Levenson RW (2012) Diminished disgust reactivity in behavioral variant frontotemporal dementia. Neuropsychologia 50:786–790. 10.1016/j.neuropsychologia.2012.01.012 [DOI] [PMC free article] [PubMed] [Google Scholar]
- Enriquez-Geppert S, Eichele T, Specht K, Kugel H, Pantev C, Huster RJ (2013) Functional parcellation of the inferior frontal and midcingulate cortices in a flanker-stop-change paradigm. Hum Brain Mapp 34:1501–1514. 10.1002/hbm.22002 [DOI] [PMC free article] [PubMed] [Google Scholar]
- Gatti PJ, Johnson TA, Massari VJ (1996) Can neurons in the nucleus ambiguus selectively regulate cardiac rate and atrio-ventricular conduction? J Auton Nerv Syst 57:123–127. 10.1016/0165-1838(95)00104-2 [DOI] [PubMed] [Google Scholar]
- Ghashghaei HT, Barbas H (2002) Pathways for emotion: interactions of prefrontal and anterior temporal pathways in the amygdala of the rhesus monkey. Neuroscience 115:1261–1279. 10.1016/S0306-4522(02)00446-3 [DOI] [PubMed] [Google Scholar]
- Gianaros PJ, Van Der Veen FM, Jennings JR (2004) Regional cerebral blood flow correlates with heart period and high-frequency heart period variability during working-memory tasks: implications for the cortical and subcortical regulation of cardiac autonomic activity. Psychophysiology 41:521–530. 10.1111/1469-8986.2004.00179.x [DOI] [PMC free article] [PubMed] [Google Scholar]
- Giuliani NR, Drabant EM, Bhatnagar R, Gross JJ (2011) Emotion regulation and brain plasticity: expressive suppression use predicts anterior insula volume. Neuroimage 58:10–15. 10.1016/j.neuroimage.2011.06.028 [DOI] [PMC free article] [PubMed] [Google Scholar]
- Goodkind MS, Sturm VE, Ascher EA, Shdo SM, Miller BL, Rankin KP, Levenson RW (2015) Emotion recognition in frontotemporal dementia and Alzheimer's disease: a new film-based assessment. Emotion 15:416–427. 10.1037/a0039261 [DOI] [PMC free article] [PubMed] [Google Scholar]
- Grossman P, Taylor EW (2007) Toward understanding respiratory sinus arrhythmia: relations to cardiac vagal tone, evolution and biobehavioral functions. Biol Psychol 74:263–285. 10.1016/j.biopsycho.2005.11.014 [DOI] [PubMed] [Google Scholar]
- Grossman P, van Beek J, Wientjes C (1990) A comparison of three quantification methods for estimation of respiratory sinus arrhythmia. Psychophysiology 27:702–714. 10.1111/j.1469-8986.1990.tb03198.x [DOI] [PubMed] [Google Scholar]
- Guo CC, Kurth F, Zhou J, Mayer EA, Eickhoff SB, Kramer JH, Seeley WW (2012) One-year test-retest reliability of intrinsic connectivity network fMRI in older adults. Neuroimage 61:1471–1483. 10.1016/j.neuroimage.2012.03.027 [DOI] [PMC free article] [PubMed] [Google Scholar]
- Guo CC, Sturm VE, Zhou J, Gennatas ED, Trujillo AJ, Hua AY, Crawford R, Stables L, Kramer JH, Rankin K, Levenson RW, Rosen HJ, Miller BL, Seeley WW (2016) Dominant hemisphere lateralization of cortical parasympathetic control as revealed by frontotemporal dementia. Proc Natl Acad Sci U S A 113:E2430–E2439. 10.1073/pnas.1509184113 [DOI] [PMC free article] [PubMed] [Google Scholar]
- Hoffstaedter F, Grefkes C, Caspers S, Roski C, Palomero-Gallagher N, Laird AR, Fox PT, Eickhoff SB (2014) The role of anterior midcingulate cortex in cognitive motor control: evidence from functional connectivity analyses. Hum Brain Mapp 35:2741–2753. 10.1002/hbm.22363 [DOI] [PMC free article] [PubMed] [Google Scholar]
- Hurley KM, Herbert H, Moga MM, Saper CB (1991) Efferent projections of the infralimbic cortex of the rat. J Comp Neurol 308:249–276. 10.1002/cne.903080210 [DOI] [PubMed] [Google Scholar]
- Jennings JR, Sheu LK, Kuan DC, Manuck SB, Gianaros PJ (2016) Resting state connectivity of the medial prefrontal cortex covaries with individual differences in high-frequency heart rate variability. Psychophysiology 53:444–454. 10.1111/psyp.12586 [DOI] [PMC free article] [PubMed] [Google Scholar]
- Joshi A, Mendez MF, Kaiser N, Jimenez E, Mather M, Shapira JS (2014a) Skin conductance levels may reflect emotional blunting in behavioral variant frontotemporal dementia. J Neuropsychiatry Clin Neurosci 26:227–232. 10.1176/appi.neuropsych.12110332 [DOI] [PubMed] [Google Scholar]
- Joshi A, Barsuglia JP, Mather MJ, Jimenez EE, Shapira J, Mendez MF (2014b) Evaluation of emotional blunting in behavioral variant frontotemporal dementia compared to Alzheimer's disease. Dement Geriatr Cogn Disord 38:79–88. 10.1159/000357838 [DOI] [PMC free article] [PubMed] [Google Scholar]
- Kumfor F, Piguet O (2012) Disturbance of emotion processing in frontotemporal dementia: a synthesis of cognitive and neuroimaging findings. Neuropsychol Rev 22:280–297. 10.1007/s11065-012-9201-6 [DOI] [PubMed] [Google Scholar]
- Kurth F, Zilles K, Fox PT, Laird AR, Eickhoff SB (2010) A link between the systems: functional differentiation and integration within the human insula revealed by meta-analysis. Brain Struct Funct 214:519–534. 10.1007/s00429-010-0255-z [DOI] [PMC free article] [PubMed] [Google Scholar]
- Laine CM, Spitler KM, Mosher CP, Gothard KM (2009) Behavioral triggers of skin conductance responses and their neural correlates in the primate amygdala. J Neurophysiol 101:1749–1754. 10.1152/jn.91110.2008 [DOI] [PMC free article] [PubMed] [Google Scholar]
- Levenson RW, Ascher E, Goodkind M, McCarthy M, Sturm V, Werner K (2008) Laboratory testing of emotion and frontal cortex. Handb Clin Neurol 88:489–498. 10.1016/S0072-9752(07)88025-0 [DOI] [PubMed] [Google Scholar]
- Levenson RW, Sturm VE, Haase CM (2014) Emotional and behavioral symptoms in neurodegenerative disease: a model for studying the neural bases of psychopathology. Annu Rev Clin Psychol 10:581–606. 10.1146/annurev-clinpsy-032813-153653 [DOI] [PMC free article] [PubMed] [Google Scholar]
- Levy MN. (1990) Autonomic interactions in cardiac control. Ann N Y Acad Sci 601:209–221. 10.1111/j.1749-6632.1990.tb37302.x [DOI] [PubMed] [Google Scholar]
- Levy MN, Yang T, Wallick DW (1993) Assessment of beat-by-beat control of heart rate by the autonomic nervous system: molecular biology technique are necessary, but not sufficient. J Cardiovasc Electrophysiol 4:183–193. 10.1111/j.1540-8167.1993.tb01222.x [DOI] [PubMed] [Google Scholar]
- Masi CM, Hawkley LC, Rickett EM, Cacioppo JT (2007) Respiratory sinus arrhythmia and diseases of aging: obesity, diabetes mellitus, and hypertension. Biol Psychol 74:212–223. 10.1016/j.biopsycho.2006.07.006 [DOI] [PMC free article] [PubMed] [Google Scholar]
- Mendez MF, Fong SS, Shapira JS, Jimenez EE, Kaiser NC, Kremen SA, Tsai PH (2014) Observation of social behavior in frontotemporal dementia. Am J Alzheimers Dis Other Demen 29:215–221. 10.1177/1533317513517035 [DOI] [PMC free article] [PubMed] [Google Scholar]
- Mesulam MM, Mufson EJ (1982) Insula of the old world monkey: I. Architectonics in the insulo-orbito-temporal component of the paralimbic brain. J Comp Neurol 212:1–22. 10.1002/cne.902120102 [DOI] [PubMed] [Google Scholar]
- Morris JC. (1993) The Clinical Dementia Rating (CDR): current version and scoring rules. Neurology 43:2412–2414. 10.1212/WNL.43.11.2412 [DOI] [PubMed] [Google Scholar]
- Mufson EJ, Mesulam MM (1982) Insula of the old world monkey: II: Afferent cortical input and comments on the claustrum. J Comp Neurol 212:23–37. 10.1002/cne.902120103 [DOI] [PubMed] [Google Scholar]
- Nee DE, Wager TD, Jonides J (2007) Interference resolution: insights from a meta-analysis of neuroimaging tasks. Cogn Affect Behav Neurosci 7:1–17. 10.3758/CABN.7.1.1 [DOI] [PubMed] [Google Scholar]
- Nichols TE, Holmes AP (2002) Nonparametric permutation tests for functional neuroimaging: a primer with examples. Hum Brain Mapp 15:1–25. 10.1002/hbm.1058 [DOI] [PMC free article] [PubMed] [Google Scholar]
- Ongür D, Price JL (2000) The organization of networks within the orbital and medial prefrontal cortex of rats, monkeys, and humans. Cereb Cortex 10:206–219. 10.1093/cercor/10.3.206 [DOI] [PubMed] [Google Scholar]
- Ongür D, An X, Price JL (1998) Prefrontal cortical projections to the hypothalamus in macaque monkeys. J Comp Neurol 401:480–505. [DOI] [PubMed] [Google Scholar]
- Oppenheimer SM, Gelb A, Girvin JP, Hachinski VC (1992) Cardiovascular effects of human insular cortex stimulation. Neurology 42:1727–1732. 10.1212/WNL.42.9.1727 [DOI] [PubMed] [Google Scholar]
- Oppenheimer SM, Kedem G, Martin WM (1996) Left-insular cortex lesions perturb cardiac autonomic tone in humans. Clin Auton Res 6:131–140. 10.1007/BF02281899 [DOI] [PubMed] [Google Scholar]
- Porges SW. (2001) The polyvagal theory: phylogenetic substrates of a social nervous system. Int J Psychophysiol 42:123–146. 10.1016/S0167-8760(01)00162-3 [DOI] [PubMed] [Google Scholar]
- Price JL. (1999) Prefrontal cortical networks related to visceral function and mood. Ann N Y Acad Sci 877:383–396. 10.1111/j.1749-6632.1999.tb09278.x [DOI] [PubMed] [Google Scholar]
- Rascovsky K, Hodges JR, Kipps CM, Johnson JK, Seeley WW, Mendez MF, Knopman D, Kertesz A, Mesulam M, Salmon DP, Galasko D, Chow TW, Decarli C, Hillis A, Josephs K, Kramer JH, Weintraub S, Grossman M, Gorno-Tempini ML, Miller BM (2007) Diagnostic criteria for the behavioral variant of frontotemporal dementia (bvFTD): current limitations and future directions. Alzheimer Dis Assoc Disord 21:S14–S18. 10.1097/WAD.0b013e31815c3445 [DOI] [PubMed] [Google Scholar]
- Rybak IA, Shevtsova NA, Paton JF, Dick TE, St-John WM, Mörschel M, Dutschmann M (2004) Modeling the ponto-medullary respiratory network. Respir Physiol Neurobiol 143:307–319. 10.1016/j.resp.2004.03.020 [DOI] [PubMed] [Google Scholar]
- Saku K, Kishi T, Sakamoto K, Hosokawa K, Sakamoto T, Murayama Y, Kakino T, Ikeda M, Ide T, Sunagawa K (2014) Afferent vagal nerve stimulation resets baroreflex neural arc and inhibits sympathetic nerve activity. Physiol Rep 2:e12136. 10.14814/phy2.12136 [DOI] [PMC free article] [PubMed] [Google Scholar]
- Saper CB. (2002) The central autonomic nervous system: conscious visceral perception and autonomic pattern generation. Annu Rev Neurosci 25:433–469. 10.1146/annurev.neuro.25.032502.111311 [DOI] [PubMed] [Google Scholar]
- Saper CB, Loewy AD, Swanson LW, Cowan WM (1976) Direct hypothalamo-autonomic connections. Brain Res 117:305–312. 10.1016/0006-8993(76)90738-1 [DOI] [PubMed] [Google Scholar]
- Satterthwaite TD, Elliott MA, Gerraty RT, Ruparel K, Loughead J, Calkins ME, Eickhoff SB, Hakonarson H, Gur RC, Gur RE, Wolf DH (2013) An improved framework for confound regression and filtering for control of motion artifact in the preprocessing of resting-state functional connectivity data. Neuroimage 64:240–256. 10.1016/j.neuroimage.2012.08.052 [DOI] [PMC free article] [PubMed] [Google Scholar]
- Seeley WW, Menon V, Schatzberg AF, Keller J, Glover GH, Kenna H, Reiss AL, Greicius MD (2007) Dissociable intrinsic connectivity networks for salience processing and executive control. J Neurosci 27:2349–2356. 10.1523/JNEUROSCI.5587-06.2007 [DOI] [PMC free article] [PubMed] [Google Scholar]
- Seeley WW, Crawford R, Rascovsky K, Kramer JH, Weiner M, Miller BL, Gorno-Tempini ML (2008) Frontal paralimbic network atrophy in very mild behavioral variant frontotemporal dementia. Arch Neurol 65:249–255. 10.1001/archneurol.2007.38 [DOI] [PMC free article] [PubMed] [Google Scholar]
- Seeley WW, Zhou J, Kim EJ (2012) Frontotemporal dementia: what can the behavioral variant teach us about human brain organization? Neuroscientist 18:373–385. 10.1177/1073858411410354 [DOI] [PubMed] [Google Scholar]
- Shipley MT. (1982) Insular cortex projection to the nucleus of the solitary tract and brainstem visceromotor regions in the mouse. Brain Res Bull 8:139–148. 10.1016/0361-9230(82)90040-5 [DOI] [PubMed] [Google Scholar]
- Shirer WR, Ryali S, Rykhlevskaia E, Menon V, Greicius MD (2012) Decoding subject-driven cognitive states with whole-brain connectivity patterns. Cereb Cortex 22:158–165. 10.1093/cercor/bhr099 [DOI] [PMC free article] [PubMed] [Google Scholar]
- Sturm VE, Allison S, Rosen HJ, Miller BL, Levenson RW (2006) Self-conscious emotion deficits in frontotemporal lobar degeneration. Brain 129:2508–2516. 10.1093/brain/awl145 [DOI] [PubMed] [Google Scholar]
- Sturm VE, Ascher EA, Miller BL, Levenson RW (2008) Diminished self-conscious emotional responding in frontotemporal lobar degeneration patients. Emotion 8:861–869. 10.1037/a0013765 [DOI] [PMC free article] [PubMed] [Google Scholar]
- Sturm VE, Sollberger M, Seeley WW, Rankin KP, Ascher EA, Rosen HJ, Miller BL, Levenson RW (2013) Role of right pregenual anterior cingulate cortex in self-conscious emotional reactivity. Soc Cogn Affect Neurosci 8:468–474. 10.1093/scan/nss023 [DOI] [PMC free article] [PubMed] [Google Scholar]
- ter Horst GJ, Luiten PG, Kuipers F (1984) Descending pathways from hypothalamus to dorsal motor vagus and ambiguus nuclei in the rat. J Auton Nerv Syst 11:59–75. 10.1016/0165-1838(84)90008-0 [DOI] [PubMed] [Google Scholar]
- Thayer JF, Lane RD (2000) A model of neurovisceral integration in emotion regulation and dysregulation. J Affect Disord 61:201–216. 10.1016/S0165-0327(00)00338-4 [DOI] [PubMed] [Google Scholar]
- Thayer JF, Siegle GJ (2002) Neurovisceral integration in cardiac and emotional regulation. IEEE Eng Med Biol Mag 21:24–29. 10.1109/MEMB.2002.1032635 [DOI] [PubMed] [Google Scholar]
- Thayer JF, Ahs F, Fredrikson M, Sollers JJ 3rd, Wager TD (2012) A meta-analysis of heart rate variability and neuroimaging studies: implications for heart rate variability as a marker of stress and health. Neurosci Biobehav Rev 36:747–756. 10.1016/j.neubiorev.2011.11.009 [DOI] [PubMed] [Google Scholar]
- Touroutoglou A, Hollenbeck M, Dickerson BC, Feldman Barrett L (2012) Dissociable large-scale networks anchored in the right anterior insula subserve affective experience and attention. Neuroimage 60:1947–1958. 10.1016/j.neuroimage.2012.02.012 [DOI] [PMC free article] [PubMed] [Google Scholar]
- Varikuti DP, Hoffstaedter F, Genon S, Schwender H, Reid AT, Eickhoff SB (2017) Resting-state test-retest reliability of a priori defined canonical networks over different preprocessing steps. Brain Struct Funct 222:1447–1468. 10.1007/s00429-016-1286-x [DOI] [PMC free article] [PubMed] [Google Scholar]
- Winkelmann T, Thayer JF, Pohlack S, Nees F, Grimm O, Flor H (2017) Structural brain correlates of heart rate variability in a healthy young adult population. Brain Struct Funct 222:1061–1068. 10.1007/s00429-016-1185-1 [DOI] [PubMed] [Google Scholar]
- Wittling W, Block A, Genzel S, Schweiger E (1998a) Hemisphere asymmetry in parasympathetic control of the heart. Neuropsychologia 36:461–468. 10.1016/S0028-3932(97)00129-2 [DOI] [PubMed] [Google Scholar]
- Wittling W, Block A, Schweiger E, Genzel S (1998b) Hemisphere asymmetry in sympathetic control of the human myocardium. Brain Cogn 38:17–35. 10.1006/brcg.1998.1000 [DOI] [PubMed] [Google Scholar]
- Xavier CH, Beig MI, Ianzer D, Fontes MA, Nalivaiko E (2013) Asymmetry in the control of cardiac performance by dorsomedial hypothalamus. Am J Physiol Regul Integr Comp Physiol 304:R664–R674. 10.1152/ajpregu.00401.2012 [DOI] [PubMed] [Google Scholar]
- Yoon BW, Morillo CA, Cechetto DF, Hachinski V (1997) Cerebral hemispheric lateralization in cardiac autonomic control. Arch Neurol 54:741–744. 10.1001/archneur.1997.00550180055012 [DOI] [PubMed] [Google Scholar]
- Zhou J, Greicius MD, Gennatas ED, Growdon ME, Jang JY, Rabinovici GD, Kramer JH, Weiner M, Miller BL, Seeley WW (2010) Divergent network connectivity changes in behavioural variant frontotemporal dementia and Alzheimer's disease. Brain 133:1352–1367. 10.1093/brain/awq075 [DOI] [PMC free article] [PubMed] [Google Scholar]
Associated Data
This section collects any data citations, data availability statements, or supplementary materials included in this article.
Supplementary Materials
Node-pair connections (i.e. edges) that explained a significant portion of variance in RSA and SCL in each diagnosis separately. To examine whether the associations that we found between the functional connectivity data and ANS physiology across the groups held in each diagnosis, we conducted hierarchical regression analyses for RSA and SCL in each group separately (15 patients with bvFTD and 13 healthy controls). In step one we included age, sex, and education as nuisance covariates, and in step two we entered the edges that had explained a significant portion of the variance in our forward-entry regression models conducted across the sample. Although some edges were no longer significant predictors in these smaller groups, the effect sizes were largely comparable in each diagnosis separately, which suggests that the associations we detected between functional connectivity and ANS physiology are not specific to either group. * This edge was negatively correlated in the models conducted across the groups, but in the diagnostic groups separately it has a very weak positive association with RSA. Download Figure 4-1, DOCX file (14.8KB, docx)