Abstract
Objective
In Japan, following the launch of dimethyl fumarate (DMF) after fingolimod as a disease-modifying drug in multiple sclerosis (MS), some patients switched from fingolimod to DMF. The aim of this study was to determine the follow-up status of MS patients who switched to DMF after fingolimod cessation.
Methods
Clinical and magnetic resonance imaging (MRI) data in 19 patients with MS who switched to DMF were collected for at least for 6 months after fingolimod cessation.
Results
Ten patients (52.6%) experienced clinical or MRI exacerbation after fingolimod cessation. The peripheral blood lymphocyte counts at the time of fingolimod cessation in those with disease exacerbation were significantly lower than in those without exacerbation. The patients with disease exacerbation were further classified into three groups based on MRI findings: those with some new T2-weighted lesions with or without gadolinium (Gd) enhancement (group I), those with more new and/or enlarged T2-weighted lesions with Gd enhancement compared to pre-fingolimod induction (group II), and those with multifocal tumefactive demyelinating lesions. In group II, the clinical disease activity, which was similar to that at fingolimod initiation in group I, was higher than the clinical disease activity observed before fingolimod initiation. Conversely, group III exhibited unexpected new MRI findings that were not evident before fingolimod initiation.
Conclusion
Cessation of fingolimod might precipitate rebound or reactivation of clinical disease in patients with MS, and careful follow-up is necessary for patients who discontinue fingolimod.
Keywords: multiple sclerosis, fingolimod, exacerbation, rebound
Introduction
Fingolimod, a sphingosine 1-phosphate (S1P) receptor modulator that prevents the egress of lymphocytes from lymph nodes, was demonstrated to be highly effective for treating relapsing-remitting multiple sclerosis (MS) by the FTY720 Research Evaluating Effects of Daily Oral Therapy in Multiple Sclerosis (FREEDOMS) (1) and the Trial Assessing Injectable Interferon versus FTY720 Oral in Relapsing-Remitting Multiple Sclerosis (TRANSFORMS) (2) studies. In Japan, fingolimod was launched as the first oral disease-modifying drug (DMD) for MS in 2011. Fingolimod and other highly effective DMDs have profoundly improved the management of patients with MS, and in fact, fingolimod has been used widely in Japan because of its high efficacy and convenience as an orally available therapeutic. However, the benefits of DMD therapy may accompany serious complications, including progressive multifocal leukoencephalopathy (PML) (3). A second oral DMD, dimethyl fumarate (DMF), was launched in 2017 in Japan, and some patients with MS on fingolimod treatment decided to switch to DMF due to the risk of developing several serious adverse effects with fingolimod, including PML. However, several case reports highlighted a possible risk of disease exacerbation or rebound after fingolimod cessation, which could potentially result in debilitating disease progression (4-20). These reports have complicated clinical decision-making regarding switching from fingolimod to DMF.
In the present study, we investigated the clinical and magnetic resonance imaging (MRI) findings of 10 patients who experienced rebound or reactivation of clinical disease among 19 patients who switched from fingolimod to DMF. MS patients with exacerbation after fingolimod cessation were classified into three distinct groups based on their MRI findings, and the observed distinct patterns were discussed. In addition, the clinical and laboratory data were compared between patients with and without disease exacerbation.
Materials and Methods
Clinical and MRI data were collected from 19 consecutive patients who were managed at Sapporo Neurology Hospital who discontinued fingolimod treatment with the intent to switch to DMF between February and April 2017. Most of the patients eventually switched from fingolimod to DMF due to severe lymphopenia and in consideration of the risk for PML associated with fingolimod. The clinical records of patients, including the peripheral blood lymphocyte counts and MRI data, from before fingolimod cessation until at least six months after fingolimod cessation were reviewed.
All patients visited the clinic for at least once a month before and after the withdrawal of fingolimod. In all study patients, brain MRI was performed every three to four months before fingolimod cessation and one month after fingolimod cessation. Subsequently, brain MRI was performed at one- to three-month intervals, regardless of clinical relapse, as well as at the time of clinical relapse. Spinal MRI was performed in cases with relapse suspected in a spinal cord lesion.
All study patients were informed of the risk of reactivation following fingolimod withdrawal. DMF was started after the peripheral total lymphocyte count (TLC) was confirmed to be over 900 /μL and at least 4 weeks after fingolimod cessation. All patients were seronegative for anti-aquaporin 4 antibody according to a cell-based assay.
Group differences were determined by either the chi-squared test for categorical data or the Mann-Whitney U test for continuous variables. A p value of <0.05 was considered to indicate statistical significance for all analyses.
This study was performed in accordance with the principles of the Declaration of Helsinki and was approved by the ethics committee of the local institute.
Results
Characteristics of MS patients with clinical and radiological exacerbation after the cessation of fingolimod treatment
Of the 19 total patients included in this study, the 10 (52.3%) who experienced radiological exacerbation on brain MRI after fingolimod cessation (Table 1) were classified into 3 groups based on the MRI findings: including patients with new T2-weighted lesions either with or without gadolinium (Gd) enhancement (group I), those with many new or enlarged T2-weighted lesions with Gd enhancement (group II), and those with multifocal tumefactive demyelinating lesions (TDLs). In group II, the clinical disease activity, which was similar to that at fingolimod initiation in group I, was higher than the clinical disease activity observed before fingolimod initiation. Conversely, group III exhibited unexpected new MRI findings that were not evident before fingolimod initiation.
Table 1.
Demographic and Clinical Characteristics of 10 Patients with Multiple Sclerosis Who Experienced Clinical or MRI Exacerbation after Fingolimod Cessation.
| Group I | Group II | Group III | ||||||||
|---|---|---|---|---|---|---|---|---|---|---|
| Patient No. | 1 | 2 | 3 | 4 | 5 | 6 | 7 | 8 | 9 | 10 |
| Sex | F | F | F | F | M | F | F | F | F | F |
| At fingolimod initiation | ||||||||||
| Disease duration (years) | 1 | 4 | 2 | 13 | 37 | 13 | 23 | 3 | 7 | 5 |
| ARR (preceding year) | 3 | 2 | 1 | 0 | 1 | 1 | 1 | 0 | 1 | 1 |
| Clinical course | RR | RR | RR | SP | RR | SP | SP | mono | RR | RR |
| EDSS | 6.5 | 1.0 | 2.5 | 6.5 | 2.5 | 4.5 | 4.5 | 0.0 | 1.5 | 0.0 |
| During fingolimod therapy | ||||||||||
| Duration of fingolimod treatment (weeks) | 124 | 264 | 144 | 260 | 248 | 202 | 152 | 120 | 84 | 144 |
| ARR | 3 | 0 | 0 | 0 | 0 | 0 | 0 | 0 | 0 | 0.36 |
| EDSS | 6.5 | 1.0 | 2.5 | 6.5 | 2.5 | 4.5 | 4.5 | 0.0 | 1.5 | 0.0 |
| Age at fingolimod cessation (years) | 54 | 37 | 36 | 46 | 59 | 44 | 58 | 34 | 45 | 39 |
| Clinical or MRI exacerbation after fingolimod cessation | ||||||||||
| Time from fingolimod cessation ( days) | 16 | 98 | 87 | 52 | 42 | 140 | 141 | 36 | 91 | 21 |
| EDSS | 7.0 | 1.5 | 3.5 | 7.5 | 2.5 | 4.5 | 4.5 | 0.0 | 1.5 | 2.5 |
| Days from fingolimod cessation to DMF initiation | 41 | n.i. | 134 | 64 | 43 | 32 | 84 | 35 | 36 | 43 |
| Peripheral blood lymphocyte count (/μL) | ||||||||||
| At fingolimod cessation | 530 | 372 | 103 | 90 | 497 | 481 | 326 | 411 | 479 | 368 |
| 4 weeks after fingolimod cessation | 1,431 | 499 | 297 | 1,468 | 1,081 | 979 | 638 | 1,209 | 1,191 | 718 |
ARR: annual relapse rate, EDSS: expanded disability status scale, DMF: dimethyl fumarate, MRI: magnetic resonance imaging, RR: relapsing-remitting, SP: secondary progressive, mono: monophasic, n.i.: not induced
Group I
Patients 1, 2, and 3 comprising group I escalated treatment from interferon β (IFNβ) to fingolimod due to a lack of efficacy with IFNβ. Patient 1 relapsed clinically with new T2-weighted and Gd-enhanced lesions at 16 days after fingolimod cessation and received high-dose steroid pulse therapy with a good clinical response. In this patient, DMF was started 25 days after the relapse; however, a new Gd-enhanced lesion was found on MRI performed 1 month after DMF initiation (Fig. 1a and b). Patients 2 and 3 did not start DMF therapy immediately after fingolimod cessation because of low lymphocyte numbers; these two patients experienced clinical relapse at 98 (Fig. 1c and d) and 97 (Fig. 1e and f) days after fingolimod cessation, respectively.
Figure 1.
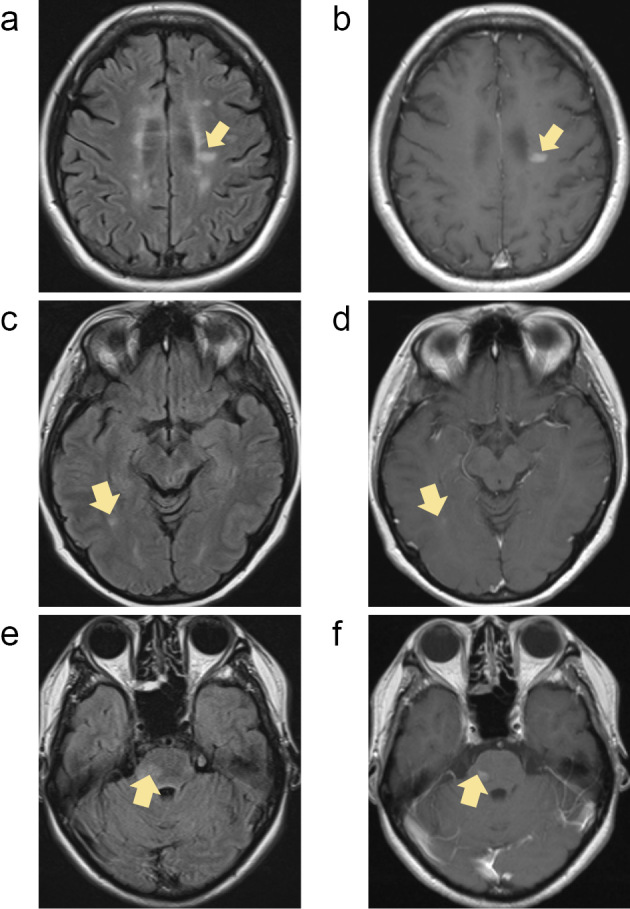
Magnetic resonance imaging findings of group I. In patient 1, a new gadolinium (Gd) -enhanced lesion was found on magnetic resonance imaging (MRI) at one month after the initiation of dimethyl fumarate (DMF) (a, b). Patient 2 experienced clinical relapse with new Gd-enhanced lesions 98 days after fingolimod cessation (c, d). Patient 3 experienced clinical relapse with new Gd-enhanced lesions 97 days after fingolimod cessation (e, f). All arrows show new lesions with Gd enhancement after fingolimod cessation (a, c, e; FLAIR, b, d, f; Gd-enhanced T1-weighted image).
These three patients had ≤ 3 new lesions on MRI after fingolimod cessation, and the clinical and MRI findings at the time of relapse were not markedly different from those during or prior to fingolimod treatment, suggesting that their disease activity did not change during or prior to fingolimod treatment.
Group II
Patients 4, 5, 6, and 7 comprising group II decided to switch from IFNβ to fingolimod due to disease progression and/or a reluctance to continue self-injections and their long disease duration and large number of brain lesions on MRI. Patients 4, 5, and 6 had shown no multifocal enhanced lesions on brain MRI during more than 10 years of follow-up prior to fingolimod treatment. After switching to fingolimod, the clinical and MRI findings for all four patients in group II were stable.
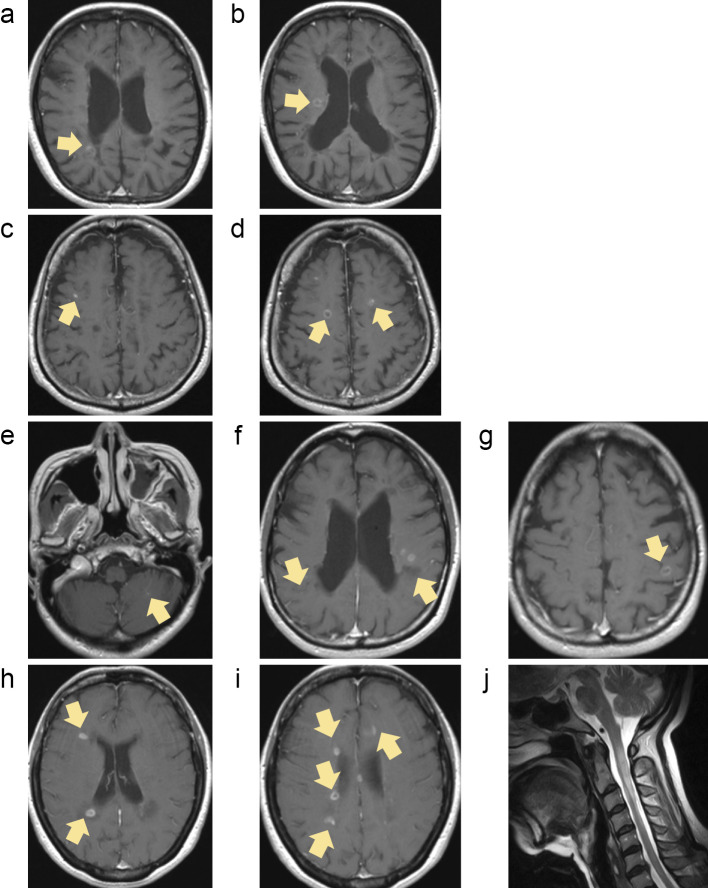
Patient 4 suffered from vague fatigue and worsening of preexistent ataxia and leg weakness, and brain MRI revealed 3 enhanced lesions 52 days after fingolimod cessation (Fig. 2a). The clinical symptoms in this patient partially recovered with steroid pulse therapy, and DMF treatment was initiated. However, the patient's clinical symptoms worsened, with 2 new enhanced lesions on brain MRI obtained 81 days after fingolimod cessation (Fig. 2b). This clinical deterioration poorly responded to steroid pulse therapy, and the patient suffered further disability. Additional new enhanced lesions on brain MRI were detected 170 days after fingolimod cessation.
Figure 2.
Magnetic resonance imaging findings of group II. In patient 4, brain magnetic resonance imaging (MRI) demonstrated 3 enhanced lesions 52 days after fingolimod cessation (a), and 2 new enhanced lesions on brain MRI were found 81 days after fingolimod cessation (b). Patient 5 had an enhanced lesion on brain MRI without new clinical signs 42 days after fingolimod cessation (c) and started experiencing escalated fatigue and unsteady gait associated with the T2-weighted lesion as well as 6 new enhanced lesions on brain MRI 70 days after fingolimod cessation (d). In patient 6, brain MRI 139 days after fingolimod cessation showed 7 new enhanced lesions without new clinical symptoms or neurological signs (e-g). In patient 7, brain MRI 141 days after fingolimod cessation demonstrated 12 new enhanced lesions (h-i). Prior to fingolimod cessation, patient 7 temporarily stopped fingolimod 7 months after initiation due to multi-organ failure of unknown cause and made a complete recovery by intensive treatment. Four months after temporary fingolimod cessation, the patient clinically relapsed with a longitudinally extending cervical cord lesion mimicking neuromyelitis optica (j). All arrows indicate new lesions with Gd enhancement after fingolimod cessation (a-i; Gd-enhanced T1-weighted image, j; T2-weighted image).
Patient 5 showed a Gd-enhanced lesion on brain MRI without new clinical signs 42 days after fingolimod cessation (Fig. 2c). DMF was initiated the next day in this patient, who experienced escalation of fatigue and unsteady gait associated with the new T2-weighted lesion as well as 6 new enhanced lesions on brain MRI obtained 70 days after fingolimod cessation (Fig. 2d). Therefore, steroid pulse therapy was initiated, which led to the complete resolution of the clinical deficits. However, other new enhanced lesions on brain MRI were observed 81 and 147 days after fingolimod cessation.
Patient 6 started DMF 32 days after fingolimod cessation, and brain MRIs obtained 29 and 63 days after fingolimod cessation revealed no marked changes compared with the previous MRI findings. However, brain MRI 139 days after fingolimod cessation revealed 7 new enhanced lesions without new clinical symptoms or neurological signs (Fig. 2e-g).
Patient 7 started DMF 84 days after fingolimod cessation, and brain MRIs 42 days and 84 days later were stable. However, brain MRI obtained 141 days after fingolimod cessation revealed 12 new enhanced lesions (Fig. 2h and i). Additional new enhanced lesions were observed on brain MRI 169 days after fingolimod cessation. Prior to these episodes, the patient temporarily stopped fingolimod seven months after initiating therapy due to multi-organ failure of unknown cause and made a complete recovery following intensive treatment. Four months after the temporary cessation of fingolimod, the patient relapsed clinically with a longitudinally extending cervical spinal cord lesion mimicking neuromyelitis optica (Fig. 2j), which required the reinitiation of fingolimod treatment.
Patients in group II had ≥4 enhanced lesions (>10 lesions in most cases) but no TDLs after fingolimod cessation. These multiple enhanced lesions had never been observed prior to fingolimod induction in those patients.
Group III
Patients 8, 9, and 10 decided to switch to fingolimod due to ineffectiveness of IFNβ, and all patients decided to switch from fingolimod to DMF in consideration of the PML risk.
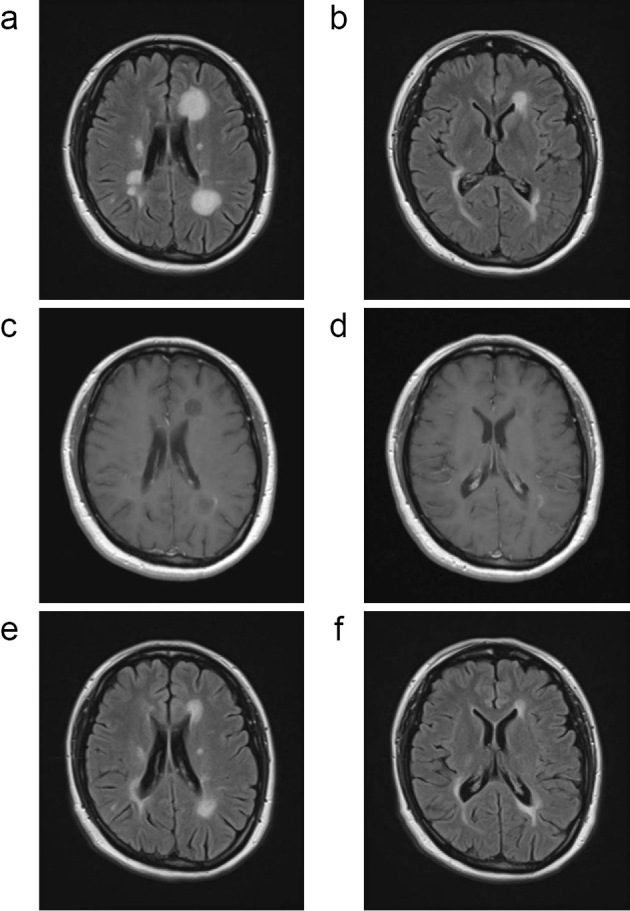
The disease activity of patient 8 persisted despite fingolimod treatment, based on the MRI findings in the absence of clinical relapse. Brain MRI at 35 days after fingolimod cessation revealed multifocal TDLs (Fig. 3a-d) without any clinical signs. DMF was initiated the next day in this patient, and a marked improvement on MRI was observed with high-dose steroid therapy (Fig. 3e and f). Although no TDLs appeared thereafter, new enhanced lesions were persistently observed on brain MRI at 99, 127, and 168 days after fingolimod cessation despite DMF treatment.
Figure 3.
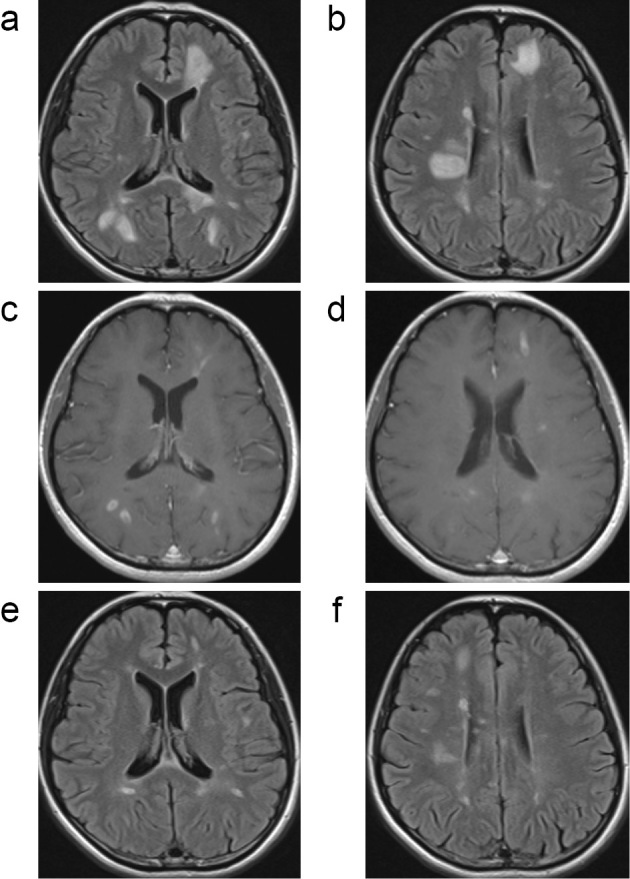
Magnetic resonance imaging findings of group III (Patient 8). In patient 8, brain magnetic resonance imaging (MRI) 35 days after fingolimod cessation demonstrated multifocal tumefactive demyelinating lesions (TDLs) (a-d) without any clinical signs. The patient subsequently received high-dose steroid therapy with marked improvement on MRI (e-f) (a, b, e, f; FLAIR, c, d; Gd-enhanced T1-weighted image).
In patient 9, the disease activity was clinically and radiologically stable during fingolimod treatment. The brain MRI findings at 28 days after fingolimod cessation were stable, and DMF was started 36 days after fingolimod cessation. The patient complained of escalated fatigue and dizziness 80 days after fingolimod cessation, and brain MRI 91 days after fingolimod cessation revealed multifocal TDLs (Fig. 4a-d). Those TDLs as well as the clinical condition of the patient were markedly improved with high-dose corticosteroids (Fig. 4e and f). Additional new enhanced lesions were observed on brain MRI at 119 and 173 days after fingolimod cessation, despite DMF treatment.
Figure 4.
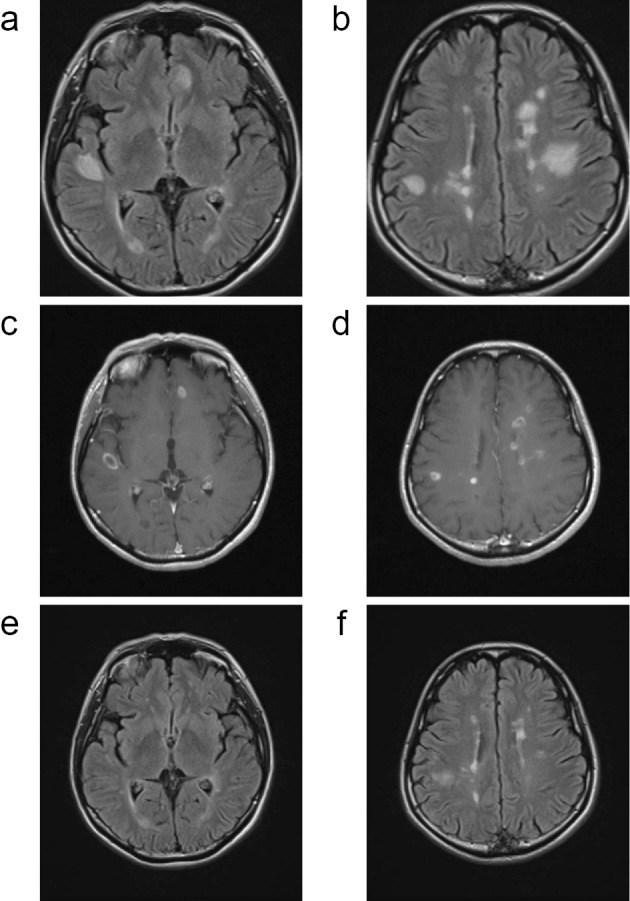
Magnetic resonance imaging findings of group III (Patient 9). In patient 9, brain magnetic resonance imaging (MRI) 91 days after fingolimod cessation showed multifocal tumefactive demyelinating lesions (TDLs) (a-d). These TDLs as well as the clinical condition were markedly improved with high-dose corticosteroids (e-f) (a, b, e, f; FLAIR, c, d; Gd-enhanced T1-weighted image).
Although the disease activity of patient 10 was stable during fingolimod treatment, the patient experienced weakness and numbness in the left lower limb with new T2-weighted lesions on brain MRI 21 days after fingolimod cessation. The clinical deterioration responded well to high-dose steroids; however, the patient experienced new symptoms, including mild hemiplegia and unsteady gait, 42 days after fingolimod cessation. The patient was restarted on high-dose steroid therapy, and DMF was also initiated. However, brain MRI obtained 63 days after fingolimod cessation revealed the further expansion of multiple TDLs. Steroid pulse therapy was started, and brain MRI 78 days after fingolimod cessation revealed slight improvement in the TDLs (Fig. 5a-d). Subsequently, the clinical signs recovered completely, and the TDLs improved gradually (Fig. 5e and f). However, additional new enhanced lesions were observed at 89 and 149 days after fingolimod cessation despite treatment with DMF.
Figure 5.
Magnetic resonance imaging findings of group III (Patient 10). In patient 10, brain magnetic resonance imaging (MRI) 78 days after fingolimod cessation demonstrated the enlargement of lesions (a-d). Repeated steroid pulse therapy led to a gradual improvement in the tumefactive demyelinating lesions (TDLs) (e-f) (a, b, e, f; FLAIR, c, d; Gd-enhanced T1-weighted image).
Overall group findings
Among these 10 patients, severe lymphopenia persisted in patients 2 and 3 during clinical relapses. The remaining 8 patients recovered from lymphopenia when they suffered from exacerbations.
Characteristics of MS patients without disease exacerbation after the cessation of fingolimod treatment
Table 2 summarizes the clinical and demographic characteristics of the nine patients who did not experience disease exacerbation after fingolimod cessation.
Table 2.
Demographic and Clinical Characteristics of 9 Patients with Multiple Sclerosis Who Did Not Experience Clinical Nor MRI Exacerbation after Fingolimod Cessation.
| Patient No. | 11 | 12 | 13 | 14 | 15 | 16 | 17 | 18 | 19 |
|---|---|---|---|---|---|---|---|---|---|
| Sex | F | F | M | F | F | M | M | F | M |
| At fingolimod initiation | |||||||||
| Disease duration (years) | 3 | 5 | 6 | 32 | 13 | 15 | 11 | 0.5 | 7 |
| ARR (preceding year) | 0 | 1 | 0 | 2 | 0 | 0 | 0 | 1 | 0 |
| Clinical course | RR | RR | SP | SP | SP | RR | SP | RR | RR |
| EDSS | 1.0 | 1.5 | 5.5 | 7.0 | 4.5 | 0.0 | 6.5 | 0.0 | 0.0 |
| During fingolimod therapy | |||||||||
| Duration of fingolimod treatment (weeks) | 216 | 56 | 48 | 126 | 182 | 270 | 112 | 243 | 113 |
| ARR | 0.24 | 0 | 0 | 0.41 | 0 | 0 | 0 | 0 | 0 |
| EDSS | 1.0 | 1.5 | 5.5 | 7.0 | 4.5 | 0.0 | 7.0 | 0.0 | 0.0 |
| Age at fingolimod cessation (years) | 45 | 33 | 48 | 53 | 49 | 44 | 41 | 23 | 43 |
| Days from fingolimod cessation to DMF initiation | 77 | 42 | 35 | 41 | 43 | 72 | 34 | 34 | 30 |
| Peripheral blood lymphocyte count (/μL) | |||||||||
| At fingolimod cessation | 667 | 701 | 777 | 711 | 720 | 673 | 2,628 | 819 | 621 |
| 4 weeks after fingolimod cessation | 939 | 1,072 | 1,350 | 1,339 | 1,081 | 807 | 3,083 | 1,347 | 1,198 |
ARR: annual relapse rate, EDSS: expanded disability status scale, DMF: dimethyl fumarate, MRI: magnetic resonance imaging, RR: relapsing-remitting, SP: secondary progressive, mono: monophasic
A comparison of the clinical and laboratory data between patients with and without disease exacerbation
No significant differences in the age at fingolimod cessation, sex, clinical course, disease duration, expanded disability status scale (EDSS), or annual relapse rate (ARR) at fingolimod initiation or during fingolimod treatment were noted between the patients who experienced disease exacerbations and those did not (data not shown).
The peripheral TLCs at 4 weeks after fingolimod cessation were significantly higher than those at the time of fingolimod cessation (baseline) in both the exacerbation [baseline: median 445, interquartile range (IQR) 326-481/μL; 4 weeks: median 1,030/μL, IQR 638-1,209/μL] and non-exacerbation groups (baseline: median 711, IQR 670-798/μL; 4 weeks: median 1,198/μL, IQR 1,006-1,349/μL; Fig. 6a). At the time of fingolimod cessation, the peripheral TLCs of the exacerbation group were significantly lower than those in the non-exacerbation group (p<0.001; Fig. 6a). However, the TLCs at four weeks after fingolimod cessation were not significantly different between the two groups. The ratio of TLCs at four weeks after fingolimod cessation to those at the time of fingolimod cessation was significantly higher in the exacerbation group than in the non-exacerbation group (p<0.01; Fig. 6b). Of note, the TLC data of patient 17 (Fig. 6a) and the TLC ratio data of patient 4 (Fig. 6b) appeared different from those values of other patients in the cohort. However, even after excluding the data of these two patients, the differences in TLCs at the time of fingolimod cessation as well as the TLC ratio between the two groups remained significant (p<0.001 and p<0.01, respectively).
Figure 6.
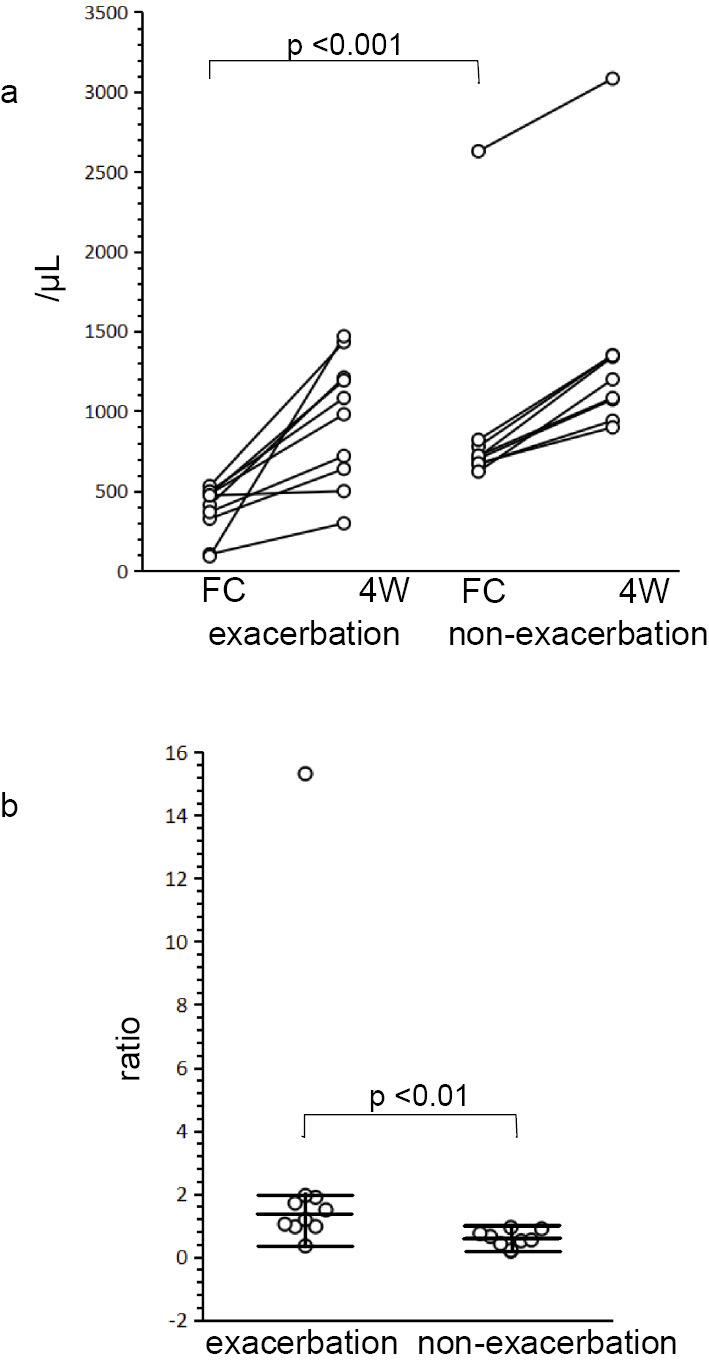
Peripheral total lymphocyte counts at fingolimod cessation and four weeks after fingolimod cessation. The peripheral blood total lymphocyte counts (TLCs), which were significantly increased four weeks after fingolimod cessation in both the exacerbation and non-exacerbation groups, were significantly lower in the exacerbation group than in the non-exacerbation group at the time of fingolimod cessation (a). The ratio of TLCs at four weeks after fingolimod cessation to the TLCs at fingolimod cessation was significantly higher in the exacerbation group than in the non-exacerbation group (b). FC: at the time of fingolimod cessation, 4W: four weeks after fingolimod cessation
Discussion
Several studies have reported patients exhibiting severe disease reactivation and TDLs after fingolimod cessation (4-20). The reasons for fingolimod withdrawal have varied among reports, ranging from pregnancy, adverse events, and minimal efficacy to switching to other DMDs. In the current study, we reported 19 patients who discontinued fingolimod with the intention to switch to DMF and were followed for at least 6 months after fingolimod cessation. Among these, 10 patients suffered from clinical or MRI exacerbation after fingolimod cessation.
The current study revealed that patients with low peripheral TLCs, especially those with <500/μL lymphocytes, at the time of fingolimod cessation might be at risk for disease exacerbation. The ratio of the TLCs at four weeks to those at the time of fingolimod cessation was also significantly higher in the exacerbation group than in the non-exacerbation group, although this discrepancy might be an inevitable result of the exacerbation group already having lower TLCs at the time of fingolimod cessation than the non-exacerbation group. The peripheral TLCs during fingolimod therapy or at fingolimod cessation were described in 7 cases among 4 previous studies investigating severe disease reactivation or TDLs after fingolimod cessation; 6 of those cases had <500/μL TLCs (11, 13-15). If lower TLCs at fingolimod cessation and a higher ratio of TLCs in a short period are risk factors for disease exacerbation after fingolimod cessation, the gradual discontinuation of fingolimod, such as a tiered reduction in dosage or alternate-day administration, might be help reduce the incidence of disease exacerbation after fingolimod cessation.
In the current study, we were able to classify the brain MRI findings of the study patients who had increased disease activity after fingolimod cessation into three patterns. The pattern observed in group I included some T2-weighted lesions smaller than 2 cm in diameter with or without Gd enhancement. In this group, the severity and frequency of clinical relapses were similar to those prior to fingolimod induction. The pattern seen in group II included multiple severe lesions with Gd enhancement, suggesting that the disease activity was higher than that prior to fingolimod induction. The patients in this group had many new or enlarged T2-weighted lesions with Gd enhancement and experienced greater clinical activity than before fingolimod initiation. In previous reports, most brain MR images of MS patients with an increased disease activity after fingolimod cessation showed multiple enhanced lesions, with a disease activity exceeding that observed prior to treatment with fingolimod (4, 5, 7, 8, 11, 12, 14, 16, 18, 19). These MRI findings from earlier studies may be similar to the pattern observed in the group II cases in our study. The pattern seen in group III included TDLs over 2 cm in diameter, which were not found in group I or II. Previous studies reported four cases that developed TDLs after fingolimod cessation (10, 13, 17). The estimated incidence of TDLs was reported to be 1-2 per 1,000 among patients with MS, with most observed in the early disease stage (21). Therefore, our finding that 3 out of 19 patients that ceased fingolimod treatment developed TDLs was unexpected. However, several cases of TDLs developing during fingolimod treatment have been reported (22, 23). Despite these present and previous findings, the relationship between fingolimod treatment and TDLs remains unclear.
The higher rebound or reactivation rate after fingolimod cessation in the current study than in a previous report (19) may be attributed to any of several reasons, such as the early detection of non-symptomatic lesions due to periodic brain MRI in the current study and racial differences. However, the reasons for the increase in the rebound or reactivation rate after fingolimod cessation remain unclear. In the current study, periodic brain MRI was performed after fingolimod cessation, regardless of clinical relapse, to evaluate the disease activity in patients with MS. Consequently, a high disease activity after fingolimod cessation was confirmed on MRI even in patients with minimal clinical symptoms or neurological changes. Indeed, no or minimal clinical symptoms were accompanied by disease rebound after fingolimod cessation in most cases. These findings support the notion that periodic MRI might be necessary for the early detection of rebound after fingolimod cessation.
Most previous studies have reported that the response to high-dose steroid therapy was poor in patients with disease rebound after fingolimod cessation, with some patients requiring plasma exchange (7, 14-16, 19). However, in the current study, the response to high-dose steroid therapy was relatively good, and treatment with plasma exchange was not necessary. These relatively good results might be associated with the follow-up of patients with periodic MRI and the early detection of increased disease activity, which facilitated earlier intervention. In the current study, some patients developed or continued to experience increased clinical disease activity with new Gd-enhanced lesions on MRI, even after DMF initiation (Group II), suggesting that careful follow-up is necessary for some time for patients who discontinue fingolimod, even after DMF treatment is initiated.
The pathophysiological mechanisms that have been proposed to underlie disease rebound after fingolimod cessation include the rapid influx and increase in the number of self-reactive T cells, especially central memory T cells, from lymph nodes to peripheral blood (24), the activation of antibody production by T cells (25), and the reduction of direct S1P receptor-mediated actions on oligodendrocytes, astrocytes, and neurons (26). We did not conduct an in-depth analysis of lymphocyte subsets or their molecular profiles, which limits any discussion of the potential mechanisms underlying disease rebound after fingolimod cessation.
Conclusion
More than half of the patients who discontinued fingolimod to switch to DMF experienced increased clinical disease activity or suffered from rebound after fingolimod cessation. The mechanisms underlying the disease rebound were unclear. Although our finding suggest that a lower TLC at the time of fingolimod cessation might be a risk factor for disease exacerbation, additional studies investigating the associations between the clinical and laboratory data will be necessary to clarify the pathological mechanisms underlying rebound after fingolimod cessation. Furthermore, how to prevent rebound after fingolimod cessation remains unclear. Given these findings, careful consideration and follow-up are necessary in patients who discontinue fingolimod, and patients should be duly informed of the risk of reactivation or rebound after fingolimod cessation. It may be helpful to consult with MS experts about whether or not DMDs should be switched and how DMDs should be switched.
The authors state that they have no Conflict of Interest (COI).
Acknowledgement
The authors thank Dr. Toshiyuki Takahashi at Tohoku University for his great help with the analysis of the patient samples for anti-aquaporin 4 antibody and Mrs. Eri Sato at Sapporo Neurology Hospital for her great help with this study.
References
- 1. Kappos L, Radue EW, O'Connor P, et al. A placebo-controlled trial of oral fingolimod in relapsing multiple sclerosis. N Engl J Med 362: 387-401, 2010. [DOI] [PubMed] [Google Scholar]
- 2. Cohen JA, Barkhof F, Comi G, et al. Oral fingolimod or intramuscular interferon for relapsing multiple sclerosis. N Engl J Med 362: 402-415, 2010. [DOI] [PubMed] [Google Scholar]
- 3. Faulkner M. Risk of progressive multifocal leukoencephalopathy in patients with multiple sclerosis. Expert Opin Drug Saf 14: 1737-1748, 2015. [DOI] [PubMed] [Google Scholar]
- 4. Havla JB, Pellkofer HL, Meinl I, Gerdes LA, Hohlfeld R, Kümpfel T. Rebound of disease activity after withdrawal of fingolimod (FTY720) treatment. Arch Neurol 69: 262-264, 2012. [DOI] [PubMed] [Google Scholar]
- 5. Hakiki B, Portaccio E, Giannini M, Razzolini L, Pastò L, Amato MP. Withdrawal of fingolimod treatment for relapsing-remitting multiple sclerosis: report of six cases. Mult Scler 18: 1636-1639, 2012. [DOI] [PubMed] [Google Scholar]
- 6. Gross CM, Baumgartner A, Rauer S, Stich O. Multiple sclerosis rebound following herpes zoster infection and suspension of fingolimod. Neurology 79: 2006-2007, 2012. [DOI] [PubMed] [Google Scholar]
- 7. Piscolla E, Hakiki B, Pastò L, Razzolini L, Portaccio E, Amato MP. Rebound after Fingolimod suspension in a pediatric-onset multiple sclerosis patient. J Neurol 260: 1675-1677, 2013. [DOI] [PubMed] [Google Scholar]
- 8. Sempere AP, Berenguer-Ruiz L, Feliu-Rey E. Rebound of disease activity during pregnancy after withdrawal of fingolimod. Eur J Neurol 20: e109-e110, 2013. [DOI] [PubMed] [Google Scholar]
- 9. Beran RG, Hegazi Y, Schwartz RS, Cordato DJ. Rebound exacerbation multiple sclerosis following cessation of oral treatment. Mult Scler Relat Disord 2: 252-255, 2013. [DOI] [PubMed] [Google Scholar]
- 10. Hellmann MA, Lev N, Lotan I, et al. Tumefactive demyelination and a malignant course in an MS patient during and following fingolimod therapy. J Neurol Sci 344: 193-197, 2014. [DOI] [PubMed] [Google Scholar]
- 11. La Mantia L, Prone V, Marazzi MR, Erminio C, Protti A. Multiple sclerosis rebound after fingolimod discontinuation for lymphopenia. Neurol Sci 35: 1485-1486, 2014. [DOI] [PubMed] [Google Scholar]
- 12. Alroughani R, Almulla A, Lamdhade S, Thussu A. Multiple sclerosis reactivation postfingolimod cessation: is it IRIS? BMJ Case Rep 2014: bcr2014206314, 2014. [DOI] [PMC free article] [PubMed] [Google Scholar]
- 13. Faissner S, Hoepner R, Lukas C, Chan A, Gold R, Ellrichmann G. Tumefactive multiple sclerosis lesions in two patients after cessation of fingolimod treatment. Ther Adv Neurol Disord 8: 233-238, 2015. [DOI] [PMC free article] [PubMed] [Google Scholar]
- 14. Berger B, Baumgartner A, Rauer S, et al. Severe disease reactivation in four patients with relapsing-remitting multiple sclerosis after fingolimod cessation. J Neuroimmunol 282: 118-122, 2015. [DOI] [PubMed] [Google Scholar]
- 15. De Masi R, Accoto S, Orlando S, et al. Dramatic recovery of steroid-refractory relapsed multiple sclerosis following Fingolimod discontinuation using selective immune adsorption. BMC Neurol 15: 125, 2015. [DOI] [PMC free article] [PubMed] [Google Scholar]
- 16. Hatcher SE, Waubant E, Nourbakhsh B, Crabtree-Hartman E, Graves JS. Rebound syndrome in patients with multiple sclerosis after cessation of fingolimod treatment. JAMA Neurol 73: 790-794, 2016. [DOI] [PubMed] [Google Scholar]
- 17. Salam S, Mihalova T, Siripurapu R. Severe tumefactive rebound of multiple sclerosis following fingolimod cessation. BMJ Case Rep 2016: bcr2016215596, 2016. [DOI] [PMC free article] [PubMed] [Google Scholar]
- 18. Forci B, Mariottini A, Mechi C, Massacesi L, Repice A. Disease reactivation following fingolimod withdrawal in multiple sclerosis: Two case reports. Mult Scler Relat Disord 15: 24-26, 2017. [DOI] [PubMed] [Google Scholar]
- 19. Członkowska A, Smoliński Ł, Litwin T. Severe disease exacerbations in patients with multiple sclerosis after discontinuing fingolimod. Neurol Neurochir Pol 51: 156-162, 2017. [DOI] [PubMed] [Google Scholar]
- 20. Gündüz T, Kürtüncü M, Eraksoy M. Severe rebound after withdrawal of fingolimod treatment in patients with multiple sclerosis. Mult Scler Relat Disord 11: 1-3, 2017. [DOI] [PubMed] [Google Scholar]
- 21. Lucchinetti CF, Gavrilova RH, Metz I, et al. Clinical and radiographic spectrum of pathologically confirmed tumefactive multiple sclerosis. Brain 131: 1759-1775, 2008. [DOI] [PMC free article] [PubMed] [Google Scholar]
- 22. Visser F, Wattjes MP, Pouwels PJ, Linssen WH, van Oosten BW. Tumefactive multiple sclerosis lesions under fingolimod treatment. Neurology 79: 2000-2003, 2012. [DOI] [PubMed] [Google Scholar]
- 23. Pilz G, Harrer A, Wipfler P, et al. Tumefactive MS lesions under fingolimod: a case report and literature review. Neurology 81: 1654-1658, 2013. [DOI] [PubMed] [Google Scholar]
- 24. Mehling M, Brinkmann V, Antel J, et al. FTY720 therapy exerts differential effects on T cell subsets in multiple sclerosis. Neurology 71: 1261-1267, 2008. [DOI] [PubMed] [Google Scholar]
- 25. Kowarik MC, Pellkofer HL, Cepok S, et al. Differential effects of fingolimod (FTY720) on immune cells in the CSF and blood of patients with MS. Neurology 76: 1214-1221, 2011. [DOI] [PubMed] [Google Scholar]
- 26. Cohen JA, Chun J. Mechanisms of fingolimod's efficacy and adverse effects in multiple sclerosis. Ann Neurol 69: 759-777, 2011. [DOI] [PubMed] [Google Scholar]


