Abstract
The gold standard method for visualizing the pathologies underlying human sensorineural hearing loss has remained post-mortem histology for over 125 years, despite awareness that histological preparation induces severe artifacts in biological tissue. Historically, the transition from post-mortem assessment to non-invasive clinical biomedical imaging in living humans has revolutionized diagnosis and treatment of disease; however, innovation in non-invasive techniques for cellular-level intracochlear imaging in humans has been difficult due to the cochlea’s small size, complex 3D configuration, fragility, and deep encasement within bone. Here we investigate the ability of synchrotron radiation-facilitated X-ray absorption and phase contrast imaging to enable visualization of sensory cells and nerve fibers in the cochlea’s sensory epithelium in situ in 3D intact, non-decalcified, unstained human temporal bones. Our findings show that this imaging technique resolves the bone-encased sensory epithelium’s cytoarchitecture with unprecedented levels of cellular detail for an intact, unstained specimen, and is capable of distinguishing between healthy and damaged epithelium. All analyses were performed using commercially available software that quickly reconstructs and facilitates 3D manipulation of massive data sets. Results suggest that synchrotron radiation phase contrast imaging has the future potential to replace histology as a gold standard for evaluating intracochlear structural integrity in human specimens, and motivate further optimization for translation to the clinic.
OCIS codes: (340.6720) Synchrotron radiation, (170.7440) X-ray imaging, (170.0170) Medical optics and biotechnology, (110.6955) Tomographic imaging, (170.4940) Otolaryngology, (170.6935) Tissue characterization
1. Introduction
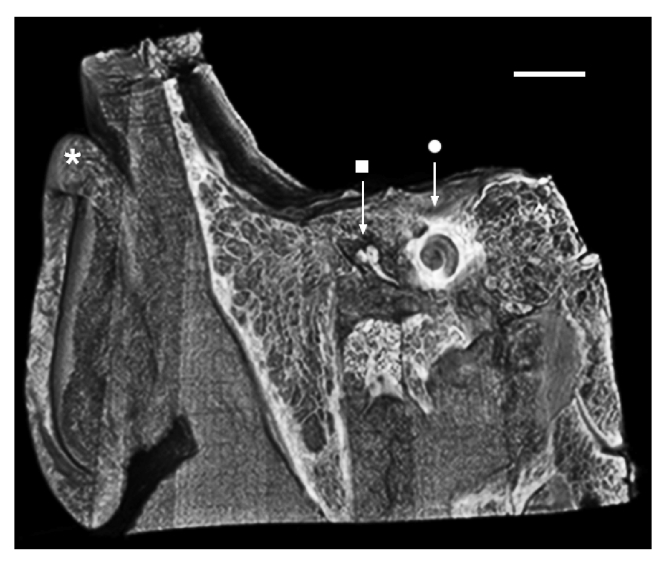
Sensorineural hearing loss (SNHL) is the most common sensory deficit in the world [1], but the mechanisms underlying the progression of SNHL in the human inner ear remain unknown and there is no cure. This void in our understanding of the human peripheral auditory system exists in part due to the lack of a method enabling in vivo or even in situ visualization of the delicate mosaic of micron-scale cells and auditory nerve fibers that facilitate hearing from within the cochlea: the tiny, snail-shaped organ that lies deeply nestled within the densest bone in the human body, the petrous temporal bone’s otic capsule (Fig. 1). Indeed, the cochlea’s small size, fragility, complex three-dimensional (3D) configuration, and deep encasement within bone have precluded visualization of its interior at cellular-level resolution in the intact human temporal bone for the entirety of the auditory research field’s existence.
Fig. 1.
Micro-CT image of the human head, virtually sectioned through the temporal bone to reveal the outer, middle, and inner ear portions of the peripheral auditory system. The cochlea (•)’s spiral shape and deep encasement within bone are appreciated. * = auricle (outer ear); ■ = malleus, first of the three middle ear ossicles. Scale = 2.5cm.
Methods for imaging the cochlea in living humans today are limited to computed tomography (CT) and magnetic resonance imaging (MRI). Standard clinical CT and MRI systems typically afford resolution capabilities in the 0.5mm range [2,3] – over two orders of magnitude lower than what is necessary for resolving diagnostically-relevant detail in the cochlea’s sensory epithelium (the organ of Corti). Thus, CT and MRI are used primarily to detect gross anatomical anomalies in the cochlea (e.g. abnormally small or deformed cochlear bone or missing auditory nerve) [4,5]. More advanced clinical CT (e.g. cone beam, multislice, flat-panel volume) and MRI (histology, 3D fluid attenuation inversion recovery, and constructive interference in steady state) systems resolve down to 70 [6] and 300 microns [7], respectively; these systems afford better visualization of the radius of curvature and inner diameter of the cochlear lumen as it spirals toward its apex, and are thus useful for surgical planning and assessing depth and quality of cochlear implant electrode array insertion. However, the resolving power and penetration depth afforded are still insufficient for visualizing the single-micron scale cells and auditory nerve fibers that are known from studies in animal models to be heavily implicated in SNHL. Importantly, achieving even the aforementioned extent of visibility often requires injecting the patient intravenously with contrast-enhancing agents (e.g. iodine for CT, gadolinium for MRI).
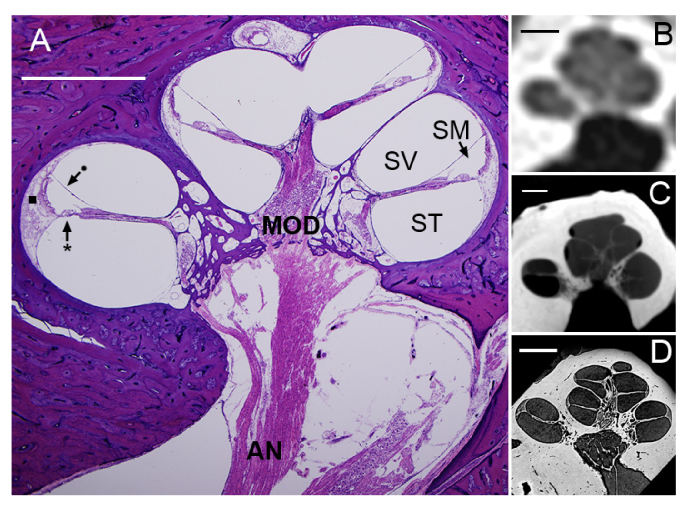
Due to the ironically snail-like pace at which advances in clinical imaging techniques for noninvasive intracochlear evaluation have occurred, the gold standard method for assessing the structural integrity of the human organ of Corti and its association with hearing ability has remained post-mortem temporal bone histology for over 125 years [8] (Fig. 2(A)). This technique involves harvesting the temporal bone at patient autopsy, and subsequently fixing, decalcifying, dehydrating, manually sectioning, staining, and mounting the specimens on glass slides for light microscopic evaluation [9]. This method is crude for several reasons: 1) it introduces artifacts to the tissue at every stage in processing, limiting the evaluator’s ability to distinguish between tissue damaged due to histological preparation versus pathology [10–12]; 2) it is extremely laborious and time-consuming, requiring months to years of preparation before analysis is possible; and 3) it reduces the level of study possible to what is visible along a single orientation plane (3D reconstruction of micro-dissected, stained temporal bone sections has been attempted in the past, but is also extremely labor intensive, and requires expensive equipment [13,14]). These issues are compounded by profound recent evidence from re-analyses of hematoxylin and eosin (H&E)-stained cochlear sections from several patients suggesting that this method of cochlear analysis, which has dominated the field since its nascence, has resulted in significant underestimation of the amount of cellular damage and has thus led to inaccurate conclusions regarding associations between extent and location of intracochlear pathology and hearing ability in the corresponding patient [15]. For the above reasons, the field of temporal bone histopathology, which has contributed critically and extensively to our understanding of hearing loss in humans, is facing extinction. Thus, there is an enormous unmet need for a non-destructive, fast, and cost-effective technique that allows clinicians and researchers to visualize the structural integrity of the organ of Corti at the cellular level and establish accurate correlations between location and degree of damage and cochlear function; such a method would revolutionize the way we diagnose, treat, and study SNHL.
Fig. 2.
(A) Mid-modiolar section of an H&E-stained human cochlea. Five cochlear half-turns, corresponding to the 2 ¾ cochlear turns in the human cochlea, are seen spiraling around the modiolus (MOD), the bony trunk that contains spiral ganglion neuronal cell bodies and axons traveling to and from the auditory nerve (AN). The basilar membrane (*) and Reissner’s membrane (•) define the boundaries between the cochlea’s three fluid-filled lumina: scala tympani (ST), scala media (SM), and scala vestibuli (SV). The lateral wall (■) attaches the basilar membrane to the cochlea’s osseous shell, the otic capsule. Standard CT (B), μCT (C), and SR-PCI (D) images of virtual mid-modiolar sections through a human cochlea in situ are also shown. The differences in visualizability of intracochlear structures across the three X-ray-based imaging modalities are dramatic. All scales = 2mm.
Recent innovations in X-ray imaging promise to yield new methods for intracochlear diagnostic evaluation that would address the aforementioned need. The cochlea has historically resisted X-ray-based techniques such as CT (Fig. 2(B)) and its higher resolution successor, micro-computed tomography (μCT; Fig. 2(C)), because of the highly X-ray-absorbent petrous bone encasing its interior. However, recent harnessing of synchrotron radiation (SR), which provides coherent, collimated X-rays with high photon flux and submicron source stability, has enabled significantly deeper penetration through bone, and thus ultra-high resolution imaging of the organ of Corti [16–22]. The recent integration of phase contrast imaging (PCI) with SR-facilitated X-ray imaging enables enhanced soft tissue contrast in tandem with strong absorption contrast in bone by a) transforming the sample-induced phase shift into detectable variations in X-ray intensity, and b) enhancing contrast at boundaries between individual structures within the field of view. Importantly, synchrotron radiation phase contrast imaging (SR-PCI) far surpasses standard optical microscopy techniques in the range over which it can image in depth; SR-PCI can image up to centimeters in depth, while optical techniques typically afford less than a millimeter. Studies implementing synchrotron radiation phase contrast imaging have demonstrated this technique’s ability to reveal the organ of Corti’s cytoarchitecture in situ in unprecedented levels of detail; structures such as the basilar membrane, spiral ligament and stria vascularis, spiral ganglion cell bodies and nerve fibers, and Reissner’s membrane have been resolved despite being imaged in situ in the temporal bone (Fig. 2(D)) [16–21].
While these studies are promising, most have relied on sample decalcification and staining to significantly enhance contrast [19–22], and many of the experiments were performed in animal cochleae [21,22]. An impressive amount of structural detail has been previously resolved in samples that were fixed and dehydrated only [16,17], but these data were not prepared or presented in ways that facilitate easy detection of intracochlear sensorineural pathologies or comparison with histology [16–19,21,22].
Here, we demonstrate the power of SR-PCI combined with analysis through a commercially available software package to provide profoundly detailed 3D images of the non-decalcified, unstained human cochlea’s interior in situ. Our objectives were to demonstrate a) SR-PCI’s ability to distinguish between damaged and healthy organ of Corti tissue, and b) the minimal effect of sample dehydration on image quality. These data demonstrate SR-PCI’s potential to accelerate the discovery of the microstructural basis of human deafness by enabling rapid, thorough assessment of intact, non-decalcified, unstained human temporal bone specimens.
2. Materials and methods
2.1 Specimen preparation
Human temporal bones were harvested at autopsy from patient donors. Post-extraction, specimens were processed for imaging in one of two ways:
-
1)
A fresh specimen was fixed in 10% formalin for 2 weeks and the surrounding petrous bone was drilled to expose the round and oval windows. Post-fixation, a soft tube of roughly the same flexibility as a cochlear implant electrode array (outer diameter = 580μm) was repeatedly inserted into scala tympani to a depth of roughly 10mm to mimic insertion trauma.
-
2)
Three fresh-frozen specimens were cylindrically trimmed to a diameter of 40mm and length of 60mm around the cochlea, and were fixed in a 4F1G (3.7% formaldehyde + 1% glutaraldehyde in phosphate buffer) bath for 5 days. The samples were rinsed twice in double distilled water, and subsequently dehydrated according to an eight-stage ethanol series (50%, 60%, 70%, 80%, 90%, 95%, 100%, and 100%). In each stage, the samples were submerged in 300mL of solution for 30 minutes.
No additional processing (e.g. decalcification, staining, sectioning) was performed in any specimens. The Massachusetts Eye and Ear Human Studies Committee and Western University permitted use of these specimens for research purposes.
2.2 SR-PCI image acquisition
The SR-PCI technique implemented in these experiments (SR combined with propagation-based PCI) has been previously described [16,17].
In brief, specimens were scanned using the Biomedical Imaging and Therapy (BMIT) 05ID-2 beamline at the Canadian Light Source Inc. in Saskatoon, SK, Canada. The SR beam is produced by a superconducting wiggler source [23] and is filtered using a monochromator, yielding an energy bandwidth of ΔE/E ≈10−3 over a 30-150 keV range. Samples were imaged at 40 keV; the photon flux delivered to the imaging station at this energy is about 5 × 10¹⁰ phot/sec/mm2. The imaging station, located 58 meters from the source, comprises a motorized stage and an X-ray detector that consists of a 10 µm-thick Gadox scintillator screen and a tandem objective system that relays a luminescence image to a charge-coupled device camera (C9300-124, Hamamatsu Photonics, Shizuoka, Japan) without magnification. The imaging field of view is 36 × 8.6 mm2 and effective pixel size is 9 × 9 μm2. The sample-detector distance is 2 meters.
For high-resolution tomography, 3000 angular projections were acquired over 180° of sample rotation (amounting to a total cylindrical volume of 486.3 mm3 for a single “view”). Acquisition time per view was roughly 30 minutes; multiple views were acquired if the region of interest exceeded the vertical size of the X-ray beam (8.6 mm).
2.3 Experimental setup and image analysis
During SR-PCI, specimens were firmly fixed to the motorized sample stage in the imaging station. The acquisition field of view was optimized for imaging the cochlea within the temporal bone through fine adjustment of the sample’s position in X, Y, and Z directions.
SR-PCI images were reconstructed in NRecon (Bruker MicroCT, Kontich, Belgium) and the resulting two-dimensional (2D) grayscale images were converted into tagged image file format (.tif). When multiple views were acquired for a single specimen, 2D images were stitched together along the z-axis using Fiji [24]. 2D image stacks were then imported into OsiriX (Pixmeo SARL, Bernex, Switzerland), a software program routinely used by medical practitioners to visualize clinical CT and MRI data. Multiplanar reconstruction and volumetric rendering were performed in OsiriX to visualize the SR-PCI images in 3D, generate maximum intensity projections, rotate, enlarge, and crop the images, set image opacity, and generate scale bar measurements. Image brightness and contrast were adjusted and schematics were drawn in Adobe Photoshop (Adobe, Inc., San Jose, CA). 3D volumetric SR-PCI “fly-through” videos (10 frames per second) were rendered using an endoscopy perspective in OsiriX.
3. Results and discussion
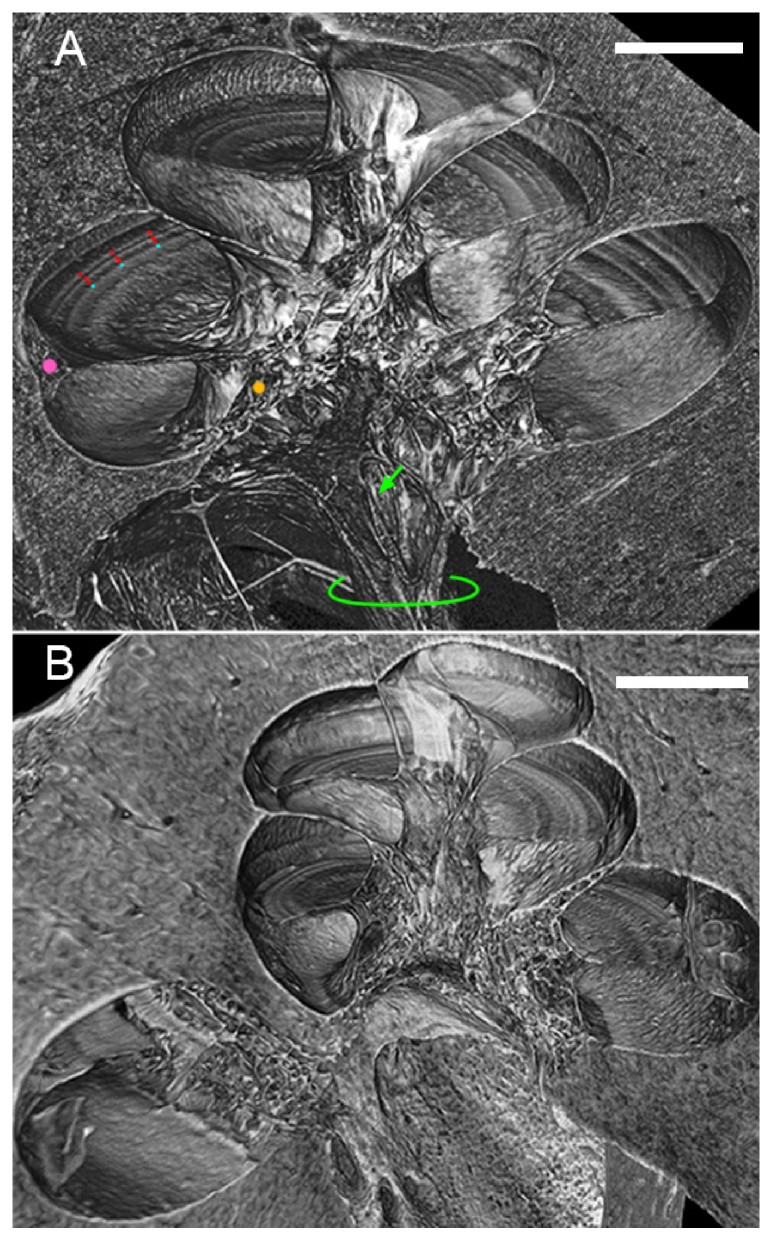
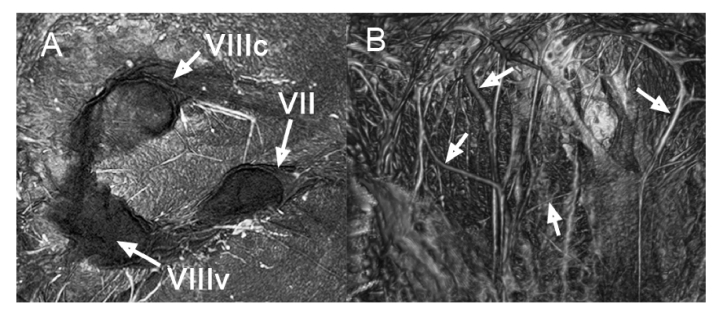
Virtual sectioning of the human temporal bone reveals micron-scale cytoarchitecture within the cochlea in unprecedented levels of detail for an entirely intact, unstained specimen (Fig. 3). Mid-modiolar virtual sections through dehydrated (Fig. 3(A)) and non-dehydrated (Fig. 3(B)) specimens are tilted in 3D toward the viewer to reveal both surface and cross-sectional views of the organ of Corti in a single image. The three rows of outer hair cells and single row of inner hair cells are clearly visualized in their fan-shaped pattern as they spiral toward the cochlear apex, as are the region of supporting cells and the spiral limbus. Scala tympani, the intracochlear lumen through which electrode arrays are inserted during cochlear implantation, is well-defined. The facial nerve, two trunks of the vestibulocochlear nerve, individual spiral ganglion nerve fiber bundles, and branches of the labyrinthine artery are striking in the basal region of the modiolus (Fig. 3(A), Fig. 4, Visualization 1 (5MB, mp4) ); spiral ganglion nerve fibers are also seen traveling through the osseous spiral lamina to where they synapse at inner and outer hair cells (Fig. 3(A)). Rosenthal’s canal, the tunnel that contains spiral ganglion neuron cell bodies, is also visualized.
Fig. 3.
(A) Mid-modiolar 3D virtual cross-section through the dehydrated human cochlea. Three rows of outer hair cells (red dots), one row of inner hair cells (blue dots), the region of the spiral ligament and stria vascularis (pink dot), and Rosenthal’s canal (orange dot) are clearly visualized. Individual bundles of spiral ganglion neuronal fibers (green arrow) and the auditory nerve trunk (green outline) are also visualized. (B) Mid-modiolar 3D virtual cross-section through the non-dehydrated human cochlea, illustrating that similar visualization is achieved through dehydration and fixation without dehydration. Lateral wall is damaged in (B) due to simulated poor electrode array insertion. Both scales = 1mm.
Fig. 4.
Endoscopic still images allowing clear visualization of the internal auditory meatus’ contents in a right ear, highlighting the facial nerve (VII) and two trunks of the vestibulocochlear nerve (VIIIc, VIIIv; (A), and bundles of nerve fiber axons and branches of the labyrinthine artery (B); white arrows). VIIIc = cochlear branch; VIIIv = vestibular branch. Figure corresponds to Visualization 1 (5MB, mp4) .
When comparing visualization quality in dehydrated (Fig. 3(A)) versus non-dehydrated (Fig. 3(B)) temporal bone specimens, it is evident that dehydration yields slightly better results; this is consistent with previous work demonstrating that dehydration improves soft-tissue contrast in absorption-based μCT imaging [19]. However, regions, and in some cases individual structures, of relevance to SNHL are still visualized in the non-dehydrated specimen, motivating further optimization of SR-PCI imaging parameters to allow for maintenance of as much specimen purity as possible.
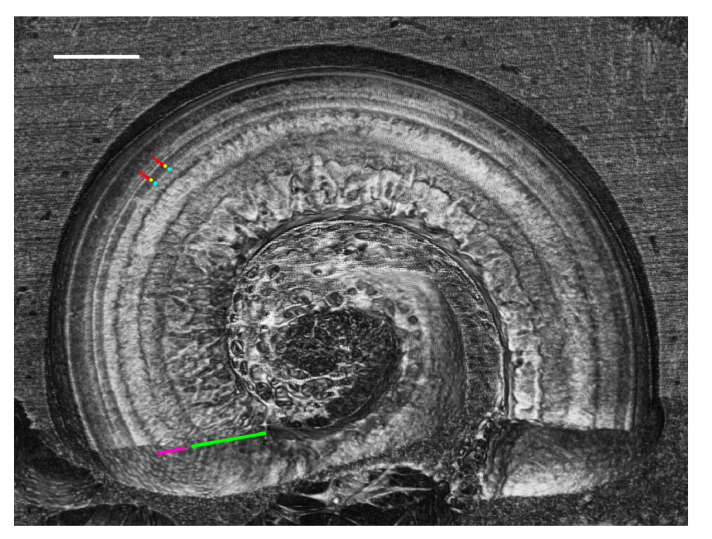
Virtual whole mounts providing a clear surface view of the organ of Corti were prepared by sectioning along a plane parallel to the organ of Corti (Fig. 5 ). The full cytoarchitecture of the organ of Corti is visualized in this virtual cross-section, from the modiolar core to the region of outer supporting cells and the lateral wall. This viewing orientation in combination with the amount of visible cellular-level detail is impossible to achieve even through 3D reconstruction of histological micro-sections of the human temporal bone, as slice thickness limits resolution in the z-dimension [13]. These data support our method as the first, to our knowledge, to facilitate cellular-level visualization of the cochlea along an infinite number of cross-sectional planes in the unstained, non-decalcified, 3D intact human temporal bone.
Fig. 5.
3D virtual whole mount section revealing a surface view of the organ of Corti in situ in the temporal bone using SR-PCI. The complex cytoarchitecture of the organ of Corti, including the three rows of outer hair cells (red dots), single row of inner pillar cells (yellow dot), single row of inner hair cells (blue dot), spiral limbus (pink underline), and fan of auditory nerve fiber bundles (green underline) is clearly visualized. Scale = 1mm.
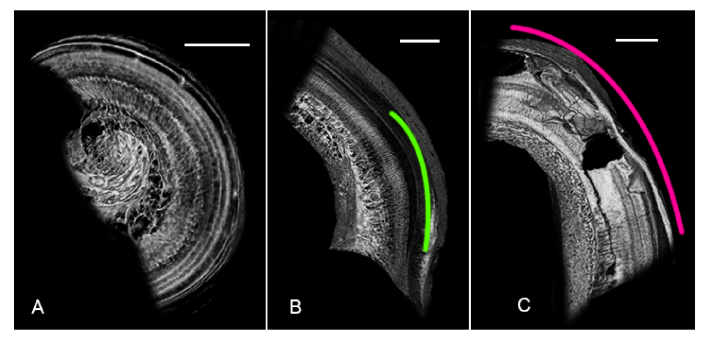
Different organ of Corti regions were virtually sectioned to illustrate the degrees and types of pathology that SR-PCI is capable of detecting (Fig. 6). Figure 6(A) shows healthy organ of Corti tissue, virtually sectioned from the upper basal-to-middle turn; as in previous figures, rows of hair cells and supporting cells and nerve fiber bundles are clearly visualized.
Fig. 6.
Virtual whole mounts of three regions of the human organ of Corti, illustrating SR-PCI’s ability to distinguish between healthy (A) and damaged (B, C) tissue. (A) SR-PCI virtual whole mount sectioned from the upper basal-to-middle turn; individual rows of hair cells and the fan of auditory nerve fibers are clearly visible. (B) SR-PCI virtual whole mount sectioned from the base; hypothesized region of presbycusis is outlined in green. (C) SR-PCI virtual whole mount sectioned from the base of a cochlear specimen which had undergone simulated insertion trauma (pink outline). All scales = 1mm.
Figure 6(B) shows the hook region of one cochlear specimen, where damage manifests as a dark region covering what was measured to be a length of roughly 3.5mm. The entire length of the organ of Corti was measured in this specimen and a modified Greenwood function [25,26] was applied to estimate the frequency range corresponding to the region of damage. The damaged band spans frequencies to roughly the 13kHz region of the cochlea. Given the natural progression of cellular damage visible in the tissue morphology, the elderly age of the temporal bone donor, and the typical clinical presentation of age-related hearing loss, or presbycusis, we hypothesize that this damage is characteristic of an early stage of presbycusis. Figure 6(C) shows the hook region from the specimen that underwent simulated insertion trauma. Complete perforation and severe tissue damage in the basilar membrane and lateral wall were seen in the SR-PCI scan of this specimen ( Fig. 6C ). Fig. 6 demonstrates SR-PCI’s ability to distinguish across varying degrees of tissue health/damage at the cellular level in the 3D intact human temporal bone.
An endoscopic “fly-through” video was created to enable visualization of the cochlea’s interior from within the cochlea and in 3D (Fig. 7, Visualization 2 (4.3MB, mp4) ). This method of visualization motivates the development of instructional tools that help the viewer fully understand and appreciate the cochlea’s complex 3D geometry and internal cellular structure.
Fig. 7.
Still images acquired at three different time points (A, B, C) in an endoscopic “fly-through” video (Visualization 2 (4.3MB, mp4) ) allowing the viewer to fly into scala vestibuli to view the cochlea’s interior in 3D from within.
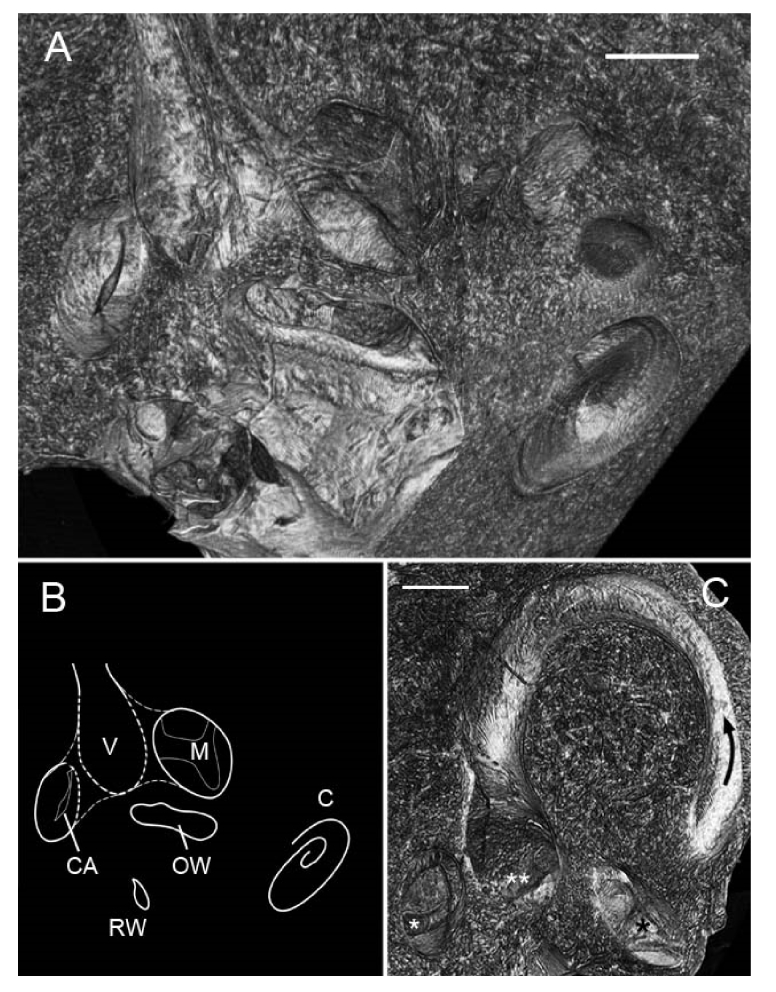
In one specimen, the entire inner ear including vestibular (balance) organs and the cochlea was imaged across three different views in order to assess SR-PCI’s ability to resolve the vestibular system’s sensory epithelia. Fig. 8 shows a 3D volumetric reconstruction of the region of the temporal bone containing the vestibular organs; the stack was virtually sectioned along several planes to show cross-sections through multiple structures at once, including the ampullae of the superior and posterior semicircular canals and their internal cristae ampullaris, and the utricular macula. The superior semicircular canal (SSC) is also striking in this orientation (Fig. 8(C)), and a corresponding fly-through video (Visualization 3 (5.9MB, mp4) ) highlights the location and orientation of the SSC and three proximal sensory epithelia. Cellular-level structural detail was not visible in the vestibular epithelia; we hypothesize that this is because a) the cells here are surrounded by a gelatinous cupula that may have affected X-ray penetration to these cells, b) the sensory epithelium itself is significantly more uniform in its cellular organization than the cochlea’s organ of Corti, and thus phase contrast-mediated edge enhancement effects were not as strong for these structures, or c) the epithelium had simply deteriorated over time or through fixation. The discovery that SR-PCI resolves the human vestibular system’s sensory epithelia in situ and without any specimen manipulation aside from fixation unlocks doors to entire fields of study that are difficult to explore with today’s histological methods. Falls are the leading cause of death in the elderly and are often caused by vestibular dysfunction, yet extremely little is known about the changes in vestibular organ morphology that are associated with symptoms of the variety of vestibular disorders that people commonly experience.
Fig. 8.
3D volumetric analysis of the vestibular organs in a right human temporal bone. (A) Bone was virtually sectioned along several planes to reveal two of the vestibular system’s sensory epithelia. A schematic orienting the reader to these structures is in panel (B). V = vestibule; M = utricular macula; C = cochlea; OW = oval window; RW = round window; CA = crista ampullaris (posterior ampulla). (C) Still image highlighting the vestibular structures seen in Visualization 3 (5.9MB, mp4) ; the black arrow indicates the position and orientation of the superior semicircular canal; double white asterisks mark the utricular macula; single white asterisk marks the crista ampullaris of the posterior ampulla; single black asterisk marks the crista ampullaris of the superior ampulla. Scales = 0.5mm.
4. Conclusions
Our data demonstrate that synchrotron radiation X-ray imaging in combination with phase detection algorithms for edge enhancement enables visualization of the cochlea’s organ of Corti at cellular level resolution in the 3D intact, unstained, non-decalcified human temporal bone. The method of imaging and analysis described here has the potential to revolutionize and accelerate the study and diagnosis of human inner ear pathologies, as it promises to replace traditional histologic sectioning and staining as the gold standard method for human organ of Corti evaluation and disease diagnosis. As the field of human temporal bone histopathology approaches extinction [27], the present and related studies promise to rejuvenate this critically important branch of translational research. Future work should aim to a) further optimize SR-PCI parameters for intracochlear evaluation and vestibular organ assessment, b) further improve resolution such that SR-PCI-enabled structural visualization approaches histology-level quality, and c) identify ways to minimize radiation energy so that this technology can be translated to the clinic.
Acknowledgements
This work was supported by NIH grant R01DC015824 (K.M.S), the Nancy Sayles Day Foundation (K.M.S.), the Lauer Tinnitus Research Center (K.M.S.), the Department of Defense National Defense Science and Engineering Graduate Fellowship (J.S.I), the Canada Foundation for Innovation, the Natural Sciences and Engineering Research Council of Canada, the Natural Research Council Canada, the Canadian Institutes of Health Research, the government of Saskatchewan, Western Economic Diversification Canada, and the University of Saskatchewan (BMIT, Canadian Light Source, Inc.) (N.Z., S.G., S.K.A., H.M.L).
The authors thank Jennifer O’Malley at the Massachusetts Eye and Ear Otopathology Laboratory for providing histology slides, and Katarina Bojkovic for reviewing the relevant literature.
Funding
NIH (R01DC015824); Nancy Sayles Day Foundation; the Lauer Tinnitus Research Center; Department of Defense National Defense Science and Engineering Graduate Fellowship; the Canada Foundation for Innovation, the Natural Sciences and Engineering Research Council of Canada; the Natural Research Council Canada; the Canadian Institutes of Health Research; the government of Saskatchewan; Western Economic Diversification Canada, and the University of Saskatchewan (BMIT, Canadian Light Source, Inc.).
Disclosures
The authors declare that there are no conflicts of interest associated with this work.
References and links
- 1.World Health Organization Fact Sheet, “Deafness and hearing loss,” (World Health Organization, 2017), http://www.who.int/mediacentre/factsheets/fs300/en/
- 2.Ali D., Chatziioannou A. F., Basic Sciences in Nuclear Medicine, (Springer-Verlag, 2011). [Google Scholar]
- 3.Nekolla S. G., Saraste A., Cardiac CT, PET, and MR (Wiley-Blackwell, 2010). [Google Scholar]
- 4.Yiin R. S. Z., Tang P. H., Tan T. Y., “Review of congenital inner ear abnormalities on CT temporal bone,” Br. J. Radiol. 84(1005), 859–863 (2011). 10.1259/bjr/18998800 [DOI] [PMC free article] [PubMed] [Google Scholar]
- 5.Liu C., Bu X., Wu F., Xing G., “Unilateral auditory neuropathy caused by cochlear nerve deficiency,” Int. J. Otolaryngol. 2012, 1 (2012). 10.1155/2012/914986 [DOI] [PMC free article] [PubMed] [Google Scholar]
- 6.Pearl M. S., Roy A., Limb C. J., “High-resolution secondary reconstructions with the use of flat panel CT in the clinical assessment of patients with cochlear implants,” AJNR Am. J. Neuroradiol. 35(6), 1202–1208 (2014). 10.3174/ajnr.A3814 [DOI] [PMC free article] [PubMed] [Google Scholar]
- 7.van Egmond S. L., Visser F., Pameijer F. A., Grolman W., “Ex vivo and in vivo imaging of the inner ear at 7 Tesla MRI,” Otol. Neurotol. 35(4), 725–729 (2014). 10.1097/MAO.0000000000000276 [DOI] [PubMed] [Google Scholar]
- 8.Politzer A., The Anatomical and Histological Dissection of the Human Inner Ear: in the Normal and Diseased Condition (Baillière, Tindall and Cox, 1892). [Google Scholar]
- 9.Merchant S. N., Nadol J. B., Schuknecht’s Pathology of the Ear (Lea and Febiger, Malvern, 1993). [Google Scholar]
- 10.Brown M. A., Reed R. B., Henry R. W., “Effects of dehydration mediums and temperature on total dehydration time and tissue shrinkage,” J. Int. Soc. Plastination. 33, 28–33 (2002). [Google Scholar]
- 11.Brunschwig A. S., Salt A. N., “Fixation-induced shrinkage of Reissner’s membrane and its potential influence on the assessment of endolymph volume,” Hear. Res. 114(1-2), 62–68 (1997). 10.1016/S0378-5955(97)00153-6 [DOI] [PubMed] [Google Scholar]
- 12.Chatterjee S., “Artefacts in histopathology,” J. Oral Maxillofac. Pathol. 18(4), S111–S116 (2014). 10.4103/0973-029X.141346 [DOI] [PMC free article] [PubMed] [Google Scholar]
- 13.Li S. F., Zhang T. Y., Wang Z. M., “An approach for precise three-dimensional modeling of the human inner ear,” ORL J. Otorhinolaryngol. Relat. Spec. 68(5), 302–310 (2006). 10.1159/000094378 [DOI] [PubMed] [Google Scholar]
- 14.Rau T. S., Würfel W., Lenarz T., Majdani O., “Three-dimensional histological specimen preparation for accurate imaging and spatial reconstruction of the middle and inner ear,” Int. J. CARS 8(4), 481–509 (2013). 10.1007/s11548-013-0825-7 [DOI] [PMC free article] [PubMed] [Google Scholar]
- 15.Liberman M. C., “The auditory nerve in profoundly deaf ears,” presented at the Association for Research in Otolaryngology, San Diego, CA, USA, 9–14 Feb. 2018. [Google Scholar]
- 16.Elfarnawany M., Alam S. R., Rohani S. A., Zhu N., Agrawal S. K., Ladak H. M., “Micro-CT versus synchrotron radiation phase contrast imaging of human cochlea,” J. Microsc. 265(3), 349–357 (2017). 10.1111/jmi.12507 [DOI] [PubMed] [Google Scholar]
- 17.Koch R. W., Elfarnawany M., Zhu N., Ladak H. M., Agrawal S. K., “Evaluation of cochlear duct length computations using synchrotron radiation phase-contrast imaging,” Otol. Neurotol. 38(6), e92–e99 (2017). 10.1097/MAO.0000000000001410 [DOI] [PubMed] [Google Scholar]
- 18.Agrawal S., Schart-Morén N., Liu W., Ladak H. M., Rask-Andersen H., Li H., “The secondary spiral lamina and its relevance in cochlear implant surgery,” Ups. J. Med. Sci. 123(1), 9–18 (2018). 10.1080/03009734.2018.1443983 [DOI] [PMC free article] [PubMed] [Google Scholar]
- 19.Lareida A., Beckmann F., Schrott-Fischer A., Glueckert R., Freysinger W., Müller B., “High-resolution X-ray tomography of the human inner ear: synchrotron radiation-based study of nerve fibre bundles, membranes and ganglion cells,” J. Microsc. 234(1), 95–102 (2009). 10.1111/j.1365-2818.2009.03143.x [DOI] [PubMed] [Google Scholar]
- 20.Vogel U., “New approach for 3D imaging and geometry modeling of the human inner ear,” ORL J. Otorhinolaryngol. Relat. Spec. 61(5), 259–267 (1999). 10.1159/000027683 [DOI] [PubMed] [Google Scholar]
- 21.Rau C., Hwang M., Lee W. K., Richter C. P., “Quantitative X-ray tomography of the mouse cochlea,” PLoS One 7(4), e33568 (2012). 10.1371/journal.pone.0033568 [DOI] [PMC free article] [PubMed] [Google Scholar]
- 22.Richter C. P., Young H., Richter S. V., Smith-Bronstein V., Stock S. R., Xiao X., Soriano C., Whitlon D. S., “Fluvastatin protects cochleae from damage by high-level noise,” Sci. Rep. 8(1), 3033 (2018). 10.1038/s41598-018-21336-7 [DOI] [PMC free article] [PubMed] [Google Scholar]
- 23.Wysokinski T. W., Chapman D., Adams G., Renier M., Suortti R., Thomlinson W., “Beamlines of the biomedical imaging and therapy facility at the Canadian light source – part 3,” Nucl. Instrum. Methods Phys. Res. A 775, 1–4 (2015). 10.1016/j.nima.2014.11.088 [DOI] [Google Scholar]
- 24.Schindelin J., Arganda-Carreras I., Frise E., Kaynig V., Longair M., Pietzsch T., Preibisch S., Rueden C., Saalfeld S., Schmid B., Tinevez J. Y., White D. J., Hartenstein V., Eliceiri K., Tomancak P., Cardona A., “Fiji: an open-source platform for biological-image analysis,” Nat. Methods 9(7), 676–682 (2012). 10.1038/nmeth.2019 [DOI] [PMC free article] [PubMed] [Google Scholar]
- 25.Greenwood D. D., “Audtory masking and the critical band,” J. Acoust. Soc. Am. 33(4), 484–502 (1961). 10.1121/1.1908699 [DOI] [Google Scholar]
- 26.Greenwood D. D., “Critical bandwidth and the frequency coordinates of the basilar membrane,” J. Acoust. Soc. Am. 33(10), 1344–1356 (1961). 10.1121/1.1908437 [DOI] [Google Scholar]
- 27.Chole R. A., McKenna M. J., “A silent and imminent threat,” The Registry 20(2), 1–2 (2012). [Google Scholar]


