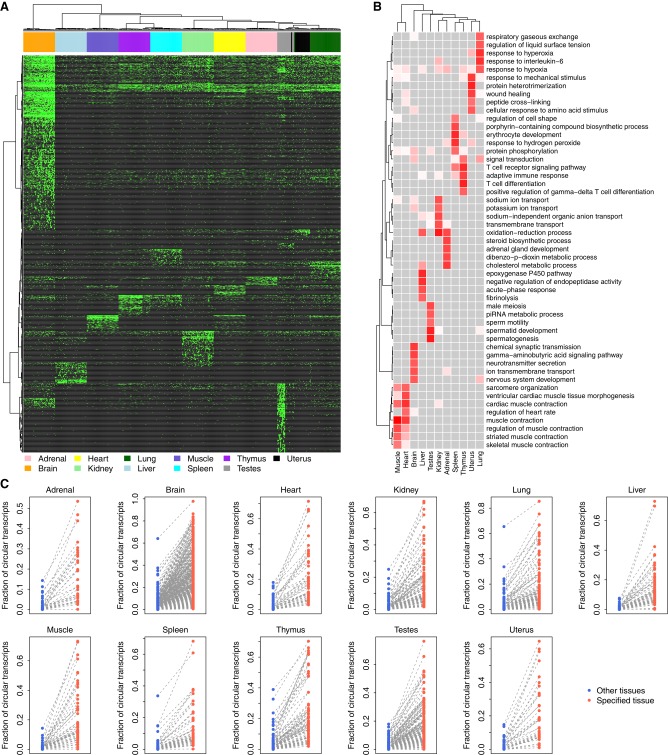
FIGURE 4.
Map of tissue-specific circRNAs. (A) Hierarchical clustering of tissue-specific circRNAs. Each green dot represents one expressed tissue-specific circRNA. (B) The top GOBP terms associated with the host genes of the tissue-specific circRNAs. For each tissue type, the top five GOBP terms are listed. The association between the GOBP terms and tissue-specific circRNAs was measured based on the Z-score calculated from Fisher's exact test. Darker red indicates a stronger association, while lighter red indicates a weaker association. Gray indicates no association. (C) Fraction of circular transcripts of tissue-specific circRNAs. Each dot represents one tissue-specific circRNA.

