Abstract
Chemical tools are needed to discover new effective drugs for tackling multifaceted complex neurodegenerative diseases like Alzheimer’s disease (AD). Multifunctional nature of two compounds, 5-((4-nitro-phenyl)diazenyl)quinolin-8-ol (HL1) and 4-((4-nitrophenyl)diazenyl)benzene-1,3-diol (HL2) is reported w.r.t. their ability to bind Cu2+ ions and amyloid aggregates related to AD. HL1 and HL2 have half congo-red type azo-stilbene structural framework incorporated with metal chelating groups, designed to chelate metal ions from metal-amyloid species. Metal binding studies of HL1 and HL2 are established by the methods of Job’s Plot, UV-vis spectra with metal ions and stability constant determination. In addition, their metal complexes are isolated, purity checked by elemental analysis, spectroscopically characterized and their structural analyses were obtained from DFT based calculations including binding energy determination. Chicken egg white Lysozyme (CEWL) was used as a model peptide for fibrillation studies. HL1 is found as an excellent colorimetric sensor for amyloid fibrils. Inhibitory effect of HL1 and HL2 and their isolated metal complexes L1-Cu and L2-Cu on CEWL fibrillation was studied using ThT and ANS fluorescence assay along with TEM imaging. In addition, the cell toxicity studies on these compounds suggest that although azo dyes may be non-toxic but having a nitro-substitution lead to significant cell toxicity. Overall, these results suggest that this new class of multifunctional small molecules can interact with amyloids as well as metal ions and could be potential anti-aggregation metal chelating agents.
1. Introduction
Aetiology of Alzheimer’s disease (AD) is still poorly understood [1]. AD is recognized as a multi-faceted disorder in which the patient brain shows protein misfolding and aggregation [2]. It has been established that there are several factors responsible for the neurodegeneration among which the role of metal ions have caught especial attention [1b,2b,3]. Studying the role of metal ions is also a challenging research topic [4]. Oxidative stress and free radical formation and role of metal ions like Cu and Fe in these processes is strongly indicated in recent research [4,5]. Therefore, inorganic chemistry of biological systems with special emphasis on metal ion dyshomeostasis in neurodegenerative diseases has been stimulated greatly in recent years [3a,3c,6].
Individuals with neurodegenerative diseases can be benefited by developing multifunctional drugs which can target multiple problems [7]. Understanding of some of the common structural and pathogenic features of these diverse protein aggregation processes may provide more effective therapeutic approaches. Chemical tools and novel chemical agents are high in demand that can deplete the monomeric precursor proteins, inhibiting their aggregation, enhancing clearance and block the common aggregation-induced pathways leading to cellular toxicity. Use of smart metal chelators for developing effective AD therapeutics has received special attention in medicinal research [1b,3c,8]. These so called multifunctional compounds (MFCs) comprises of two or more following properties: (i) reducing the aggregation of peptides into amyloid plaques and oligomers, (ii) recognizing the site of binding and selectively chelate metal ions and control their redox properties; (iii) ability to act as antioxidants; (iv) acetylcholinesterase inhibition; (v) anti-inflammatory activity, etc. [2c,6b,7a,9]. These MFCs are expected to be more efficient and potential neuroprotective disease-modifying drugs [10]. However, one limiting factor with these molecules is entering in human brain crossing through blood brain barrier (BBB) [9,11]. Molecules with a good balance of hydrophobic/hydrophilic properties are suggested to have better chance of clearing BBB.
A number of bifunctional chelators have recently been reported from various groups (Fig. 1) [2c,3c,7a,9]. 8-hydroxy-quinoline, clioquinol, ThT and stilbene frameworks have been utilized for the construction of novel metal chelators that can have amyloid interaction [2c,3c,6b,7a,9,12]. A range of benzothiazole and stilbene compounds bind with some extent of selectivity to amyloid aggregates [6b,13]. Despite these reports, this field of multifunctional chelator design is still new and numerous opportunities exist to improve the design of new such small molecules [3c,8].
Fig. 1.
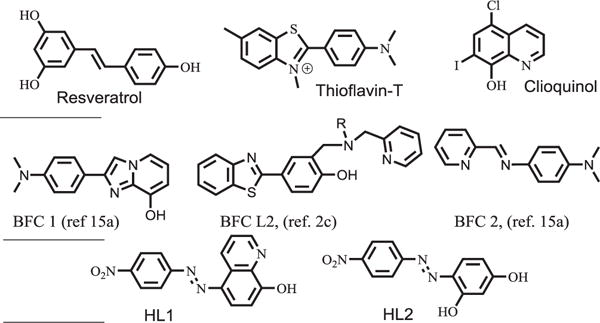
(Top) Molecular structure of resveratrol, Thioflavin-T and Clioquinol; (Middle) Structures of selective bifunctional chelators recently reported; and (Bottom) Structure of HL1 and HL2, multifunctional molecules studied in this work.
Congo-Red (CR), an azo-dye, is currently treated as the gold standard for amyloid detection and aimed for detecting amyloids in early stages of AD [14]. We have started to design and construct several new aza- and azo-stilbene derivatives and developing these molecules into metal chelators to form multifunctional compounds (Fig. 1). The use of azo-stilbene framework has perhaps also originated from resveratrol and subsequent modifications led to aza-stilbene type framework modified into metal chelators [15]. CR has been indicated to be useful for early stage neurotoxic oligomers and detection of early symptoms of AD [16]. However, to the best of our knowledge, multifunctional compounds based on azo-dyes or CR has not been used in the context of metal chelation from metal-amyloid species. Metal chelating properties in combination with these amyloid binding features are expected to lead to interesting new multifunctional compounds.
In this report, we used two simple bi-dentate metal chelators HL1 and HL2 (Fig. 1), their synthesis, isolation of their Cu complexes and amyloid interaction properties are investigated. Interestingly, these compounds exhibit amyloid-metal dual affinity as well as inhibitory effect on chicken egg white (CEWL) fibrilization.
2. Experimental
2.1. General
All reagents were purchased from commercial sources and used as received unless stated otherwise. Solvents were purified by distillation prior to use. 4-(phenyldiazenyl)phenol was obtained from Sigma Aldrich. 4-(phenyldiazenyl)benzene-1,3-diol and 5-(phenyldiazenyl)quinolin-8-ol were prepared following a literature procedure [17]. All aqueous solutions and buffers were prepared using commercially available distilled water. 1H and 13C NMR spectra were recorded on a BRUKER-500 spectrometer (500 MHz). Chemical shifts (δ) are reported in ppm. The UV–visible spectra were recorded on a Carry-100 UV–Visible Spectrophotometer and data are reported as λmax (nm) absorbance. FT-IR spectra were recorded on PerkinElmer FT-IR Spectrum-Two model using KBr. The melting/decomposition points were determined in house by placing a finely powdered sample in a glass capillary and heating by using BUCHI digital melting point apparatus. High-resolution mass spectra were recorded on XEVO G2-S QT of Waters Corporation, USA at MNIT, Jaipur.
2.2. Synthesis of ((4-nitrophenyl)diazenyl)quinolin-8-ol (HL1)
A slightly modified method than reported was used [18]. To a flask containing 4-nitroaniline (1 g, 7.24 mmol) was added a solution of 1:1 concentrated HCl (5 mL) and distilled water (5 mL). It was cooled down to 0–5 °C using an ice-bath and a cold aqueous solution of NaNO2 (1 g, 14.48 mmol) was added to it drop by drop with constant stirring. The resulting solution was stirred for 30 min and colour changed from dark brown to violet, probably due to formation of intermediate diazonium chloride salt. A solution of 8-hydroxyquinoline (1.05 g, 7.24 mmol) in the mixture of methanol (2 mL) and NaOH (10% w/v, 8 mL) was added to above diazonium salt solution while maintaining the temperature at 0–5 °C. The resulting dark violet solution was stirred for 1 h and then acidified with few drops of conc. HCl to obtain a red colour precipitate. It was filtered and dried over high vacuum (1.61 g, yield 75%). 1H NMR (500 MHz, DMSO d6/CDCl3): δ 9.37 (br, s, 1H), 8.98 (d, 1H), 8.60–8.00 (m, 5H), 7.90–7.65 (m, 1H), 7.50–7.10 (m, 1H). FT-IR (KBr): 3448, 3199, 1560, 1385, 1265. UV–vis, MeOH, λmax, nm, (ε, M−1 cm−1): 418 (14,000). Melting Point: 275–278 °C. HRMS: Calcd for [M + H]+, 295.0831; Found, 295.0842.
2.3. Synthesis of 4-((4-nitrophenyl)diazenyl)benzene-1,3-diol (HL2)
To a flask containing 4-nitroaniline (1 g, 7.24 mmol) was added solution of 1:1 concentrated HCl (5 mL) and distilled water (5 mL). It was cooled down to 0–5 °C using an ice-bath and a cold aqueous solution of NaNO2 (1 g, 14.48 mmol) was added to it drop by drop with constant stirring. The resulting solution was stirred for 1 h, colour changed from dark brown to violet, probably due to formation of intermediate diazonium chloride salt. A solution of resorcinol (0.7 g, 7.17 mmol) in the mixture of methanol (2 mL) and NaOH (10% w/v, 8 ml) was added to the above diazonium salt solution while maintaining the temperature at 0–5 °C. The resulting dark violet solution was stirred for 1 h. A few drops of conc. HCl were added which led to the formation of a red colour precipitate. Precipitate was filtered off, dried on high vacuum (1.21 g, yield 65%). 1H NMR (500 MHz, CDCl3) δ(ppm): 8.35 (d, J = 8.6 Hz, 2H), 7.89 (d, J = 8.6 Hz, 2H), 7.74 (d, J = 8.8 Hz, 1H), 6.62 (d, J = 7.5 Hz, 1H), 6.43 (s, 1H). 13C NMR (125 MHz, CDCl3) δ(ppm): 163.4, 158.9, 153.5, 147.5, 136.4, 133.8, 125.1, 121.6, 110.8, 103.9. FT-IR (KBr): 3442, 3168, 1594, 1384, 1209. UV–vis, CH3OH, λmax, nm (ε, M−1 cm−1): 442 (19500). Melting Point: 175–180 °C. HRMS: Calcd for [M + H]+, 260.0671; Found, 260.0663.
2.4. Synthesis of (L1)2Cu
A solution of Cu(ClO4)2 6H2O·(0.125 g, 0.34 mmol) in methanol (10 mL) was added to a stirring solution of HL1 (0.2 g, 0.68 mmol) in 30 mL of methanol and Et3N (0.14 g, 1.35 mmol). The resulting reaction mixture was stirred at room temperature for 2 h. The precipitate formed was filtered and washed twice with Et2O and CH3-CN. It was dried under vacuum (0.135 g, yield 60%). UV–vis, DMF, λmax, nm (ε, M−1 cm−1): 435 (9100), 500 (sh, 8100). Anal. Calcd for C30H18N8O6Cu: C, 55.43; H, 2.79; N, 17.24. Found: C, 55.16; H, 2.34; N, 17.22.
2.5. Synthesis of (L2)2Cu
A solution of Cu(ClO4)2·6H2O (0.14 g, 0.38 mmol) in CH3OH (10 mL) was added to a stirring solution of HL2 (0.2 g, 0.77 mmol) in (10 mL) CH3OH and Et3N (0.156 g, 1.54 mmol). The resulting reaction mixture was stirred at room temperature for 2 h. The dark brown precipitate formed was filtered and washed thrice with Et2O. It was dried under vacuum (0.2 g, yield 89%). UV–vis, CH3CN, λmax, nm (ε, M−1 cm−1): 435 (13,850). ESI-MS: Calcd for [M + H]+, 580.04; Found, 580.31. Anal. Calcd for C24H16N6O8Cu: C, 49.70; H, 2.76; N, 14.49. Found: C, 49.39; H, 2.76; N, 14.78.
2.6. CEWL fibrillation
Chicken Egg White Lysozyme (CEWL) protein was obtained from Sigma and stored at −80 °C. Small aliquots were carefully weighed out at room temperature in microcentrifuge tubes. CEWL aliquot was dissolved in DMSO and diluted in phosphate buffer saline (PBS, pH 7.4) TO reach a final concentration of 20 μM. Final DMSO amount was maintained <2% of total volume throughout all assays. These solutions were incubated in absence and presence of inhibitors for 48 h at 60 °C with continuous agitation of 1200 rpm. The extent of fibrils formed after this time was checked by ThT fluorescence and TEM. It was observed that there is no fibrillation of CEWL at room temperature (25 °C) even after 7 days.
2.7. Fluorescence measurements
All fluorescence measurements were performed using Perkin Elmer LS-55 Fluorescence Spectrometer unless stated otherwise.
2.8. Thioflavin-T assay
For monitoring the progress of aggregation, Thioflavin-T (ThT) fluorescence assays were perfomed as follows: 1 mM stock solutions of ThT was prepared in DMSO and diluted in PBS as needed. For inhibition of CEWL fibrillation by inhibitors used in these studies, inhibitors (20 μM) and CEWL solutions (20 μM in PBS, pH 7.4) were incubated for 48–72 h at 60 °C with constant agitation. For monitoring the extent of aggregation, samples were diluted to 2.5 μM CEWL in PBS containing ThT (10 μM). Fluorescence spectra were recorded for each sample using λex = 435 nm and measuring the fluorescence intensity at 485 nm.
2.9. 8-Anilino-1-naphthalenesulfonic acid ammonium salt (ANS) assays
5 mM stock solution of ANS was prepared in PBS having 1% DMSO. Then, it was diluted to 50 μM in PBS for recording UV–vis spectra. Emission spectra were recorded at λex = 380 nm. For monitoring the extent of aggregation, samples were diluted to 2.5 μM CEWL in PBS containing ANS (10 μM). Fluorescence spectra were recorded for each sample using λex = 380 nm measuring the fluorescence intensity at 480 nm.
2.10. Acidity and stability constant determination
UV–vis pH titrations were employed for the determination of acidity constants of HL2 and stability constants of its Cu complex. Titrations were carried out at 25 °C using a Eutech pH meter 700 with pH glass-electrode (ECFC7252101B) with a ground-joint diaphragm. Electrode has a porous HDPE pin type liquid junction and Ag/AgCl type internal reference. It can measure pH range from 0 to 13 in the 0–80 °C temperature range. It has a stainless steel 304 temperature probe (PH5TEMB01P). Before experiment, the standardization was done with aqueous buffer solutions at pH 4.00 and 7.00. Due to the limited solubility of HL2 in water, MeOH stock solutions (1 mM) were used and titrations were performed in MeOH-H2O (20% v/v) mixture containing 0.1 M NaCl. For titration, pH of solution was raised by adding 0.1 M NaOH solution using a Hamilton microsyringe (10 μL). To compensate for the expected methanol–water liquid junction potential, a correction of 0.015 pH units was done by subtracting from the measured pH readings [19]. For the acidity constants determination, a solution of HL2 (50 μM) was titrated with 0.1 M NaOH at room temperature. At least twenty UV–vis spectra were collected in pH 3–12 range. Similarly, stability constant was determined by titrating solution of HL2 (20 μM) and 0.5 equivalent amount of CuCl2 2H2O (10 μM) with small aliquots of 0.1 M NaOH at room temperature. At least twenty UV–vis spectra were collected in pH 3–12 range. The acidity and stability constants were calculated using the HYPSPEC computer program [20]. Speciation plots of the compounds and their metal complexes were calculated using the program HySS2009 (Protonic Software, UK) [21].
2.11. Computational details
All the theoretical calculations were performed using density functional theory based B3LYP [22] level of theory in conjuction with 6 – 31 + G** basis set [23] for all except metal atom where we used Def2-DZVP with effective core potential [24]. Full geometry optimizations for all complexes considered here have been performed followed by harmonic vibrational frequencies to validate each structure as true minima. All the theoretical calculations have been performed using the Gaussian09 program package (reference R1, ESI). Further validation for the accuracy of the level of theory used here were tested. First, to check the accuracy of the Def2-DZVP basis used for metal atom, we used 6 – 31 + G** basis for all the atoms. Next, we also tested the solvent effects on the structural parameters by means of the Polarizable Continuum Model (PCM) using the integral equation formalism variant (IEFPCM) [25] where CH3CN was used as solvent at the B3LYP/6 – 31 + G**/Def2-DZVP level of theory.
2.12. Transmission Electron Microscopy (TEM)
Glow-discharged grids (Formar/Carbon 300-mesh, Electron Microscopy Sciences) were treated with preformed CEWL aggregates in absence and presence of compounds for 30 min at room temperature. Excess solution was removed using filter paper and grids were rinsed with distilled H2O. Grids were stained with ammoniumm molybdate (1% w/v, H2O) for 1 min, blotted with filter paper, and dried overnight at room temperature. Images were captured using a FEI G2 Spirit Twin microscope (200 kV). TEM analysis was performed at the Material Research Centre at MNIT, Jaipur.
2.13. Cell toxicity assays
Mouse neuroblastoma Neuro2A (N2A) cell lines were purchased from the American Type Culture Collection (ATCC). Cells were grown in Dulbecco’s Modified Eagle’s medium (DMEM)/10% FBS, which is the regular growth media for N2A cells. N2A cells were plated to each well of a 96 well plate (1 × 10⁴/well) with DMEM/10% FBS. The media was changed to serum-free medium containing N2 supplement. After 1 h, the compounds were added into each well (final volume: 100 μL) with different concentrations (2, 5, 10 μM), followed by incubation for 24 h at 37 °C. Due to the poor solubility of compounds in water or media, their stock solutions were prepared in DMSO and diluted in media. The final DMSO concentration in this way was less than 1%. Our control experiments suggest that there is no toxicity caused by 2% DMSO. At last, each well was treated with 10 μL of Alamar blue reagent and the cells were incubated for 1 h. The fluorescence (excitation: 560 nm, emission: 590 nm) was measured using a SpectraMax M2e plate reader (Molecular Devices, USA).
3. Results and discussion
3.1. Design concept for HL1 and HL2
Our general strategy to develop novel multifunctional compounds is to synthesize small molecule metal chelators functionalized with amyloid recognition moieties. In the current studies, we choose molecular frameworks that are expected to bind amyloid aggregates. Stilbene and fluorescent dye thioflavin-T (ThT) derivatives and few other molecular frameworks have been utilized previously for this purpose [2c,6b,7a,15a]. Iodinated 2-(2-hydroxyphenyl)benzothiazole and a few related compounds were also shown to be potential metal chelating agents for AD by Rodríguez-Rodríguez et al. [13]. A generic scheme of our approach is shown in Fig. 2. The design of these molecules is partly inspired by the properties of CR known to stain ex-vivo amyloid plaques [14,16,26]. Half CR type molecules, resveratrol-stilbene framework have been adopted since these are known for their amyloid binding affinities [15b,15c]. In addition, metal chelation properties of 8-hydroxyquinoline (HQ) or clioquinol (CQ) were incorporated (Figs. 1 and 2) [27]. In HL2, metal chelation part was developed by using resorcinol as starting material, thus generating the azo-stilbene character (Fig. 1). To the best of our knowledge, this design has never been investigated in the context of bioinorganic chemistry in general or multifunctional metal chelators for controlling metal induced abnormalities in particular.
Fig. 2.
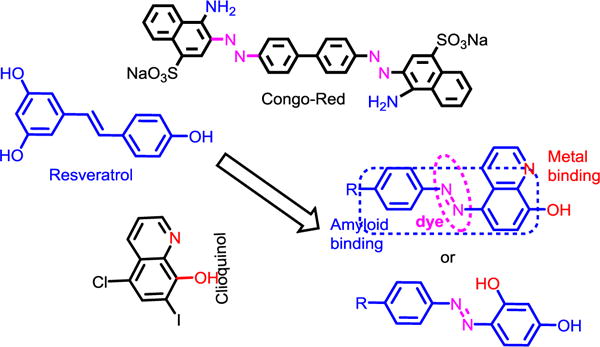
Design concept of multifunctional chelators HL1 and HL2 used in current studies.
3.2. Synthesis, characterization and drug-likeness of HL1 and HL2
Synthesis of both compounds HL1 and HL2 is described above in experimental section. Standard synthetic methods of azo-coupling were followed to obtain these compounds in good yields (Scheme 1). During the reactions, a distinct colour change due to azo dye formation suggested product formation.
Scheme 1.
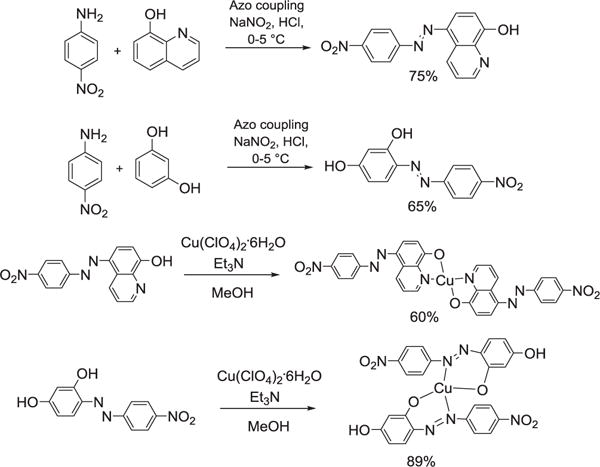
Synthesis of HL1, HL2 and their Cu complexes.
Intense coloured products were isolated and characterized by 1H, 13C NMR, HRMS methods. 1H NMR chemical shifts were broadened in some cases, probably due to some cis-trans isomerisation about azo-group. UV–vis spectrum of HL1 shows an absorption band at 418 nm in MeOH (Fig. S1, ESI). However, HL1 exhibit an additional absorption band at 630 nm in DMF, probably due to a change in conformation (Fig. S1, ESI). Copper complex of HL1 in DMF exhibit two absorption bands at 435 nm and a shoulder at 500 nm, respectively (Fig. S2, ESI). When EDTA is added to a solution of (L1)2Cu in DMF, both the absorption bands at 418 nm and 630 nm reappeared corresponding to the HL1 (Fig. S3, ESI). Although it suggests a reversible process, it was observed that EDTA could generate the free ligand only partially even after adding excess and keeping for days. It could be due to the chelating ability of HL1 for Cu is similar to EDTA and equilibrium develops after certain time. HL2 show a UV absorption bands at 410 nm assignable to n → π* transitions (Fig. S3, ESI). A shift in this absorption band was observed for the copper complex of HL2 which exhibit absorption band at 435 nm in CH3CN (Fig. S4, ESI). HL2 and (L2)2Cu spectra were recorded in DMF also. In DMF, HL2 and (L2)2Cu both show two absorption bands at 445 nm and 545 nm. (Fig. S5, ESI).
An important qualification for small molecules to fit for any application in brain related diseases is its ability to cross through blood brain barrier (BBB). The BBB permeability of a metal-binding ligand is affected by many properties such as molecular size, charge and lipophilicity [1b,3c]. According to Lipinski rules [11] for bioavailability, at least three out of the five following rules for molecules are to be obeyed: molecular weight <500, calculated logarithm of octanol–water partition coefficient (clogP) <5, the number of hydrogen-bond donors (HBD) <5, the number of hydrogen-bond acceptors (HBA) <10. Clearly, highly polar compounds would have difficulty at the stage of passing through the BBB. In order to evaluate theoretically whether or not a molecule could pass through the BBB by passive diffusion, the logBB parameter can be predicted using the relation, log BB = −0.0148 TPSA + 0.152 clogP + 0.139 [15a]. This phenomenological expression has shown good predictive ability for a large number of molecules. Freely available software from the http://www.molinspiration.com/cgi-bin/properties was used to calculate above properties. Although, most of the parameters for two compounds investigated here are in the range of Lipinski parameters, except that TPSA (polar surface area) which is on slightly higher side due to the hydrophobic nature of HL1 and HL2 (Table 1).
Table 1.
Drug-like parameters for compounds HL1-HL2.
| Compounds | cLogP | TPSA | M.Wt. | HBD | HBA | logBB |
|---|---|---|---|---|---|---|
| HL1 | 4.08 | 103.67 | 294.27 | 1 | 7 | −0.775 |
| HL2 | 3.32 | 111.01 | 259.22 | 2 | 7 | −0.999 |
| Lipinski rulesa | 5 | 90 | 500 | 5 | 10 | >0.3 to 1.0 |
MW: molecular weight; clogP: calculated octanol-water partition coefficient; HBD: hydrogen-bond donor atoms; HBA: hydrogen-bond acceptor atoms; PSA: polar surface area. (Lipinski, C. A.; Lombardo, F.; Dominy, B. W.; Feeney, P. J. Adv. Drug Delivery Rev. 1997, 23, 3–25; Clark, D. E.; Pickett, S. D. Drug Disc. Today 2000, 5, 49–58).
3.3. Protonation constants for HL1 and HL2
As both HL1 and HL2 contain phenoxo/hydroxo and pyridine functional groups which can undergo protonation, we determined their acidity constants (pKa) by spectrophotometric-potentiometric titrations [2c,28]. HL1 shows a limited solubility in aqueous media and satisfactory data could not be obtained for pKa determination. We tried to use more soluble analogues i.e., (phenyldiazenyl)quinolin-8-ol and 8-hydroxyquinoline (HQ) as a model for this ligand but these ligands did not show any appreciable change in spectra to be used for pKa determination. For HL2, UV–vis titrations in the pH range 3–12 undergo several spectral shifts (Fig. 3). First at pH 3, a peak at 410 nm is dominant and as the pH rises, this peak shifts to a new peak at 450 nm. The best fit to this data could be obtained with pKa values of 6.117 and 9.951. These pKa values may be assigned to the deprotonation of nitrogen atoms of azo group, while the second one is deprotonation of one of the phenol groups. The other phenol group also get deprotonated but at very high pH (~11) and spectra again changes but data is not shown here.
Fig. 3.
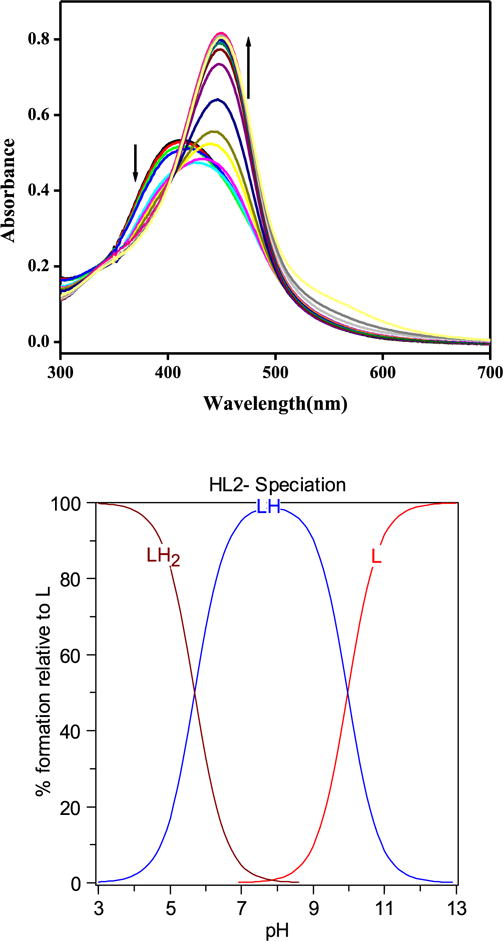
Variable pH-UV spectra of HL2 (50 μM, 25 °C, I = 0.1 M NaCl) and the species distribution plot cacuclated by HYSS.
3.4. Metal chelating properties of HL1 and HL2 towards Cu2+
Metal binding ability for both HL1 and HL2 were studied in solution using methanol as solvent. The binding stoichiometry of HL1 and HL2 with Cu2+ was determined by Job’s Plot method. A notable shift was observed in the spectra of HL1 and HL2 when their solution was mixed with Cu2+ ions (Figs. S6 and S7, ESI). For both the ligands, a stoichiometric break at 0.4 mol fraction of the metal ion, suggests the formation of a mixture of 1:1 and 1:2 metal-ligand species (Fig. 4). Given that these are bidentate ligands and are expected to form (L)2Cu complexes, a 1:1 stoichiometry suggest the presence of some solvento complexes in solution. In addition, Cu2+ complexes of HL1 or HL2 were synthesized by reacting CuClO4·6H2O with the corresponding ligand in MeOH in presence of a slight excess amount of Et3N. Their UV-vis spectra of these isolated complexes show a shift from parent ligand spectra suggesting the formation of Cu2+ complexes (Figs. S2 and S4, ESI).
Fig. 4.
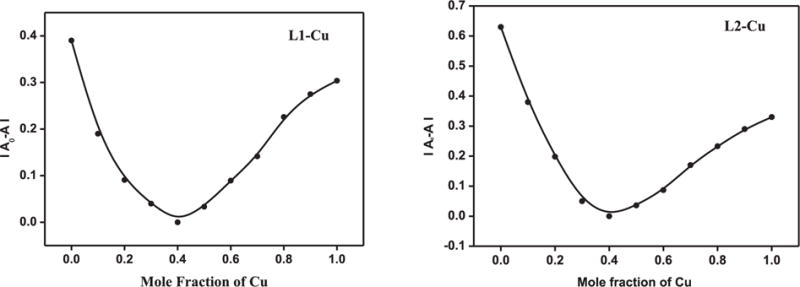
Job’s plot for HL1 and HL2 with Cu2+ in MeOH.
3.5. Theoretical investigations on equilibrium structures and binding energies of Cu complexes
To assess the structures of metal complexes, the calculated equilibrium geometries of most probable Cu2+ complexes were studied using first-principles based quantum mechanical calculations using B3LYP/6-31+G**/Def2-DZVP level of theory. The structural analysis of equilibrium geometries of most probable Cu2+ complexes was performed. Both the Cu2+ complexes of HL1 and HL2 were optimized to get their geometries and other metric parameters. As these Cu2+ complexes are bidentate ligands, a 2:1 ligand to metal stoichiometry is expected which is also suggested by Job’s plot. A systematic analysis of the optimized geometrical data such as bond lengths, bond angles and dihedral angles can provide useful information about the metal chelation. For (L1)2Cu complex, a perfect square planar geometry was observed with dihedral angle 180.0° around the Cu2+ (Fig. 5). The Cu–N and Cu–O equilibrium bond lengths were found 1.9962 Å and 1.9501 Å, respectively. DFT optimized bond length and bond angle data is summarized in Table 2. These bond lengths are in good agreement with reported literatures for Cu–O(phenolate), Cu–N(amine/pyridine) [7a,29]. In (L2)2Cu, due to the presence of azo group, there is a possiblity that either of the nitrogens can coordinate with Cu2+ to form Cu–N bond which afford five or six-membered ring (Scheme S1, ESI). In the optimized structures, both the possibilities were analysed. Structural parameters showed that 6-membered ring is less distorted from planarity than 5-membered ring. Consequently, the Cu–O and Cu–N bond distances for 6-membered ring are closer than the five-membered ring to the corresponding values of L2. While the two 5-membered rings of the corresponding complex is almost planar with a dihedral angle very close to 0°, the corresponding 6-membered rings are non-planar with a dihedral angle ~11° to reduce the ring strain. As a result it was observed that 6-membered ring was more stable than the 5-membered ring by 14.42 kcal/mol [30].
Fig. 5.
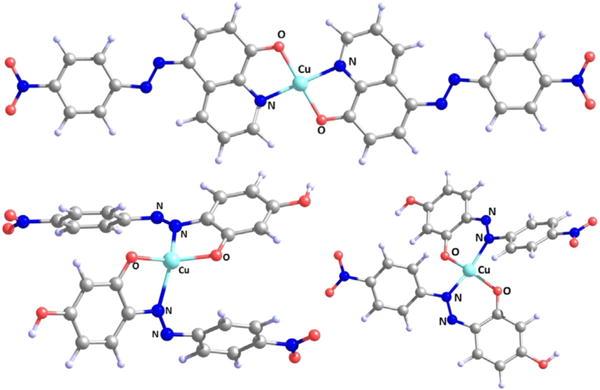
DFT optimized structures of (L1)2Cu and (L2)2Cu complexes (both 5-membered ring and 6-mebered chelating ring are shown for (L2)2Cu). Coordinating atoms are name as N1 and O1 in (L1)2Cu; and N2/N3 and O1 in (L2)2Cu, respectively.
Table 2.
DFT-optimized bond lengths and bond angles data for (L1)2Cu and (L2)2Cu. Bond lengths are in Å and angles are in degree.
| (L1)2Cu | (L2)2Cu 5-membered | ||
|---|---|---|---|
| Cu – O(1) | 1.9501 | Cu – O(1) | 1.895 |
| Cu – N(1) | 1.9962 | Cu – N(1) | 2.175 |
| Cu – O(2) | 1.9501 | Cu – N(3) | 2.175 |
| Cu – N(2) | 1.9962 | Cu – O(2) | 1.895 |
| O(1)–Cu–N(1) | 83.60 | O(1)–Cu–N(1) | 82.44 |
| O(1)–Cu–O(2) | 179.99 | O(1)–Cu–O(2) | 147.81 |
| N(1)–Cu–N(2) | 199.99 | O(1)–Cu–N(3) | 111.72 |
| O(1)–Cu–N(2) | 96.40 | N(1)–Cu–N(3) | 129.02 |
| Dihedral angle sq. pl. | 179.99 | O(1)–Cu–N(1) – N(3) | 98.08 |
| O(2)–Cu–O(1) – N(3) | 119.35 | ||
| Selected reported values of Cu–N and Cu–O bond lengths are as follows: | |||
| Cu–N | 1.980 and 1.965 [Ref. [7a]]; 2.002 and 2.042 [Ref. [28]]; 2.004 and 2.024 [Ref. [13]]; 1.980–2.024 [Ref. [31]] | ||
| Cu–O(phenolate) | 1.906 [Ref. [28]]; 1.917 and 1.904 [Ref. [13]]; 1.876 and 1.873 [Ref. [7a]]; 1.961 [Ref. [31]] | ||
In order to further check the accuracy of the Def2-DZVP basis used for metal, one selected complex (L2)2Cu was further analysed by using 6 – 31 + G** basis for all the atoms. Next, solvent effects on the structural parameters was also tested by means of the Polarizable Continuum Model (PCM) using the integral equation formalism variant (IEFPCM) [25] where CH3CN was used as solvent at the B3LYP/6 – 31 + G**/Def2-DZVP level of theory. It is found that there are no noticeable changes in the optimized structures at different levels. All the parameters (see Table S1, ESI) found at different methods were very much similar to each other which shows that B3LYP/6 – 31 + G**/Def2-DZVP level of theory is adequate for the study of these complexes (Table S1, ESI).
To further assess the ability of metal chelation we explored the binding energies for each complex. The binding energy between the BS and each metal in vacuo is defined by the formula: ΔE (binding energy) = E (metal-binding complex in vacuo) − [E (Ligand in vacuo) + E (free metal ion in vacuo)]. The calculation of the interaction energies were considered using rigid geometries, such that when the metal-ligand bonds are broken, the ligands retain the same geometries they had in the equilibrium structure. It is found that the binding energies for the L1-Cu complex, L2-Cu complex with 5-membered ring and L2-Cu complex with 6-membered are 619.75, 619.01 and 629.20 kcal/mol, respectively. That shows that all ligands bind with Cu2+ strongly and approximately equal strength whereas 6-membered L2-Cu complex binds marginally better. It further supports our previous observation regarding the more stability of 6-membered L2-Cu complex over 5-membered one. Finally, the overall equilibrium structural parameters and binding energies for all the cases obtained suggest that these ligands are very much capable of binding to Cu2+ ions and can potentially be used for copper chelation therapy.
3.6. UV–vis determination of stability constants
pH-spectrophotometric titrations were also performed to determine the stability constants and solution speciation of Cu2+ with HL2 system (Fig. 6). The pKa values of the HL2 were included in the calculations of stability constants. Two models were tried to fit the observed data: first the formation of both 1:1 and 1:2 metal to ligand species and second, only formation of 1:2 metal to ligand species were taken in account. While first model did not give any reasonble fitting of the data, second model fitted the data easily. The best fit to the data shows that HL2 binds Cu2+ with a stability constant of 16.88(1) for the reaction 2L2 + Cu = (L2)2Cu. For the sake of simplicity, in the data fitting model HL is represented to have only one phenol group which can coordinate with metal ion. The speciation diagram for the Cu-HL2 system is shown in Fig. 6. In addition, the concentration of free Cu2+ (pCu = −log [Cufree]) can be determined at specific pH values and total ion concentrations, pCu values of 9.46 at pH 7.4. Only a 0.003% of total Cu was remaining free at pH 7.4 as observed in the fitted data. These pCu values are similar compared to other bidentate lignads reported in the context of metal chelation from amyloids [7a,9]. Unfortunately, the spectrophotometric titration of HL1 in presence of Cu2+ did not give satisfactory spectral data to determine stability constants due to precipitation of (L1)2Cu. Use of 8-hydroxyquinoline as a model study also did not help as this system exhibit very little change in spectra. The use of higher concentrations lead to the precipitation of the Cu complexes.
Fig. 6.
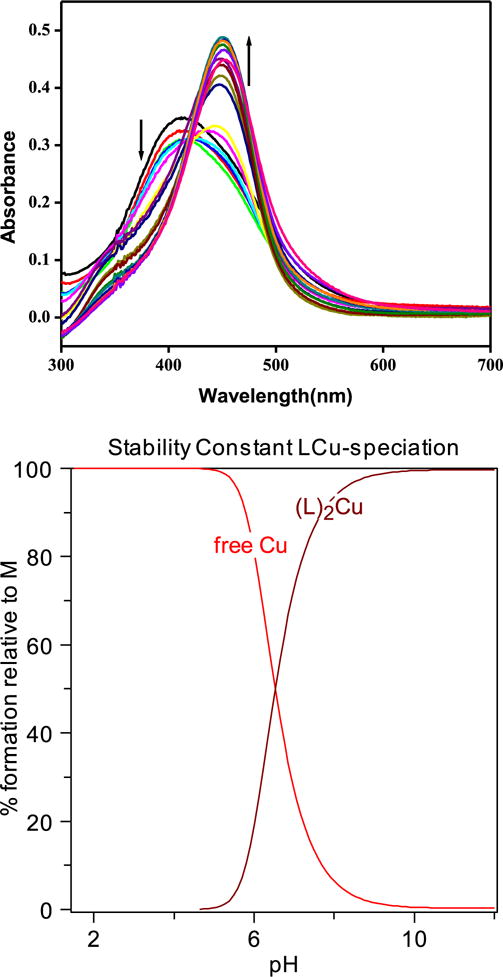
Variable pH UV spectra of the HL2-Cu2+ system ([HL2] = 20 μM; [Cu2+] = 10 μM, 25 °C, I = 0.1 M NaCl) and the species distribution plot cacuclated by HYSS.
3.7. HL1 as amyloid sensor
Azo dyes are known for their staining of fibres. Due to the azo dye function associated with these molecules, we were curious to see if HL1 and HL2 can stain amyloid fibrils and give some further evidence that these MFCs can bind to amyloid fibrils. Staining assays were performed with both in solution and isolated amyloid fibrils (centrifuged pellet). Preformed fibrils (20 μM) were taken in a clean glass vial and HL1 and HL2 (1:1 DMSO:EtOH) were added to it. Addition of HL1 leads to a sudden colour change to violet but addition of HL2 did not cause any significant colour change (Fig. 7-label 1–4). In addition, when HL1 was added in an isolated pellet of CEWL fibrils, it resulted into a similar colour change (Fig. 7-label 5–6). The purple colour did not fade away even after several washes with PBS buffer. It clearly indicates the tight binding affinity of HL1 for amyloid fibrils. Although it was expected to see some colour shift but more interesting fact was to see such a drastic colour change which persists for months without fading. This is encouraging for investigating further and using this class of compounds for histological applications in imaging of amyloid species. It will help to find out molecular motifs that can be used in future studies for the development of novel amyloid-binding compounds.
Fig. 7.
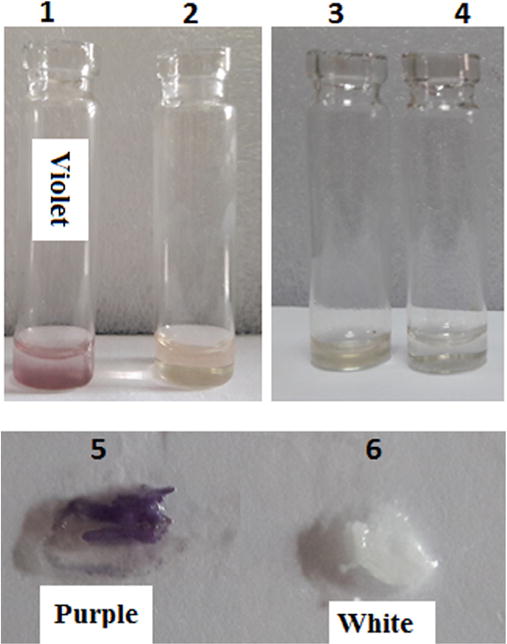
Amyloid staining experiment: Vial 1: HL1 with CEWL fibrils (violet); vial 2: HL1 only; vial 3: HL2 + CEWL fibrils; vial 4: HL2 only; (on the glass slide) pellets of amyloid fibrils with HL1 (5) (purple); and without HL1 (6), respectively.
In order to further understand the observed colour change of HL1 with amyloids, its spectra were recorded in absence and presence of fibrils. For this, stock solution of 2 mM of HL1 in 1:1 DMSO and EtOH was prepared due to its limited solubility in aqueous media. Varying amounts of HL1 (0.2–0.7 mM) were added successively to the solution containing CEWL fibrils (20 μM) and their spectra were recorded. Spectra with 0.5 and 0.7 mM solution of HL1 in absence and presence of fibrils are shown in Fig. 8. In the diluted solutions, presence of fibrils leads to only small change in spectra. However, in case of 0.7 mM HL1 concentration a significant spectral shift was obtained due to the presence of amyloid fibrils and a new absorption band at ~580 nm appeared in the spectra. It can be understood that the conformation of HL1 bound to CEWL fibrils exhibit an absorption band at ~580 nm. It is interesting to note that absorption spectra of HL1 exhibit a broad absorption band at 630 nm when spectra were recorded in medium containing DMF (Fig. S1, ESI), probably due to the similar reason. As HL1 binds to the β-sheets of amyloid fibrils, the conformation associated with purple band becomes more stable. However, more experimental evidences are needed to support this hypothesis.
Fig. 8.
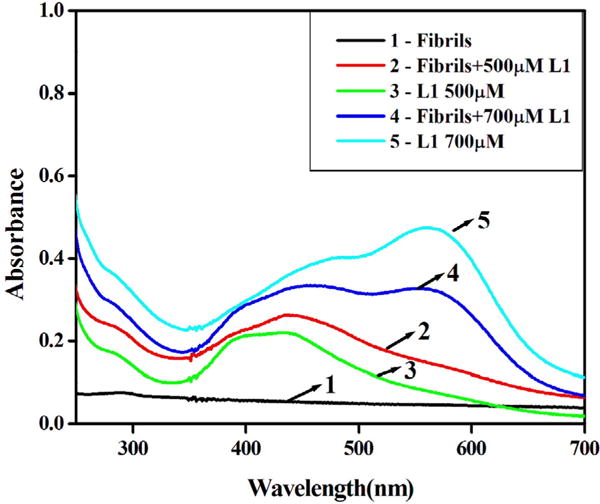
Comparison of UV–vis spectra of HL1 (500 μM and 700 μM) in absence and presence of amyloid fibrils (20 μM).
3.8. Inhibition of CEWL fibrillation by HL1, HL2 and their Cu complexes
Metal binding properties of HL1 and HL2 are evident from the above discussion. The inhibitory effect of HL1, HL2 and their isolated Cu complexes on CEWL aggregation was also investigated. For these studies, equivalent amounts of HL1, HL2 and their isolated Cu complexes were added to CEWL solutions (20 μM in PBS) before incubation for 48 h at 60 °C. We were curious to see if metal complexes can inhibit aggregation or cause disaggregation of amyloid plaques. Metal complexes as inhibitors of aggregation is an important aspect but neglected so far and needs more attention. Inhibitory effect of Cu complexes is needed to be evaluated since HL1 and HL2 are good metal chelating agents and expected to chelate metals from amyloids plaques when applied in vivo. ThT and ANS fluorescence assays along with TEM imaging were performed to assess the extent and nature of aggregates formed.
3.9. ThT fluorescence assay to study inhibition
ThT fluorescence assay were used to quantify the extent of fibril formed when CEWL was incubated in fibrillation conditions with and without inhibitors. HL1, HL2 and their copper complexes were tested for the inhibition of CEWL fibrillation. Interestingly, HL1, HL2 and their copper complexes significantly reduce the ThT emission intensity indicating the inhibition of CEWL fibrillation (Fig. 9. HL1 and HL2 inhibit fibrillation by 76% and 92% respectively. (L1)2Cu and (L2)2Cu complexes inhibit fibrillation by 44% and 62%, respectively. The reduction in the extent of inhibition by non-planar (L)2Cu complexes compared to parent ligands is understandable due to poor intercalation properties which depends on molecular planarity. Interestingly, complexes of HL1 and HL2 are also good inhibitors of amyloid aggregation. In addition, centrifugation was performed for these samples and both the residue (bottom part) and supernatants were separately analysed by ThT fluorescence assay. It was interesting that both the supernatant and residues show very less ThT fluorescence and suggests very low fibrillation in presence of inhibitors compared to those in absence of inhibitors (Fig. S8 and S9, ESI). These studies clearly show that the ligands and their metal complexes investigated here have an inhibitory effect on CEWL fibrillation.
Fig. 9.
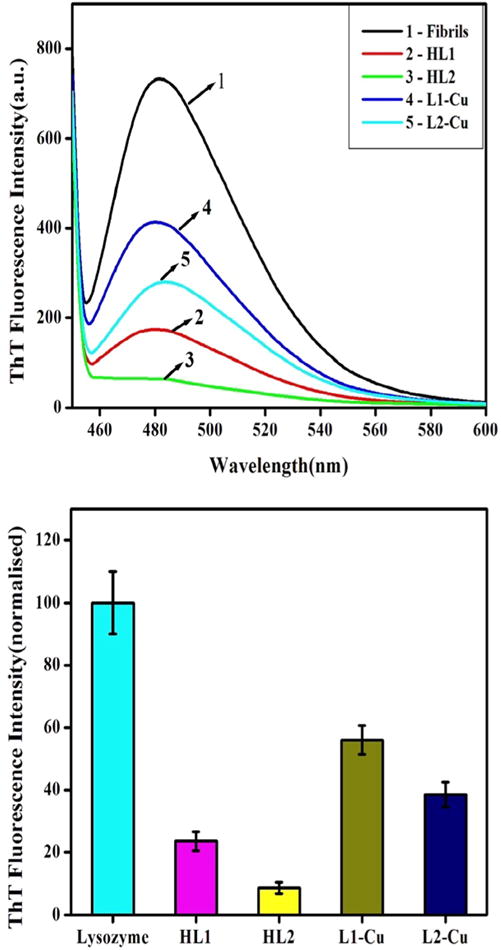
(Top) ThT fluorescence spectra when mixed with CEWL aggregates formed in fibrillation conditions [60 °C, 1200 rpm, 48 h] with various additives as indicated. (Bottom): Normalized ThT fluorescence when mixed with CEWL aggregates formed in fibrillation conditions [60 °C, 300 rpm, 48 h] with various additives as indicated.
3.10. ANS fluorescence assay to study inhibition
1-Anilinonaphthalene-8-sulphonate (ANS) fluorescence assays were also performed to study the inhibition in order to obtain more information about the nature of aggregates formed. ANS and Bis-ANS have been widely used non-covalent fluorescent probes for studying protein fibrillation. ANS contains aniline and naphthelene as hydrophobic moieties whereas sulphonate group as polar part. It interacts through its sulphonate part with the positively charged amino acids such as lysine, arginine and histidine. The aromatic hydrophobic part coordinates with the nonpolar entities of proteins. The reported excitation wavelength of ANS is 350–380 nm and the emission maximum of ANS in water is 500 nm. It is known that ANS is virtually non-fluorescent in aqueous medium but becomes highly fluorescent in nonpolar organic solvents due to its binding to hydrophobic regions of proteins resulting into ~100 fold increase in its fluorescence quantum yield and a blue shift of emission wavelength (from 530 nm to 475 nm) [32]. Also, it is reported that when ANS is bound to protein oligomers, its emission maximum is blue-shifted to 440 nm [33]. We recorded the UV–vis spectra of ANS in PBS and first absorption band was observed at 265 nm and another broad absorption band between 300 and 400 nm (Fig. S10, ESI). ANS exhibit an emission band at 480 nm when excited at 380 nm. A several fold increase in fluorescence intensity of ANS at 480 nm was observed in presence of CEWL fibrils. Monomeric CEWL did not cause any such increase (Fig. S11, ESI). Increase in fluorescence intensity at 480 nm was used to quantify the CEWL fibrils formed either in presence or absence of inhibitors. It was interesting to observe that HL1 and HL2 caused >90% inhibition to fibrillation (Fig. 10). These results are consistent with the ThT data obtained above. (L1)2Cu and (L2)2Cu show >70% and >80% inhibition of CEWL fibrillation, respectively. Interestingly, a slight blue shift in ANS spectra was observed for the sample containing (L1)2Cu complex (Fig. S12, ESI).
Fig. 10.
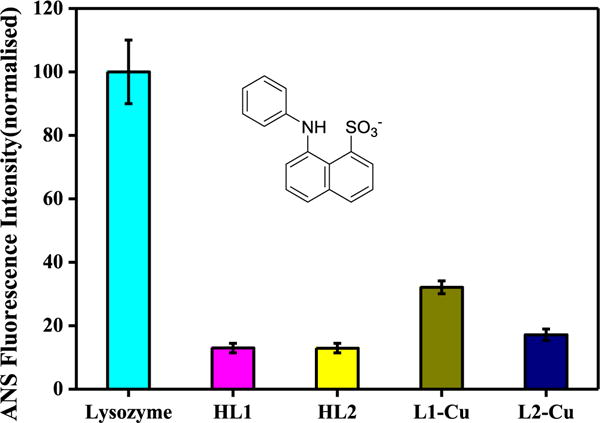
Normalized ANS fluorescence intensities when mixed with CEWL aggregates formed in fibrillation conditions [60 °C, 1200 rpm, 48 h] with various additives as indicated.
3.11. TEM analysis
All the samples studied above by ThT and ANS fluorescence assays were also analysed by TEM in order to assess the extent of aggregation and morphology of different aggregates formed. In general, a big surface of TEM grids were analysed and many images were taken. The images shown in manuscript are the most representative of the entire sample. CEWL was observed to form large amyloids in fibrillation conditions (Fig. 11, panel A). In presence of either HL1 (Fig. 11, panel B) or HL2 (Fig. 11, panel C) CEWL show much less aggregates. HL2 was observed to be a better inhibitor of fibrillation process than HL1 as observed by very few aggregates in panel C of Fig. 11. This is also consistent with the results of ThT fluorescence assay. In addition, the samples containing the aggregate formed by CEWL in presence of Cu complexes of HL1 and HL2 were also analysed. Interestingly, while (L1)2Cu show reduced amyloid aggregates, (L2)2Cu forms amorphous aggregates. Since, amorphous aggregates are known to reduce ThT fluorescence [4], these results are consistent with ThT and ANS fluorescence assay. Overall, both HL1 and HL2 and their Cu complexes are good inhibitors of amyloid formation.
Fig. 11.
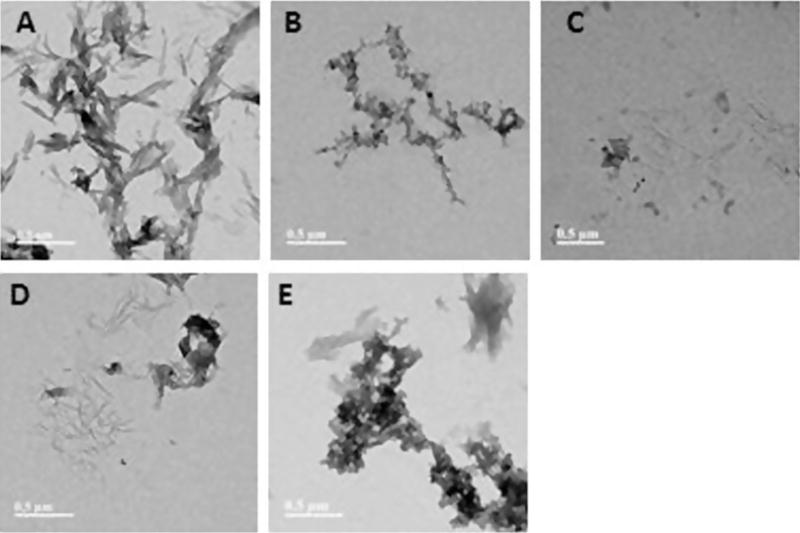
TEM images of CEWL species from inhibition experiments ([CEWL] = 20 μM, [compound] = 20 μM, 48 h, 60 °C). All scale bars represent 500 nm. Panels: A. CEWL; B. CEWL + HL1; C. CEWL + HL2; D. CEWL + (L1)2Cu; E. CEWL + (L2)2Cu.
3.12. Cell toxicity studies
Cell toxicity studies were also performed with Neuro2A (N2A) cells using an Alamar Blue reagent to check the toxic effects of HL1 and HL2 as well as their non-nitro analogues. The objectives with cellular studies were to check if, in general, our molecular design is toxic to cells or not and also to see if there is any effect of azo- and nitro- groups on cellular toxicity. The cell toxicity data is given in Table S2, ESI and shown in Fig. 12. First, we investigated the cellular toxicity of 4-(phenyldiazenyl)phenol at various concentrations ranging from 2 μM to 10 μM and observed a >90% cell survival (Fig. 12, A1–A3). This suggests that 4-(phenyldiazenyl) phenol as such is non-toxic molecular framework. However, while 5-(phenyldiazenyl)quinolin-8-ol (the non-nitro analogue of HL1) was found to exhibit a ~90% cell survival at 2 μM concentration, higher concentrations lead to significant cell toxicity (Fig. 12, B1–B3). HL1 was found to exhibit an even poor cell survival in the range of 20–30% only at the different concentrations tested (Fig. 12, C1–C3). This study clearly suggests that having a NO2 group substitution is toxic to cells. The same pattern was also observed for the HL2 and its non-nitro analogue (Fig. 12, D1–D3 & E1–E3). Interestingly, 4-(phenyldiazenyl)benzene-1,3-diol (the non-nitro analogue of HL2) was found to be non-toxic with a >90% cell survival at different concentrations. HL2 lead to only ~45% cell survival at various concentrations (Fig. 12, E1–E3).
Fig. 12.
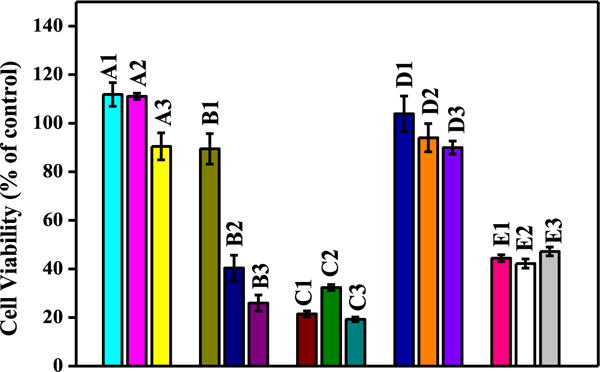
Cell viability (% control) of Neuro2A cells upon incubation with: A1–A3: (4-(phenyldiazenyl)phenol) at 2, 5 and 10 μM concentrations, respectively; B1–B3: (4-(phenyldiazenyl)quinolin-8-ol) at 2, 5 and 10 μM concentrations, respectively; C1–C3: HL1 at 2, 5 and 10 μM concentrations, respectively; D1–D3: (4-(phenyldiazenyl) benzene-1,3-diol) at 2, 5 and 10 μM concentrations, respectively; and E1–E3: HL2 at 2, 5 and 10 μM concentrations, respectively.
4. Conclusion
In the studies presented here, we have investigated two small molecules based on the structure-function design strategy. These molecules are designed to control metal ions like Cu2+ that cause reactive oxygen species and produce toxic aggregates. We established that HL1 and HL2 can chelate Cu2+ ions as indicated by spectral changes observed, Job’s plot analysis, isolation and characterization of Cu complexes. In addition, UV–vis determination of stability constants suggest a good affinity of HL2 towards Cu. DFT studies shows that HL1 and HL2 are good binder to Cu2+ with approximately equal strength. Some more insights were obtained about the binding mode of HL2 towards Cu as 6-membered chelate ring in case of L2-Cu complex binds marginally better than the 5-membered one. HL1 stains CEWL aggregates very well and suggest a strong binding nature of such molecules towards amyloid plaques. The inhibitory effect of HL1, HL2 and their Cu complexes on CEWL fibril formation was studied. Interestingly, HL1 and HL2 and their Cu complexes are excellent anti-amyloidogenic agents as established by ThT and ANS fluorescence assays. Cellular studies suggest that although this molecular design could be non-toxic, nitro group substitution results into decreased cell survival. Non-nitro analogues were less toxic. These studies will be helpful for the design of future anti-aggregation multifunctional metal chelators.
Supplementary Material
Acknowledgments
AKS acknowledge Science and Engineering Research Board for financial support (grant ref.: EMR/2016/001452) and DST-INSPIRE research grant (IFA-13, CH-97). MR acknowledges Central University of Rajasthan for fellowship. AKS is thankful to Dr. Jaykant Yadav for helping with amyloid preparation. TKR thanks to Prof. R. T. Pardasani, CU Rajasthan; CMSD, University of Hyderabad for computational support and Central University of Jammu for the infrastructural facilities and for supporting this work through grant CUJ/Acad/Proj-PHY/2017/97. L.M.M. acknowledges research funding from NIH (R01GM114588) and the Alzheimer’s Association (NIRG 12-259199). AKS is DST-INSPIRE faculty awardee. The paper is dedicated to the memories of Dr. Sunil G. Naik.
Appendix A. Supplementary data
Supplementary data associated with this article can be found, in the online version, at https://doi.org/10.1016/j.ica.2017.11.029.
References
- 1.(a) Jakob-Roetne R, Jacobsen H. Angew Chem Int Ed. 2009;48:3030–3059. doi: 10.1002/anie.200802808. [DOI] [PubMed] [Google Scholar]; (b) Beck MW, Derrick JS, Kerr RA, Oh SB, Cho WJ, Lee SJC, Ji Y, Han J, Tehrani ZA, Suh N, Kim S, Larsen SD, Kim KS, Lee JY, Ruotolo BT, Lim MH. Nat Commun. 2016;7:13115. doi: 10.1038/ncomms13115. [DOI] [PMC free article] [PubMed] [Google Scholar]
- 2.(a) Cappai R, Barnham K. Neurochem Res. 2008;33:526–532. doi: 10.1007/s11064-007-9469-8. [DOI] [PubMed] [Google Scholar]; (b) Kepp KP. Chem Rev. 2012;112:5193–5239. doi: 10.1021/cr300009x. [DOI] [PubMed] [Google Scholar]; (c) Sharma AK, Pavlova ST, Kim J, Finkelstein D, Hawco NJ, Rath NP, Kim J, Mirica LM, Kim J. Am Chem Soc. 2012;134:6625–6636. doi: 10.1021/ja210588m. [DOI] [PMC free article] [PubMed] [Google Scholar]
- 3.(a) Faller P, Hureau C. Dalton Trans. 2009:1080–1094. doi: 10.1039/b813398k. [DOI] [PubMed] [Google Scholar]; (b) Barnham KJ, Masters CL, Bush AI. Nat Rev Drug Disc. 2004;3:205–214. doi: 10.1038/nrd1330. [DOI] [PubMed] [Google Scholar]; (c) Rodríguez-Rodríguez C, Telpoukhovskaia M, Orvig C. Coord Chem Rev. 2012;256:2308–2332. [Google Scholar]
- 4.(a) Sharma AK, Pavlova ST, Kim J, Kim J, Mirica LM. Metallomics. 2013;5:1529–1536. doi: 10.1039/c3mt00161j. [DOI] [PMC free article] [PubMed] [Google Scholar]; (b) Zhang Y, Rempel DL, Zhang J, Sharma AK, Mirica LM, Gross ML. Proc Natl Acad Sci. 2013;110:14604–14609. doi: 10.1073/pnas.1309175110. [DOI] [PMC free article] [PubMed] [Google Scholar]; (c) Faller P, Hureau C. Coord Chem Rev. 2012;256:2127–2128. [Google Scholar]
- 5.(a) Bush AI. Curr Opin Chem Biol. 2000;4:184–191. doi: 10.1016/s1367-5931(99)00073-3. [DOI] [PubMed] [Google Scholar]; (b) Bush AI. Trends Neurosci. 2003;26:207–214. doi: 10.1016/S0166-2236(03)00067-5. [DOI] [PubMed] [Google Scholar]; (c) Lynch T, Cherny RA, Bush AI. Exp Gerontol. 2000;35:445–451. doi: 10.1016/s0531-5565(00)00112-1. [DOI] [PubMed] [Google Scholar]; (d) Hureau C, Faller P. Biochimie. 2009;91:1212–1217. doi: 10.1016/j.biochi.2009.03.013. [DOI] [PubMed] [Google Scholar]
- 6.(a) Cherny RA, Atwood CS, Xilinas ME, Gray DN, Jones WD, McLean CA, Barnham KJ, Volitakis I, Fraser FW, Kim YS, Huang XD, Goldstein LE, Moir RD, Lim JT, Beyreuther K, Zheng H, Tanzi RE, Masters CL, Bush AI. Neuron. 2001;30:665–676. doi: 10.1016/s0896-6273(01)00317-8. [DOI] [PubMed] [Google Scholar]; (b) Braymer JJ, DeToma AS, Choi JS, Ko KS, Lim MH. Int J Alzheimers Dis. 2011;2011:623051. doi: 10.4061/2011/623051. [DOI] [PMC free article] [PubMed] [Google Scholar]; (c) Eury H, Bijani C, Faller P, Hureau C. Angew Chem Int Ed. 2011;50:901–905. doi: 10.1002/anie.201005838. [DOI] [PubMed] [Google Scholar]; (d) Bousejra-ElGarah F, Bijani C, Coppel Y, Faller P, Hureau C. Inorg Chem. 2011;50:9024–9030. doi: 10.1021/ic201233b. [DOI] [PubMed] [Google Scholar]
- 7.(a) Sharma AK, Kim J, Prior JT, Hawco NJ, Rath NP, Kim J, Mirica LM. Inorg Chem. 2014;53:11367–11376. doi: 10.1021/ic500926c. [DOI] [PMC free article] [PubMed] [Google Scholar]; (b) Schugar H, Green DE, Bowen ML, Scott LE, Storr T, Bohmerle K, Thomas F, Allen DD, Lockman PR, Merkel M, Thompson KH, Orvig C. Angew Chem Int Ed. 2007;46:1716–1718. doi: 10.1002/anie.200603866. [DOI] [PubMed] [Google Scholar]; (c) Bush AI. J Alzheimers Dis. 2008;15:223–240. doi: 10.3233/jad-2008-15208. [DOI] [PubMed] [Google Scholar]
- 8.Braymer JJ, DeToma AS, Choi JS, Ko KS, Lim MH. Int J Alzheimers Dis. 2011;2011 doi: 10.4061/2011/623051. ID 623051. [DOI] [PMC free article] [PubMed] [Google Scholar]
- 9.Choi JS, Braymer JJ, Nanga RPR, Ramamoorthy A, Lim MH. Proc Natl Acad Sci. 2010;107:21990–21992. doi: 10.1073/pnas.1006091107. [DOI] [PMC free article] [PubMed] [Google Scholar]
- 10.Dedeoglu A, Cormier K, Payton S, Tseitlin KA, Kremsky JN, Lai L, Li XH, Moir RD, Tanzi RE, Bush AI, Kowall NW, Rogers JT, Huang XD. Exp Gerontol. 2004;39:1641–1649. doi: 10.1016/j.exger.2004.08.016. [DOI] [PubMed] [Google Scholar]
- 11.Lipinski CA, Lombardo F, Dominy BW, Feeney PJ. Adv Drug Deliv Rev. 2001;46:3–26. doi: 10.1016/s0169-409x(00)00129-0. [DOI] [PubMed] [Google Scholar]
- 12.Choi JS, Braymer JJ, Park SK, Mustafa S, Chae J, Lim MH. Metallomics. 2011;3:284–291. doi: 10.1039/c0mt00077a. [DOI] [PubMed] [Google Scholar]
- 13.Rodriguez-Rodriguez C, de Groot NS, Rimola A, Alvarez-Larena A, Lloveras V, Vidal-Gancedo J, Ventura S, Vendrell J, Sodupe M, Gonzalez-Duarte P. J Am Chem Soc. 2009;131:1436–1451. doi: 10.1021/ja806062g. [DOI] [PubMed] [Google Scholar]
- 14.Picken MM. Arch Pathol Lab Med. 2010;134:545–551. doi: 10.5858/134.4.545. [DOI] [PubMed] [Google Scholar]
- 15.(a) Hindo SS, Mancino AM, Braymer JJ, Liu YH, Vivekanandan S, Ramamoorthy A, Lim MH. J Am Chem Soc. 2009;131:16663–16665. doi: 10.1021/ja907045h. [DOI] [PMC free article] [PubMed] [Google Scholar]; (b) Choi SR, Golding G, Zhuang Z, Zhang W, Lim N, Hefti F, Benedum TE, Kilbourn MR, Skovronsky D, Kung HF. J Nuc Med. 2009;50:1887–1894. doi: 10.2967/jnumed.109.065284. [DOI] [PMC free article] [PubMed] [Google Scholar]; (c) Choi SR, Schneider JA, Bennett DA, Beach TG, Bedell BJ, Zehntner SP, Krautkramer MJ, Kung HF, Skovronsky DM, Hefti F, Clark CM. Alzheimer Dis Assoc Disord. 2012;26:8–16. doi: 10.1097/WAD.0b013e31821300bc. [DOI] [PMC free article] [PubMed] [Google Scholar]
- 16.Maezawa I, Hong HS, Liu R, Wu CY, Cheng RH, Kung MP, Kung HF, Lam KS, Oddo S, LaFerla FM, Jin LW. J Neurochem. 2008;104:457–468. doi: 10.1111/j.1471-4159.2007.04972.x. [DOI] [PubMed] [Google Scholar]
- 17.Hughes ED, Ingold CK, Ridd JH. J Am Chem Soc. 1958:58–65. [Google Scholar]
- 18.Saylam A, Seferoğlu Z, Ertan N. J Mol Liq. 2014;195:267–276. [Google Scholar]
- 19.(a) Mandal S, Balamurugan V, Lloret F, Mukherjee R. Inorg Chem. 2009;48:7544–7556. doi: 10.1021/ic8018937. [DOI] [PubMed] [Google Scholar]; (b) Bates RG, Paabo M, Robinson RA. J Phys Chem. 1963;67:1833–1838. [Google Scholar]
- 20.Gans P, Sabatini A, Vacca A. Ann Chim. 1999;89:45–49. [Google Scholar]
- 21.Alderighi L. Coord Chem Rev. 1999;184:311–318. [Google Scholar]
- 22.(a) Becke AD. J Chem Phy. 1993;98:5648–5652. [Google Scholar]; (b) Lee CT, Yang WT, Parr RG. Phys Rev. 1988;B 37:785–789. doi: 10.1103/physrevb.37.785. [DOI] [PubMed] [Google Scholar]
- 23.Clark T, Chandrasekhar J, Spitznagel GW, Schleyer PVR. J Comput Chem. 1983;4:294–301. [Google Scholar]
- 24.Weigend F, Ahlrichs R. Phys Chem Chem Phys. 2005;7:3297–3305. doi: 10.1039/b508541a. [DOI] [PubMed] [Google Scholar]
- 25.Tomasi J, Mennucci B, Cammi R. Chem Rev. 2005;105:2999–3094. doi: 10.1021/cr9904009. [DOI] [PubMed] [Google Scholar]
- 26.Castano EM, Ghiso J, Prelli F, Gorevic PD, Migheli A, Frangione B. Biochem Biophys Res Commun. 1986;141:782–789. doi: 10.1016/s0006-291x(86)80241-8. [DOI] [PubMed] [Google Scholar]
- 27.Mancino AM, Hindo SS, Kochi A, Lim MH. Inorg Chem. 2009;48:9596–9598. doi: 10.1021/ic9014256. [DOI] [PubMed] [Google Scholar]
- 28.Storr T, Merkel M, Song-Zhao GX, Scott LE, Green DE, Bowen ML, Thompson KH, Patrick BO, Schugar HJ, Orvig C. J Am Chem Soc. 2007;129:7453–7463. doi: 10.1021/ja068965r. [DOI] [PubMed] [Google Scholar]
- 29.(a) Mukherjee A, Lloret F, Mukherjee R. Inorg Chem. 2008;47:4471–4480. doi: 10.1021/ic701283b. [DOI] [PubMed] [Google Scholar]; (b) Rajput A, Sharma AK, Barman SK, Koley D, Steinert M, Mukherjee R. Inorg Chem. 2014;53:36–48. doi: 10.1021/ic401985d. [DOI] [PubMed] [Google Scholar]
- 30.Ariafard A, Hyland CJT, Canty AJ, Sharma M, Brookes NJ, Yates BF. Inorg Chem. 2010;49:11249–11253. doi: 10.1021/ic1020912. [DOI] [PubMed] [Google Scholar]
- 31.Sharma AK, Mukherjee R. Inorg Chim Acta. 2008;361:2768–2776. [Google Scholar]
- 32.Stryer L. J Mol Biol. 1965;13:482–495. doi: 10.1016/s0022-2836(65)80111-5. [DOI] [PubMed] [Google Scholar]
- 33.Koh M, Lee H, Lee Y, Lee M. J Nanosci Nanotechnol. 2014;14:8386–8389. doi: 10.1166/jnn.2014.9923. [DOI] [PubMed] [Google Scholar]
Associated Data
This section collects any data citations, data availability statements, or supplementary materials included in this article.


