

Summary
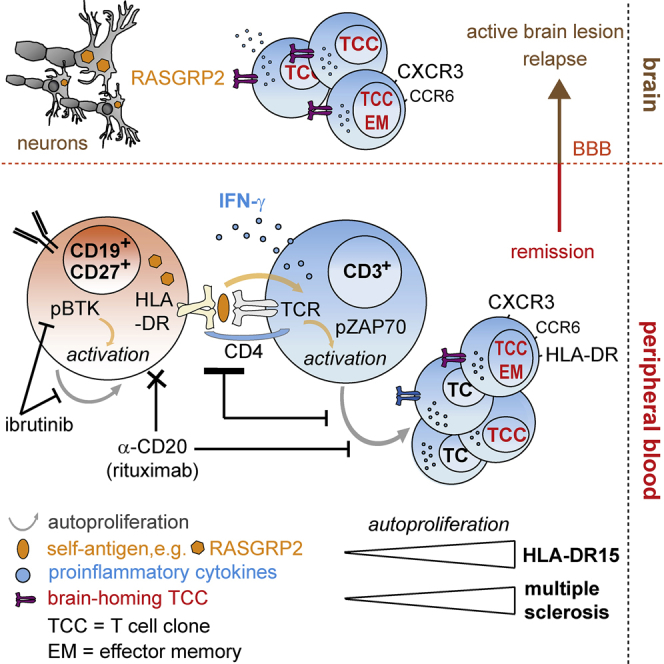
Multiple sclerosis is an autoimmune disease that is caused by the interplay of genetic, particularly the HLA-DR15 haplotype, and environmental risk factors. How these etiologic factors contribute to generating an autoreactive CD4+ T cell repertoire is not clear. Here, we demonstrate that self-reactivity, defined as “autoproliferation” of peripheral Th1 cells, is elevated in patients carrying the HLA-DR15 haplotype. Autoproliferation is mediated by memory B cells in a HLA-DR-dependent manner. Depletion of B cells in vitro and therapeutically in vivo by anti-CD20 effectively reduces T cell autoproliferation. T cell receptor deep sequencing showed that in vitro autoproliferating T cells are enriched for brain-homing T cells. Using an unbiased epitope discovery approach, we identified RASGRP2 as target autoantigen that is expressed in the brain and B cells. These findings will be instrumental to address important questions regarding pathogenic B-T cell interactions in multiple sclerosis and possibly also to develop novel therapies.
Keywords: multiple sclerosis, B cells, T cells, pathogenesis, HLA-DR15, autoproliferation, brain, T cell receptor, RASGRP2
Graphical Abstract
Highlights
-
•
Autoproliferation of CD4+ T cells and B cells is involved in multiple sclerosis
-
•
The main genetic factor of MS, HLA-DR15, plays a central role in autoproliferation
-
•
Memory B cells drive autoproliferation of Th1 brain-homing CD4+ T cells
-
•
Autoproliferating T cells recognize antigens expressed in B cells and brain lesions
Memory B cells drive proliferation of self-reactive brain-homing CD4+ T cells, which recognize autoantigens expressed in B cells and in brain lesions with target potential in multiple sclerosis.
Introduction
Multiple sclerosis (MS) is considered a prototypic organ-specific autoimmune disease. It mainly affects young adults and approximately 2.5 million people worldwide. Patients often develop impairments of visual, sensory, motor, neurocognitive, and autonomic functions. Its etiology involves a complex genetic trait with >100 quantitative trait loci (Beecham et al., 2013, Sawcer et al., 2011), most importantly the HLA-DR15 haplotype, for which an association with MS has already been described in 1973 (Jersild et al., 1973). Since HLA-class II molecules restrict CD4+ T cells, the genetic association provides a strong argument for the central role of adaptive immunity and CD4+ T cells in MS. Yet, how HLA-DR15 and other risk alleles induce and sustain MS is incompletely understood including the lack of an autoantigen unequivocally associated with MS pathogenesis. Epstein-Barr virus (EBV) infection, low vitamin D3, smoking, and obesity (Olsson et al., 2017) have been identified as environmental risk factors, and genes and environment likely act in concert to trigger an autoimmune reaction against CNS tissue (Dendrou et al., 2015, Sospedra and Martin, 2005).
The vast majority of MS risk-conferring genes including HLA-DR15 are immune function related, while CNS-related genes are remarkably absent (Beecham et al., 2013, Sawcer et al., 2011). Considering data from the animal model of MS, experimental autoimmune encephalitis (EAE) (Dendrou et al., 2015, Goverman, 2009, Sospedra and Martin, 2005), there is now compelling evidence that MS is an autoimmune disease with dysregulated adaptive immunity at its core. Findings from EAE and blood cells of MS patients together with the strong genetic HLA-DR15 association hint at the importance of myelin-reactive CD4+ T cells (Sospedra and Martin, 2005). However, characterization of CNS-infiltrating immune cell populations and experience from B cell-depleting therapies suggest that CD8+ T cells, proinflammatory B cells, and autoantibodies are likely also involved (Dendrou et al., 2015, Hauser et al., 2008, Li et al., 2015, Sospedra and Martin, 2005). A central question is how disease-relevant T and B cells interact.
Starting from MS risk genes involved in T cell activation, differentiation, and homeostasis and the prominent role of HLA-DR15, we searched for experimental systems to approach this issue. The observation that myelin-specific T cell clones can be activated by antigen-presenting cells (APCs) in the absence of exogenous nominal antigen and the involvement of CD4, HLA-class II, and self-peptides provided the basis for such a system (Cai and Hafler, 2007, Kondo et al., 2001). Further, in MS reduced thymic output of T cells (Duszczyszyn et al., 2006, Hug et al., 2003), alterations in T regulatory cells (Carbone et al., 2014), increased T cell proliferation and related signatures (Carbone et al., 2014, Tuller et al., 2013), decreased autologous mixed lymhocyte reaction (AMLR) (Hafler et al., 1985), and reduced T cell receptor (TCR) repertoire diversity (Laplaud et al., 2004, Muraro et al., 2005) indicate perturbed T cell homeostasis. In distinction to the defective AMLR, which was shown to be altered not only in MS, but also in other autoimmune diseases like rheumatoid arthritis already three decades ago (Kitas et al., 1988) and which remained unexplained, we recently showed that spontaneous in vitro T cell proliferation is increased in MS patients (Mohme et al., 2013). We refer to this phenomenon as “autoproliferation” (AP). The HLA-DR15 haplotype and DR15-presented self-peptides take part in this process (Mohme et al., 2013), but which cells induce and maintain T cell proliferation and whether AP T cells may be pathogenic are unknown. Here, we characterized in detail the cellular interactions that lead to increased AP and provide evidence for its potential involvement in MS.
Results
AP Increases during Remission
Based on the increased AP in MS patients using thymidine incorporation (Mohme et al., 2013), we developed a carboxyfluorescein diacetate N-succinimidyl ester (CFSE)-labeling protocol, which allows characterization of AP (CFSEdim) and non-proliferating (CFSEhi) cell populations (Figure 1A) and correlates well with thymidine incorporation (Figure S1A). It is important to note that we cultured peripheral blood mononuclear cells (PBMCs) without stimulus and under serum-free conditions. With this assay, we examined AP in a first cohort of 32 healthy donors (HDs) and 50 untreated relapsing-remitting MS (RRMS, nihil) patients (Table S1). 24.1% of AP cells were B cells (CD19+), 43.6% T cells (CD3+), with a higher proportion of CD4+ than CD8+ T cells, and 32.3% unknown cells (Figures 1B, 1C, S1B, and S1C). AP T cells showed an effector memory and highly activated phenotype with strong upregulation of surface HLA-DR with increasing cycles of division (Figures 1D and 1E). Similar to our previous study (Mohme et al., 2013), we confirmed a higher frequency of individuals with stronger AP in the MS group as compared to HDs and also to two other organ-specific autoimmune diseases, psoriasis or Crohn’s disease (Figure 1F). Interestingly, when the AMLR was investigated in psoriasis and Crohn’s disease, it also did not differ from HDs (Davidsen and Kristensen, 1986, Schopf et al., 1986), while it is defective in MS (Hafler et al., 1985).
Figure 1.

AP of Peripheral Lymphocytes Increases during REM and Depends on CD4-HLA-DR-TCR Interactions
(A) Workflow for assessing AP in vitro using CFSE-labeled PBMCs in serum-free medium and in the absence of exogenous stimulus for 7 days.
(B) Proportion of B and T cells among CFSEdim (AP) cells (mean; n = 82 RRMS and HDs).
(C–E) CD4/CD8 ratio of T cells (C), naive/memory (D), and activated HLA-DR-expressing (E) CD4+ and CD8+ T cells in CFSEhi, CFSEmid, and CFSElow cells (n = 20 RRMS and HDs; in C and E, whiskers: min-max; in D, mean). T cell subsets: Tnaive CD45RA+CCR7+; TCM CD45RA–CCR7+; TEM CD45RA–CCR7–; TTEMRA CD45RA+CCR7–.
(F) AP of HDs (n = 32) and untreated patients with RRMS (n = 50), psoriasis (n = 10), and Crohn’s disease (CD; n = 7) (mean ± SEM).
(G and H) Frequency of all (CFSEdim) (G) or only high (CFSElow) (H) AP cells for HDs (n = 32), untreated RRMS patients in relapse (REL; n = 18) or remission (REM; n = 32) (mean ± SEM; Kruskal-Wallis test).
(I) AP in HLA-DR15− and DR15+ HDs (n = 32), REL (n = 18), and REM (n = 32) (mean ± SEM; Kruskal-Wallis test).
(J) Frequency of AP CD4+ and CD8+ T cells in HLA-DR15− (n = 15) and DR15+ (n = 17) REM (mean ± SEM; Mann-Whitney U test).
(K) AP of T cells upon blocking HLA-DR, CD4, or with isotype controls (mean ± SEM; n = 5 REM; Mann-Whitney U test).
(L) Phosphorylation of CD3ζ and ZAP-70 in AP T cells. Representative example out of 3 REM are shown.
(M) AP of T cells with and without treatment with the selective LCK inhibitor PP1 (mean ± SEM; n = 4 REM; Mann-Whitney U test).
See also Figures S1 and S2 and Tables S1, S2, and S3.
Figure S1.

Effector Memory T Cells Enrich in the Autoproliferating Compartment of RRMS Patients in Remission Independent of the Rounds of Cell Divisions, Related to Figure 1 and Table S1
(A) Cell proliferation measured by CFSE-labeling (CFSEdim) was compared to thymidine incorporation assay using the same donors and equal amounts of PBMCs and incubating for 7 days in serum-free medium and absence of exogenous stimulus (Spearman’s rank correlation test).
(B and C) Gating strategy of CFSE-labeled cells after 7 days of AP, analyzed by flow cytometry. (B) Gating on singlets, live- and then on CFSEdim cells including all cell divisions (div.), CFSEmid including 1-2 divisions, CFSElow including more than 2 divisions, or non-proliferating resting cells (CFSEhi). (C) Exemplary cell subset phenotyping of the CFSEdim, CFSEmid, CFSElow and CFSEhi cell compartment showing increasing HLA-DR expression with increasing proliferation.
(D) Frequency of AP T cells (CFSEdimCD3+) for each HD (n = 32), untreated RRMS in relapse (REL; n = 18) and RRMS in remission (REM; n = 32) (mean ± SEM; Kruskal-Wallis test).
(E) CD4/CD8 ratio in the CFSEdimCD3+ compartment of HD (n = 32) and REM (n = 32) (whiskers: min - max). Dotted line at ratio of 1 indicates equal distribution of CD4+ and CD8+ T cells.
(F and G) Ratio of naive/memory cell subset frequency in CFSEdim versus CFSEhi compartment of (F) CD4+ and (G) CD8+ T cells respectively is shown for HD (n = 15) and REM (n = 24) (whiskers: min - max; Mann-Whitney U test). A ratio of 1 (dotted line) indicates an equal proportion of the appropriate T cell subset in the CFSEdim and CFSEhi compartment. T cell subsets: Tnaive CD45RA+CCR7+; TCM CD45RA-CCR7+; TEM CD45RA-CCR7-; TTEMRA CD45RA+CCR7-.
Next, we explored the association between AP in HDs and RRMS disease stages, i.e., active (relapse; REL, nihil) or inactive (remission; REM, nihil). Interestingly, we observed higher frequencies of AP cells independent of the rounds of cell division in REM compared to HDs and REL, as well as increased frequencies of AP effector memory T cells in REM compared to HDs (Figures 1G, 1H, and S1D–S1G). We confirmed these results in a second cohort comparing AP with other methods of B or T cell activation in HDs and REM. In contrast to AP and α-immunoglobulin M (IgM) stimulation, T cell activation by a foreign recall antigen (tetanus toxoid), allogeneic mixed lymphocyte reaction (MLR) or phytohemagglutinin (PHA) did not differ between HDs and REM (Figure S2A).
Figure S2.

IFN-γ Secretion Is Strongly Increased during AP in RRMS (REM) but Is Not the Cause of Increased AP, Related to Figures 1 and 2 and Table S1
(A) A second cohort of HD (n = 14; for PHA n = 10) and REM (n = 14; for PHA n = 12) was used to assess AP (unstimulated) and reactivities to conventional B- (α-IgM) or T cell stimulation with polyclonal/broad (MLR, PHA) or antigen-specific (TTx) activation using CFSE-labeling and subsequent co-culture for 7 days in serum-free medium. Frequency of all proliferating (CFSEdim) cells for each HD and REM under the different conditions is depicted (mean ± SEM; Mann-Whitney U test).
(B) Secretion of Th1 (IL-2, TNF, IFN-γ), Th2 (IL-4, IL-5, IL-13) and Th17 (IL-17A, IL-21, IL-22) cytokines in supernatants collected after 7 days of AP (no stimulus), conventional B- (α-IgM) or T cell stimulation with polyclonal (MLR) or antigen-specific (TTx) activation from HD (n = 14) and REM (n = 14; for TTx n = 13) (mean ± SEM; Mann-Whitney U test).
(C) Levels of IFN-γ and GM-CSF secretion in HLA-DR15-and DR15+ HD (DR15- n = 20 and DR15+ n = 12) and REM (DR15- n = 15 and DR15+ n = 17; whiskers: min - max). Cytokine measurement was performed with bead-based immunoassay and GM-CSF by ELISA.
(D) Frequency of CFSEdim cell population (gray bars) in the presence of blocking IFN-γ, blocking GM-CSF or appropriate isotype control antibodies (mean ± SEM; n = 5 REM). Cytokine neutralization (blue line) in supernatant is depicted exemplarily for one of the donors.
HLA-DR-TCR Interactions Are Essential for AP
In line with our previous data (Mohme et al., 2013), HLA-DR15+ HDs and REM showed increased AP (Figure 1I). Further, we now found that AP CD4+ but not CD8+ T cells are increased in HLA-DR15+ compared to HLA-DR15− REM (Figure 1J). Given the multifactorial etiology of MS, we genotyped REM and HDs to examine 134 published non-HLA MS risk-associated SNPs (Beecham et al., 2013, Sawcer et al., 2011) and compared their effect to that of HLA-DR15 on AP. Probably due to the small sample size, our results do not support a significant contribution neither for single MS risk SNPs nor for a MS risk score derived from 102 of these risk variants, yet confirmed a significant association between HLA-DR15 and AP (Table S2 and Table S3).
The strong upregulation of HLA-DR on B cells during AP (Mohme et al., 2013) and the above association with the HLA-DR15 haplotype indicated that interactions between HLA-DR on B cells and TCR/CD4 on T cells might be involved in AP. This was confirmed by the strong inhibitory effects of antibody blocking of both HLA-DR as reported previously (Mohme et al., 2013), but also of CD4 (Figure 1K). Phosphorylation of the TCR-associated CD3 zeta chain (CD3ζ) and the CD3 zeta chain-associated protein 70 (ZAP-70) in AP T cells (Figure 1L) as well as the involvement of lymphocyte-specific protein tyrosine kinase (LCK) (Figure 1M) show that TCR and self-peptide/HLA-class II interactions participate in inducing and/or sustaining AP.
Classical and Non-classical Th1 Cells Are Involved in AP
Next, we addressed which functional phenotypes are involved in increased AP in REM. Culture supernatants after AP contained particularly high amounts of interferon (IFN)-γ, increased interleukin-2 (IL-2), IL-13, IL-21, and granulocyte-macrophage colony-stimulating factor (GM-CSF) in REM compared to HDs and either low or absent IL-5 and IL-17 (Figure 2A). In contrast to AP, IFN-γ secretion upon activation with conventional T cell stimuli did not differ between HDs and REM (Figure S2B). IFN-γ correlated best with AP (Figure 2A) and was higher in HLA-DR15+ individuals (Figure S2C). Cytokines dropped after blocking either HLA-DR or CD4, whereas in vitro neutralization of IFN-γ and GM-CSF did not inhibit AP indicating that cytokine production is a consequence of AP (Figures 2B and S2D).
Figure 2.

AP Involves Classical and Non-classical Th1 Cells with Increased Proinflammatory Responses in MS
(A) AP (% CFSEdim) and cytokine secretion profile for each donor (n = 32 HDs; n = 32 REM) after 7-day culture. Subject values are organized according to their AP strength. The graphs under the heatmap represent the mean cytokine secretion in supernatants (mean ± SEM; Mann-Whitney U test).
(B) Mean cytokine response following AP in the presence of blocking HLA-DR, CD4, or isotype controls (n = 5 REM).
(C) Intracellular IFN-γ and phosphorylation of STAT1 in CFSEhi and CFSEdim (AP) T cells. Representative example out of 5 REM.
(D) Proportion of CD4 and CD8 subsets in AP IFN-γ+ T cells (mean ± SEM; n = 5 REM; Mann-Whitney U test).
(E) RNA sequencing data of sorted CFSEhi and CFSEdim (AP) CD4+ T cells (n = 5 REM) for Th1, Th2, and Th17 gene sets, each defined by 17 subset-specific genes. MKI67 served as control transcript for proliferation. The differential expression shows only significantly upregulated genes (log2 >1.0; false discovery rate [FDR] <0.01) in AP CD4+ T cells and is expressed by the z-score based on the reads per kilobase million (RPKM) values. Th gene sets were tested for significance (Fisher test).
(F) Distribution of classical Th1 (CXCR3+CCR6–), non-classical Th1 (CXCR3+CCR6+), and Th17 (CXCR3–CCR6+) cells in the CFSEhi and CFSEdim compartment, exemplarily shown for AP, MLR, and PHA in one donor and as mean for AP in HDs (n = 9) and REM (n = 13).
Intracellular cytokine staining confirmed that AP CD4+ T cells mainly express IFN-γ and, consistent with a Th1 phenotype, also show STAT1 signaling (Figures 2C and 2D). The predominant proinflammatory Th1-like phenotype in AP CD4+ T cells of REM is supported by RNA sequencing, which shows significant upregulation of Th1-specific markers such as TBX21 (T-bet), CXCR3, and IFNG (Figure 2E). Th2 and Th17 markers such as GATA3, IL4 or RORC, and IL17A were absent or not differentially expressed, but other Th17-specific markers such as AHR and BATF as well as CSF2 (GM-CSF) were upregulated. In line with these findings, we observed high frequencies of CXCR3+ CD4+ T cells expressing the Th17-associated chemokine receptor CCR6 in the AP compartment (Figure 2F), referred to as non-classical Th1 cells (i.e., Th1/Th17 or exTh17-Th1) (Geginat et al., 2013). These cells were shown to be polyfunctional and increased in MS (Paroni et al., 2017), and both chemokine receptors, CXCR3 and CCR6, are involved in brain homing of T cells (Balashov et al., 1999, Reboldi et al., 2009). Consistent with in vivo results (Basdeo et al., 2017), we observed higher AP in classical and non-classical Th1 cells (Figure 2F). Whether expression of Th17-specific markers and GM-CSF marks a distinct T helper cell subset (Geginat et al., 2013, Hartmann et al., 2014) originating from Th17 cells or is part of pathogenic Th1 differentiation is currently not clear, but our findings underscore that IFN-γ-secreting Th1-like cells are the most prominent T cell subset in this setting.
B-T Cell Interaction via HLA-DR Promotes AP
Regarding the APCs that induce/support AP, B cells appeared to be particularly interesting candidates, since they upregulate HLA-DR expression (Mohme et al., 2013) and are present in substantial numbers in the AP compartment (Figures 1B and S3A) and due to their emerging role in MS (Krumbholz et al., 2012). Indeed, we noticed a significant correlation of B and T cell AP, whereas other conventional stimuli shifted to B or T cell proliferation, respectively (Figures 3A, 3B, and S3A). AP of both B and T cells was higher in REM and HLA-DR15+ individuals (Figures 3A and 3C). The reduced T cell AP and IFN-γ secretion after B cell depletion and physical separation of B from T cells hint at a central role of B cells in triggering and/or sustaining T cell AP via direct cell-cell interaction (Figure 3D). We then addressed whether B cells activate and maintain AP CD4+ T cells more efficiently in REM compared to HDs. Autologous co-cultures of EBV-transformed B cells with expanded AP T cells of HLA-DR15+ HDs and REM showed that AP CD4+ T cells are maintained and activated much more efficiently in the absence of an exogenous stimulus in REM than in HDs (Figures S3B–S3D).
Figure S3.

B Cells Participate in AP and Maintain and Drive AP T Helper Cells in MS, Related to Figure 3 and Table S1
(A) Proportion of CD3+ and CD19+ cells (pie charts) in the CFSEdim compartment of HD (n = 14; for PHA n = 10) and REM (n = 14; for PHA n = 12) after AP (unstimulated) and reactivities to conventional B- (α-IgM) or T cell stimulation with polyclonal/broad (MLR, PHA) or antigen-specific (TTx) activation using CFSE-labeling and subsequent co-culture for 7 days in serum-free medium.
(B–D) Sorted and subsequently expanded (PHA, IL-2) AP cells (CFSEdim) from DR15+ HD and REM were tested for their reactivity on autologous EBV-transformed B cells. For the co-culture experiments, we incubated 2x10⁵ CFSE-labeled expanded bulk T cells either alone or with 5x10⁵ irradiated (300 Gy) autologous EBV-transformed B cells in the absence of any stimulus or the presence of blocking HLA-DR (L243) antibody or PHA, respectively. After 72 hours, 4 replicate wells of each condition were pooled and analyzed for survival (live-dead marker) and proliferation (CFSE) by flow cytometry. Cells were gated first on CD4+ T cells to exclude B cells, prior to analysis of live cells and then on proliferating cells. (B) Exemplary dot plots of the different conditions shown for one HD and one REM. (C) Survival and (D) proliferation results of DR15+ HD (n = 5) and REM (n = 5) (mean ± SEM).
Figure 3.

B-T Cell Interaction Promotes AP in a HLA-DR- and BTK-Dependent Manner
(A) Correlation and frequency of AP B and T cells in HDs (n = 32) and RRMS (n = 18 REL; n = 32 REM; Spearman’s rank correlation test).
(B) T/B cell ratio in the proliferating compartment after AP, MLR, or α-IgM stimulation (HDs, n = 14; REM, n = 14; whiskers: min-max).
(C) AP B cells in HLA-DR15− (n = 15) and DR15+ (n = 17) REM (mean ± SEM).
(D) AP and IFN-γ secretion of T cells without or after depletion of B cells (W) and after separation of B cells into transwells (T) (mean ± SEM; CFSE: n = 6 REM; IFN-γ: n = 5 REM; Kruskal-Wallis test).
(E) Distribution of B cell subsets (Bnaive CD27–IgD+; BUSM CD27+IgD+; BSM CD27+IgD–; BDN CD27–IgD–) in CFSEhi and AP CFSEdim (mean; n = 8 REM).
(F) HLA-DR expression of CFSEhi and AP CFSEdim B cells (mean ± SEM; n = 18 REM; Mann-Whitney U test).
(G) Sorting of CFSEhi and CFSEdim B cells following AP, incubation with control or HLA-DR-blocking antibodies and transfer into B cell-depleted and CFSE-labeled autologous PBMCs. Proliferation and activation of CD4+ T cells were assessed after 7 days of stimulus-free co-culture (mean ± SEM; n = 3 REM).
(H) AP of B and CD4+ T cells in the presence of isotype control or α-CD40-blocking antibody. Representative example out of 3 REM is shown.
(I) AP of B and CD4+ T cells upon addition of the selective BTK inhibitor ibrutinib or vehicle (DMSO) control (left graph). Right graph shows the HLA-DR expression (line) and survival (numbers) of B cells (mean ± SEM; n = 3 REM).
(J) Phosphorylation of BTK in AP B cells. Representative example out of 3 REM is shown.
Given the strong correlation of AP B and T cells, we examined the relationship between AP B and T cells further. AP B cells predominantly show a memory phenotype and increased expression of HLA-DR; i.e., they are in an activated status, when compared to CFSEhi B cells (Figures 3E and 3F). Transfer of autologous AP (CFSEdim) memory B cells led to strong activation and AP of CD4+ T cells in a HLA-DR-dependent manner (Figure 3G). Based on these observations, we searched for factors that drive AP of memory B cells. Whereas AP of B cells was independent of bystander activation via CD40 (Figure 3H), it was almost abrogated by ibrutinib, a selective BTK inhibitor (Figure 3I). Addition of ibrutinib did not alter the survival of B cells but caused a decrease in HLA-DR expression on B cells accompanied by a drop of T cell AP (Figure 3I). BTK is important for B cell receptor signaling, B cell maturation, and proliferation but also other pathways, such as MHC-class II and Toll-like receptor (TLR) signaling (Pal Singh et al., 2018). Interestingly, BTK inhibitors are in development for several autoimmune diseases including MS (Mullard, 2017). The role of BTK activation in AP is further supported by phosphorylation of BTK (Figure 3J) suggesting that the activation of memory B cells involves BTK signaling and drives AP of CD4+ T cells via interaction with HLA-DR.
Memory B Cells Drive AP of T Helper Cells
B cell depletion with anti-CD20 antibodies very effectively reduces MS relapses suggesting an important role of B cells (Hauser et al., 2008). The clinical effects of anti-CD20 therapies cannot be explained by reduction of autoantibodies as their main mechanism of action (Hauser et al., 2008, Krumbholz et al., 2012). B cell depletion may, however, reduce the production of proinflammatory cytokines by B cells, which is increased in MS (Li et al., 2015), and/or their antigen presenting function via MHC-class II (Molnarfi et al., 2013). To explore how in vivo alterations of circulating B cells under MS treatments affect AP, we analyzed patients treated with rituximab (RTX), which depletes B cells (Hauser et al., 2008), natalizumab (NAT), which blocks lymphocyte migration to the brain (Yednock et al., 1992) and increases circulating memory and marginal zone B cells (Planas et al., 2012), and fingolimod (FTY), which traps naive and central memory T cells in lymph nodes (Brinkmann et al., 2010) and reduces circulating B cells. As expected, circulating B cells were absent in RTX-treated patients, reduced under FTY and increased under NAT (Figure 4A). Consistent with our above in vitro data, RTX strongly reduced AP of T cells and proinflammatory cytokine responses, FTY led to a minor reduction and NAT to a strong increase (Figures 4B and S4A). IFN-γ production also correlated with the frequency of AP T cells (Figure 4C). The strong reduction of in vitro AP T cells raised the question of whether B cell depletion would also affect peripheral T cell numbers in RTX-treated patients in vivo. T cell counts indeed dropped under RTX (Figure 4D). Further, we found significantly lower frequencies of activated effector memory CD4+ T cells ex vivo following RTX treatment (Figures 4E and 4F). Of note, the addition of autologous CD20+ B cells obtained pre-therapy to samples collected after RTX treatment restored CD4+ T cell AP (Figures S4B–S4E). Even though depletion of B cells abrogated AP of T cells, PBMCs of RTX-treated patients showed normal numbers of monocytes and mounted normal responses to a recall antigen excluding a general unresponsiveness of T cells (Figures S4F and S4G).
Figure 4.

In Vivo B Cell Depletion Reduces Memory B Cell-Induced Activation of T Helper Cells
(A and B) Frequency of B cells (A) and AP T cells (B) in REM (nihil; black; n = 32) and RRMS patients under rituximab (RTX; green; n = 14), natalizumab (NAT; blue; n = 15), or fingolimod (FTY; orange; n = 10) treatment (mean ± SEM; Kruskal-Wallis test).
(C) Correlation between IFN-γ secretion and AP T cells (Spearman’s rank correlation test).
(D) Ex vivo T cell counts in fresh blood of MS patients before (baseline) and after RTX therapy (n = 179; whiskers: min-max; Wilcoxon matched-pairs signed-rank test).
(E and F) Ex vivo frequency of naive/memory (E) and activated (F, left) CD4+ T cells in fresh blood of RRMS patients before (REM, nihil) and after RTX treatment. Right panel (F) shows the distribution of naive/memory subsets in activated CD4+ T cells before RTX (E and F: n = 9; whiskers: min-max; Wilcoxon matched-pairs signed-rank and Kruskal-Wallis test).
(G) Correlation between AP T cells and ex vivo peripheral B cell subsets in REM (n = 27; Spearman’s rank correlation test).
(H) AP and activation of CD4+ T cells upon transfer of CD27– naive and CD27+ memory B cells of MS patients before RTX to CFSE-labeled autologous PBMCs from time point of RTX therapy. B cells were incubated with isotype control or HLA-DR-blocking antibodies before transfer (mean ± SEM; n = 7; Wilcoxon matched-pairs signed-rank test for naive versus memory and mIgG2a versus α-HLA-DR).
(I) Distribution of ex vivo peripheral B cell subsets in REM (n = 27), REL (n = 10), and NAT (n = 10).
(J) Sorted naive and memory B cells were co-cultured with autologous CFSE-labeled CD4+ T cells to assess AP and activation of CD4+ T cells after 7 days (mean ± SEM; n = 4 REM; Kruskal-Wallis test).
Figure S4.

B Cell Depletion Reduces AP and Proinflammatory Cytokine Response, whereas Response to Control Antigen Remains, Related to Figure 4 and Table S1
(A) Secretion of Th1 (IL-2, IFN-γ), Th2 (IL-5, IL-13), Th17 (IL-17A, IL-21) cytokines and GM-CSF in supernatants collected after 7 days of AP from untreated and treated RRMS patients (REM, nihil, black, n = 32; RTX, green, n = 14; NAT, blue, n = 15; FTY, orange, n = 10; mean ± SEM; Kruskal-Wallis test).
(B–E) CFSE-labeled PBMCs of MS patients before onset of (M0 = month 0) and after RTX treatment (M3 = 3 months) as well as conditions with deletion and transfer of CD20+ cells from PBMCs before onset of RTX (M0) to autologous PBMCs after RTX therapy (M3) were cultured for 7 days in the absence of exogenous stimulus. Samples were analyzed for the frequency of (B) B cells (C) AP T cells, (D) activated HLA-DR+CD4+ T cells and (E) IFN-γ secretion (mean ± SEM; n = 5; Kruskal-Wallis test).
(F) Ex vivo frequency of monocytes and B cells in longitudinal RTX MS samples (mean ± SEM; n = 5; Mann-Whitney U test).
(G) Response of PBMCs from RTX-treated MS patients in 7-day CFSE assay without antigen or in presence of tetanus toxoid (TTx) as control antigen by assessing frequency of proliferating CFSEdim and proliferating T cells (mean ± SEM; n = 5; Mann-Whitney U test).
Naive B cell numbers correlated negatively, while memory and particularly unswitched memory B cells correlated positively with the frequency of AP T cells, suggesting that AP of T cells primarily depends on memory B cells (Figure 4G). Indeed, transfer of autologous memory B cells obtained at baseline to samples collected during RTX treatment increased AP and CD4+ T cell activation compared to transfer of naive B cells. This increase was dependent on HLA-DR on memory B cells (Figure 4H). In line with this and also the magnitude of AP, we observed lower memory B cell frequencies ex vivo in REL in contrast to an increase following NAT therapy, both in comparison to REM (Figure 4I). Importantly, memory but not naive B cells promoted AP and CD4+ T cell activation directly upon co-culturing B and T cells alone (Figure 4J).
AP T Cells Are Enriched for Brain-Homing Cells
The increase of AP with NAT therapy may not only be due to the increase in peripheral memory B cells but also because NAT traps brain-homing cells in the peripheral blood. This conclusion is supported by the reduced AP during clinical MS relapses, i.e., when pathogenic cells presumably have migrated to the brain, and may explain why MS patients often show strong rebound of disease activity when NAT treatment is stopped (Sorensen et al., 2014). To examine this issue, we compared the TCR beta chain variable gene (TCRVβ) sequences in peripheral AP T cells and in brain lesion-infiltrating T cells of two MS patients (Figure 5A; Table S4; Table S5), from whom brain lesions (autopsy) or brain-infiltrating cells (biopsy) were available (Planas et al., 2015, 2018). In two independent experiments in patient 1, we identified a substantial overlap (17.4%– 29.9%) of identical productive TCRVβ rearrangements between AP (CFSEdim) and brain lesions compared with a low overlap (2.6%–4.8%) between non-proliferating T cells (CFSEhi) and brain lesions (Figures 5B and S5A–S5C). In patient 2, we also found greater overlap between AP T cells and brain-infiltrating cells (7.2%) compared to non-proliferating T cells (1.4%) albeit at a lower percentage (Figure 5C). Among the shared TCRVβ sequences, we identified approximately two-thirds of the sequences from the AP compartment also in resting CFSEhi cells, yet at much higher frequency in CFSEdim cells (Figure 5B, left graphs under pie charts). Presumably due to the larger clone-set size in CFSEhi versus CFSEdim cells, we found more brain-matching unique TCRVβ sequences in the CFSEhi cells, however, overall at lower frequencies than the shared unique TCRVβ sequences in the AP compartment (Figure 5B, right graphs under pie charts). Interestingly, TCR clonotypes, which we identified in peripheral AP T cells, were among the most clonally expanded in the brain (Figures S5D and S5E; Table S5).
Figure 5.

Peripheral Blood-Derived TCCs Undergoing AP Are Frequently Found in MS Brain Lesions
(A) TCRVβ repertoire of the AP compartment and TCCs generated thereof were compared with the corresponding brain infiltrate of two MS patients.
(B and C) Frequency overlap of unique productive TCRVβ sequences in peripheral CFSEhi (red) and CFSEdim (AP, purple) with TCRVβ sequences in the MS brain lesions (B; MS patient 1, experiment B) or the brain infiltrate (C; MS patient 2) represented by pie charts. Box-and-whisker plots indicate the distribution and frequency of all TCRVβ sequences from the respective peripheral cell compartments. Shared TCRVβ sequences in the brain infiltrate that were found also in both (left graph) or uniquely (right graph) in one of the two CFSE compartments are depicted by dots. The number (n) of total unique (gray) and the number as well as frequency overlap of shared TCRVβ sequences of the CFSEhi (red) and CFSEdim (purple) compartment are shown.
(D and E) Overlap of TCRVβ sequences upon normalization of the shared and total clone-set sizes that were compared with each other. The calculated value is given as arbitrary unit (AU) and was performed based on the TCRVβ sequences in the clone sets of MS patient 1 and 2 (D), and on the TCRVβ sequences that were matching with either peripheral blood memory (CD45RO+) CD4+ (red) or CD8+ (blue) T cells of MS patient 1 (E).
See also Figures S5 and S6 and Tables S4 and S5.
Figure S5.

Similar High-Frequency Overlap of Shared TCRVβ Sequences between AP Cells and Brain Lesions in Two Independent Experiments Despite Diverse TCRVβ Repertoire, Related to Figure 5 and Tables S4 and S5
(A) Comparison of unique productive TCRVβ sequences and their frequencies in CFSEhi and CFSEdim cells from the two independent CFSE experiments A and B of peripheral blood in MS patient 1.
(B and C) Overlap of productive TCRVβ sequences of the (B) CFSEhi and (C) CFSEdim compartment from peripheral blood with brain infiltrates of three MS lesions in two independent experiments of patient 1.
(D and E) Graphs show the frequency of productive TCRVβ sequences in the isolated CFSEdim cell population (AP) of MS patient 1 in the two independent experiments (D) A and (E) B. The graph is plotted with the TCRVβ-chain against the J-chain families. Red bars indicate TCRVβ sequences present in the CFSEdim compartment that match with TCRVβ sequences in brain lesions. The boxes refer to the red bars and depict the frequency of shared TCRVβ sequences in the CFSEdim compartment as well as their frequency and appearance in the different brain lesions. The data from experiment B (MS patient 1) was used for the analyses in Figure 5.
Since the clone-set sizes of the different cell compartments differed, and the number of shared TCRVβ sequences is influenced by this factor (Zvyagin et al., 2014) (Figure S6A), we corrected the numbers of shared brain-matching unique productive TCRVβ sequences in AP and non-proliferating cells for their clone-set sizes, i.e., the numbers of total unique productive TCRVβ sequences. Thereupon, we identified not only a higher overlap of the AP compartment with all brain lesions, but particularly with the highly active brain lesion LIII (Figure 5D) (Planas et al., 2015). In the AP compartment, shared TCR sequences were found in peripheral memory CD4+ and CD8+ T cells (Figure S6B; Table S5). Normalization for the number of shared TCRVβ sequences showed that AP memory CD4+ T cell clonotypes are preferentially found in the highly active lesion (Figures 5E and S6B). In contrast and in line with another study (Planas et al., 2018), brain-matching AP memory CD8+ T cell clonotypes are among those that are more globally expanded in the non-proliferating compartment as well as in all three lesions, indicating that brain-infiltrating memory CD8+ T cells may be recruited by bystander mechanisms.
Figure S6.

Proliferating CD4+CD45RO+ T Cells Infiltrate Preferentially the High Active Lesion, whereas CD8+CD45RO+ T Cells Are More Globally Expanded, Related to Figures 5 and 6 and Tables S4 and S5
(A) Correlation of the number of shared unique productive TCRVβ sequences in cloneset samples 1 (M) and 2 (N) with the number of unique productive TCRVβ sequences in cloneset sample 1 (M) multiplied by the number of unique productive TCRVβ sequences in cloneset sample 2 (N), in order to normalize the number of shared TCRVβ sequences for the cloneset size (Zvyagin et al., 2014). Correlations were performed for overall TCRVβ sequences and TCRVβ sequences that were identified in the peripheral CD4+CD45RO+ or CD8+CD45RO+ T cell compartment (Spearman’s rank correlation test).
(B) Frequencies of shared unique productive TCRVβ sequences in the AP compartment and the brain lesions of MS patient 1 (experiment B). Colors indicate, which TCRVβ sequences were also identified in the peripheral CD4+CD45RO+ (green) or CD8+CD45RO+ (blue) T cell compartment. Circles correspond to brain-matching TCRVβ sequences which are found in both CFSEhi and CFSEdim cells, and triangles correspond to brain-matching TCRVβ sequences only found in CFSEdim cells. The position of the symbols reflects the corresponding frequency of the TCRVβ sequence inside the AP compartment or the brain lesion.
(C) Brain-homing CD4+ TCCs from the AP compartment of MS patient 1 were analyzed for the expression of the brain-homing receptors CXCR3 and CCR6. Prior to analysis, gates were set on live cells.
AP TCCs Recognize Antigens Expressed in MS Brain Tissue and B Cells
An important question is whether AP involves recognition of specific antigens and whether these are presented by B cells. To examine this issue, we generated T cell clones (TCCs) from the AP cells of MS patient 1 (homozygous for HLA-DR15) and show that brain-homing T cells can in principle be obtained efficiently from PBMCs. 6 out of 12 generated CD4+ TCCs were also present in the highly active brain lesion LIII (Figure 6A). These AP TCCs showed polyfunctional responses with prominent non-classical Th1 or Th2 phenotypes due to high secretion of IFN-γ, GM-CSF, IL-5, and IL-13, respectively, as well as expression of CXCR3 and/or CCR6 (Figures 6A and S6C). The strong secretion of Th2 cytokines is consistent with the predominant Th2 phenotype of brain-infiltrating T cells in this patient (Planas et al., 2015).
Figure 6.

AP TCCs Home to the Brain and Recognize Self-Antigens that Are Expressed in Brain Lesions and B Cells
(A) Brain-homing TCCs isolated from the AP compartment of PBMCs with their corresponding TCRVβ sequence, frequency in the brain lesions, and functional phenotype.
(B) Screening procedure for peptide ligand identification of the AP brain-homing TCC14 (MS patient 1, HLA-DR15+/+) using a positional scanning library. (I) The restriction of the TCC was tested with BLS cells expressing HLA-DR15 alleles (DR2a or DR2b) or DQw6. Subsequently, TCC14 was tested with all combinatorial peptide mixtures using BLS-DR2b cells. Proliferative responses (mean ± SEM; stimulatory index = SI; dotted line SI = 2) were assessed by thymidine incorporation. Mean responses from three experiments were used to generate a matrix for optimal amino acid combinations of a potential peptide ligand. (II) The potential best cognate antigens were then predicted using a transcriptome database from the brain lesions of MS patient 1. (III) The top 92 predicted peptides were tested for reactivity and are shown with one of their corresponding matrix scores.
(C) The stimulatory peptides were tested in decreasing concentrations for the proliferative response of TCC14 (mean ± SEM). Peptides from RASGRP family members are highlighted.
(D) Cytokine response of TCC14 upon stimulation with decreasing concentrations of the RASGRP2 peptide.
(E) Expression level (RPKM) of stimulatory peptide-originating transcripts (e.g. RASGRP1-4) and control transcripts (MOBP, CD19) in the active brain lesion III of MS patient 1 and AP B cells (n = 6 REM). Expression levels under 0.1 or absent were set as 0.1.
(F) Proteome analysis of peripheral blood B cells (n = 4 REM) and brain tissue (gray matter, pooled, n = 6 MS). The protein coverage (columns) and spectral counts (numbers) of RASGRP1-4 are depicted as measure for protein abundance.
We next employed an unbiased approach to identify the target antigen/s of the above TCCs using positional scanning combinatorial peptide libraries and biometrical analysis (Zhao et al., 2001). TCC14 expanded sufficiently to be tested with the full set of 200 positional scanning library mixtures. After determining its HLA-class II restriction (DRB1∗15:01), reactivity against all 200 mixtures was tested and showed positive responses against single or multiple amino acids in each of the 10 positions (Figure 6BI). Using scoring matrices to summarize the reactivity of TCC14 against the decapeptide library after testing multiple doses, we predicted peptides to be recognized by TCC14 using a transcriptome database from the brain lesions of MS patient 1 (Figure 6BII) (Zhao et al., 2001). 92 sequences were synthesized and tested for recognition by TCC14 based upon their appearance in the top 50 predicted peptides for at least one of the matrices used (Figure 6BIII). As we showed previously, there is a good relationship between predicted high ranking and T cell response (Sospedra et al., 2010, Zhao et al., 2001) since TCC14 recognized many of the high scoring peptides. Subsequent dose titration experiments with the 33 peptides that gave positive responses, among them peptides from members of the RAS guanyl releasing protein (RASGRP1–4) family, showed that a peptide from RASGRP2 was recognized with high antigen avidity (EC50 = 0.012 μM) (Figure 6C). Recognition of the RASGRP2 peptide by TCC14 resulted in secretion of Th2 cytokines and also of IFN-γ (Figure 6D). RASGRP1–3 are of particular interest, since they are expressed both in the brain lesion of patient 1, but also in the transcriptome of AP memory B cells (Figure 6E). However, proteomic analysis demonstrated high abundance of only RASGRP2 and not of the other RASGRPs in B cells and brain of MS patients (Figure 6F; Table S6).
RASGRP2 Is Expressed in B Cells and Cortical Gray Matter and Recognized by Memory T Cells
RASGRP2 expression in striatal neurons has been reported (Toki et al., 2001), and here we demonstrate its wide expression in human cortical gray matter and specifically also in neurons (Figure 7A). The latter region is of interest in MS since cortical lesions and neurodegeneration have been related to ectopic lymphoid follicles in the meninges (Magliozzi et al., 2007).
Figure 7.

RASGRP2 Is Expressed in Cortical Neurons and Shows Reactivity for Memory T Cells in MS Patients
(A) First column: HE and RASGRP2 immunohistochemical staining in the occipital lobe of a 53-year-old male patient. Scale bar: 1 mm. Second and third column: RASGRP2 reactivity is present in a punctate pattern (yellow asterisk) in the neuropil of the cortex (Cx) and diffusely throughout the cytoplasm of scattered neuronal cells (black arrow), whereas the white matter (WM) remains negative. Lx, leptomeninges. Scale bars: 100 µm and 10 µm.
(B and C) Lymphocyte composition (B) and AP (C) before and after CD45RA depletion of PBMCs (mean ± SEM; Mann-Whitney U test). Proliferation was assessed by thymidine incorporation.
(D) Proliferative responses of CD45RA-depleted PBMCs (NAT; n = 8) and TCC14 to overlapping 15-mer RASGRP2 peptide pools, covering the sequence of RASGRP2 from N (pool 1) to C terminus (pool 9), to the recombinant RASGRP2 protein, vehicle control (DMSO), and α-CD2/CD3/CD28 stimulation after 7 days. Dots represent replicate wells (NAT: mean ± SEM; TCC14: mean ± SEM of 6 replicate wells). Stimulatory index (SI) = ratio of the response of a given well to the mean response of the vehicle control. A SI >2 is considered as positive response. See also Figure S7 and Table S7.
To assess the immunogenicity of RASGRP2 in MS patients, we tested T cell reactivity to overlapping peptides covering RASGRP2 (Table S7) by fluorospot in PBMCs of HDs, untreated REM, and NAT-treated MS patients (Figures S7A and S7B). We observed a stepwise increase in T cells producing IFN-γ and IL-17 with highest numbers in NAT-treated MS patients. Responses were directed against multiple epitopes of RASGRP2. Of particular interest is the high frequency in NAT-treated MS patients indicating that pathogenic cells are trapped in the periphery. Consistent with this, RASGRP2 responders almost all showed high AP (Figure S7C).
Figure S7.

Th1-Th17 Reactivity to RASGRP2 Is Influenced by AP and Increases Stepwise from HD to REM to NAT, Related to Figures 1, 2, and 7 and Table S7
(A) Fluorospot images in PBMCs with cytokine reactivity (IFN-γ and/or IL-17) to the RASGRP2 peptide pool 1, as compared to the vehicle control. The positive control with anti-CD3 stimulation is included for comparison.
(B) Fluorospot-based cytokine reactivity in PBMCs from HD (n = 11), REM (n = 9) or RRMS patients treated with NAT (n = 20). Number of IFN-γ+, IL17+ and IFN-γ+IL17+ spots is shown for the negative control (vehicle) and upon stimulation with RASGRP2 peptide pools, covering the sequence of RASGRP2 from N- (pool 1) to C terminus (pool 9). Each condition was performed for each donor in duplicate wells. The dots represent the response in a given well. Mean ± SEM is shown with red bars while the red dotted line depicts the mean + 3x standard deviation of the vehicle control. The latter is considered as threshold for positive responses.
(C) The results from fluorospot were compared to the degree of AP measured by the CFSE assay in the same individuals (incl. HD and REM; n = 16). Number of IFN-γ+, IL17+ and IFN-γ+IL17+ spots is shown for the negative control (vehicle) and upon stimulation with RASGRP2 peptide pools. Orange dots correspond to samples with low AP (< 0.9% CFSEdim), while blue dots correspond to samples with high AP (> 0.9% CFSEdim).
We next examined whether RASGRP2 reactivity is mediated by memory T cells and whether elimination of B cells would help to distinguish AP from reactivity to the RASGRP2 peptides/protein. Depletion of CD45RA-positive cells, which include naive T cells and also B cells, enriched not only for memory T cells but most importantly also depleted the entire B cell lineage (Figure 7B). The elimination of B cells reduced the “background proliferation,” i.e. AP, over 7 days (Figure 7C). Using this methodology, we identified reactivity in TCC14 and all tested CD45RA-depleted PBMCs of NAT-treated MS patients to various RASGRP2 peptide pools, but importantly also to the whole RASGRP2 protein (Figure 7D). The latter demonstrates that memory T cells in MS are recognizing also naturally processed and presented RASGRP2 epitopes.
Discussion
Our data indicate that the interaction of B and T cells leads to activation and growth, i.e., AP, which appears to play an important role in the autoimmune response in MS. The study extends our previous findings that myelin-specific T cells can be activated, show TCR signaling, and proliferate upon contact with fully activated dendritic cells and in the absence of exogenously added antigen (Kondo et al., 2001).
The simple CFSE-based in vitro system demonstrates increased AP in PBMCs in the clinically inactive state of the disease that is driven by memory B cells and is enriched for likely pathogenic, brain-homing effector memory T cells, i.e., cells that can invade an immunoprivileged organ. Clinical observations from anti-CD20 and anti-VLA-4 treatment support the interaction between B and T cells. B cells may thus participate not only in maintaining, but also in creating a pathogenic T cell repertoire in the periphery during REM. Recent data have shown that B cells are involved in thymic selection (Yamano et al., 2015), and it is conceivable that they shape a T cell repertoire with the propensity to (cross-) react with CNS autoantigens already at this stage. Restimulation and pathogenic differentiation of these T cells may again involve B cells in peripheral secondary lymphoid organs, although the site, where this takes place, is not clear. The demonstration of tertiary lymphoid structures in the meninges of MS patients (Magliozzi et al., 2007), which are rich in B and T cells and close to cortical lesions, indicates that B-T interactions may also be involved in sustaining inflammation in the CNS. B cell receptor sequencing of antigen-experienced B cells suggests that CNS-homing B cells differentiate in cervical lymph nodes before entering the CNS (Stern et al., 2014), and Ig class-switched memory B cells exchange between periphery and brain (Palanichamy et al., 2014).
Important questions arising from these observations are: Which is the nature of the self-peptides that activate and/or expand autoreactive CD4+ T cells, and whether the ones leading to activation in the peripheral immune system are identical to those recognized in the brain? Data from many laboratories including ours have shown that peptides from the myelin proteins proteolipid protein (PLP), myelin basic protein (MBP), and myelin oligodendrocyte glycoprotein (MOG) are target antigens in EAE and may also play a role in MS (Goverman, 2009, Sospedra and Martin, 2005). MOG and full-length PLP are not expressed in immune cells or the thymus, while MBP is, and hence in the case of MOG- and PLP-reactive T cells a mechanism like molecular mimicry and activation by another antigen, e.g., from a pathogen, has been invoked (Wucherpfennig and Strominger, 1995). Furthermore, a few non-myelin proteins including alpha-B crystallin and transaldolase-H, which are expressed in both lymphoid and CNS cells, may be recognized by T cells of MS patients, indicating that target antigens do not have to be myelin proteins (Sospedra and Martin, 2005). In our current study, we demonstrate not only that HLA-DR on memory B cells and B cell receptor (BCR) signaling are involved in AP, but further that these cells can express molecules like RASGRPs, which are involved in reduced apoptosis and tumorigenesis of EBV-infected B cells and B and T cell signaling and are crucial for maintaining B-T cell homeostasis (Stone, 2011). Of note, RASGRPs and particularly RASGRP2 are expressed in the brain as well. The unbiased identification of RASGRP2 as a high-avidity target antigen for CD4+ TCC14, which we isolated from peripheral AP T cells and which is clonally expanded in an active brain MS lesion, lends support for a scenario, in which activation of peripheral B cells with upregulation of HLA-DR and expression of antigens like RASGRP2 can then activate and propagate autoreactive CD4+ T cells, which migrate to and induce inflammation in the brain. In this case, the inducing antigen and the target antigen are identical. Important questions concerning how the cortical/neuronal expression pattern of RASGRP2 relates to inflammation in the meninges, perivascular spaces, or brain parenchyma, and how the released protein may be distributed via the CSF, remain to be addressed.
In summary, our data link B and T cells with MS pathogenesis and show that the interactions of these two cell types probably occur in conjunction with the MS-associated DR15 molecules and that B cells may express antigens, which are also upregulated in the brain and recognized by AP CD4+ T cells. We expect that our data will be instrumental for further studies about MS pathomechanisms, as in vitro drug finding platform and to guide the search for the specificity of B and T cells. Furthermore, they provide a plausible explanation for the high efficacy of anti-CD20 therapy in a T cell-mediated disease such as MS. Future studies should address whether AP is influenced by antigen-specific tolerization (Lutterotti et al., 2013).
STAR★Methods
Key Resources Table
| REAGENT or RESOURCE | SOURCE | IDENTIFIER |
|---|---|---|
| AIM-V medium | Thermo Fisher Scientific | Cat# 12055-091 |
| Fetal calf serum (FCS) | Eurobio | Cat# CVFSVF0001 |
| Filtermat A, GF/C | Perkin-Elmer | Cat# 1450-421 |
| Goat anti-IgM antibody | Jackson ImmunoResearch | Cat# 109-006-129; RRID: AB_2337553 |
| Human serum | PAA | Cat# C15-021 |
| IgG from human serum | Sigma-Aldrich | Cat# I2511; RRID: AB_1163604 |
| IMDM medium | GE healthcare | Cat# SH30259.01 |
| Mouse anti-BTK (pY551) (clone 24a/BTK (Y551)) ; (FACS, in vitro) | BD Biosciences | Cat# 558129; RRID: AB_397046 |
| Mouse anti-CD3 (clone HIT3a); (FACS, in vitro) | Biolegend | Cat# 300328; RRID: AB_1575008 |
| Mouse anti-CD3 (clone UCHT1); (FACS, in vitro) | Biolegend | Cat# 300423; RRID: AB_493740 |
| Mouse anti-CD3 (clone UCHT1); (FACS, ex vivo) | BD Biosciences | Cat# 560365; RRID: AB_1645570 |
| Mouse anti-CD3 (OKT3) | Ortho Biotech | upon request |
| Mouse anti-CD4 (clone OKT4); (FACS, in vitro) | Biolegend | Cat# 317418; RRID: AB_571947 |
| Mouse anti-CD4 (clone RPA-T4); (blocking, in vitro) | Biolegend | Cat# 300502; RRID: AB_314070 |
| Mouse anti-CD4 (clone RPA-T4); (FACS, ex vivo) | BD Biosciences | Cat# 560650; RRID: AB_1727476 |
| Mouse anti-CD8 (clone DK25); (FACS, in vitro) | Dako | Cat# PB98401; RRID: AB_579530 |
| Mouse anti-CD8 (clone SK1); (FACS, ex vivo) | BD Biosciences | Cat# 641400; RRID: AB_1645736 |
| Mouse anti-CD14 (clone HCD14); (blocking, in vitro) | Biolegend | Cat# 325618; RRID: AB_830691 |
| Mouse anti-CD16 (clone B73.1); (FACS, ex vivo) | BD Biosciences | Cat# 347617; RRID: AB_400331 |
| Mouse anti-CD19 (clone HIB19); (FACS, ex vivo) | Biolegend | Cat# 302230; RRID: AB_2073119 |
| Mouse anti-CD19 (clone HIB19); (FACS, in vitro) | Biolegend | Cat# 302226; RRID: AB_493751 |
| Mouse anti-CD19 (clone HIB19); (FACS, in vitro; ex vivo) | Biolegend | Cat# 302212; RRID: AB_314242 |
| Mouse anti-CD27 (clone M-T271); (FACS, in vitro; ex vivo) | Biolegend | Cat# 356406; RRID: AB_2561825 |
| Mouse anti-CD38 (clone HIT2); (FACS, ex vivo) | BD Biosciences | Cat# 555462; RRID: AB_398599 |
| Mouse anti-CD40 (clone MAB6322); (blocking, in vitro) | R&D | Cat# MAB6322; RRID: AB_2075698 |
| Mouse anti-CD45 (clone HI30); (FACS, ex vivo) | BD Biosciences | Cat# 560566; RRID: AB_1645452 |
| Mouse anti-CD45RA (clone HI100); (FACS, ex vivo) | BD Biosciences | Cat# 560675; RRID: AB_1727498 |
| Mouse anti-CD45RA (clone HI100); (FACS, in vitro) | Biolegend | Cat# 304112; RRID: AB_314416 |
| Mouse anti-CD138 (clone MI15); (FACS, ex vivo) | Biolegend | Cat# 356508; RRID: AB_2561882 |
| Mouse anti-CD183 (CXCR3) (clone 1C6/CXCR3); (FACS, ex vivo) | BD Biosciences | Cat# 562451; RRID: AB_11153118 |
| Mouse anti-CD183 (CXCR3) (clone G025H7); (FACS, in vitro) | Biolegend | Cat# 353706; RRID: AB_10962912 |
| Mouse anti-CD196 (CCR6) (clone G034E3); (FACS, ex vivo) | Biolegend | Cat# 353412; RRID: AB_10916387 |
| Mouse anti-CD196 (CCR6) (clone G034E3); (FACS, in vitro) | Biolegend | Cat# 353416; RRID: AB_10915987 |
| Mouse anti-CD197 (CCR7) (clone 150503); (FACS, ex vivo) | BD Biosciences | Cat# 560765; RRID: AB_2033949 |
| Mouse anti-CD197 (CCR7) (clone G043H7); (FACS, in vitro) | Biolegend | Cat# 353226; RRID: AB_11126145 |
| Mouse anti-CD247 (CD3zeta) (pY142) (clone K25-407.69); (FACS, in vitro) | BD Biosciences | Cat# 558489; RRID: AB_647152 |
| Mouse anti-GM-CSF (clone MAB215); (blocking, in vitro) | R&D | Cat# MAB215; RRID: AB_2229972 |
| Mouse monoclonal IgM antibodies against HLA class II molecule DR2a; (FACS) | purchased under an agreement from One Lambda (Thermo Fisher Scientific) | purchased under an agreement from One Lambda (Thermo Fisher Scientific) |
| Mouse monoclonal IgM antibodies against HLA class II molecule DR2b; (FACS) | purchased under an agreement from One Lambda (Thermo Fisher Scientific) | purchased under an agreement from One Lambda (Thermo Fisher Scientific) |
| Mouse anti-HLA-DQ (clone HLADQ1); (FACS) | Biolegend | Cat# 318105; RRID: AB_604127 |
| Mouse anti-HLA-DR (clone L243); (blocking, in vitro) | provided by HG. Rammensee, University of Tübingen, Germany | provided by HG. Rammensee, University of Tübingen, Germany |
| Mouse anti-HLA-DR (clone L243); (FACS, ex vivo) | BD Biosciences | Cat# 561224; RRID: AB_10563765 |
| Mouse anti-HLA-DR (clone L243); (FACS, in vitro) | Biolegend | Cat# 307606; RRID: AB_314684 |
| Mouse anti-HLA-DR (clone L243); (FACS, in vitro) | Biolegend | Cat# 307616; RRID: AB_493588 |
| Mouse anti-IFN-γ (clone B27); (FACS, in vitro) | BD Biosciences | Cat# 557643; RRID: AB_396760 |
| Mouse anti-IFN-γ (clone MAB285); (blocking, in vitro) | R&D | Cat# MAB285; RRID: AB_2123306 |
| Mouse anti-IgD (clone IA6-2); (FACS, in vitro; ex vivo) | Biolegend | Cat# 348222; RRID: AB_2561595 |
| Mouse anti-Stat1 (pY701) (clone 4a); (FACS, in vitro) | BD Biosciences | Cat# 612564; RRID: AB_399855 |
| Mouse anti-TCR Vbeta2 (clone MPB2D5); (FACS) | Beckman Coulter | Cat# IM2213; RRID: AB_131311 |
| Mouse anti-TCR Vbeta3 (clone CH92); (FACS) | Beckman Coulter | Cat# IM2372; RRID: AB_131046 |
| Mouse anti-TCR Vbeta4 (clone WJF24); (FACS) | Beckman Coulter | Cat# IM3602; RRID: AB_131344 |
| Mouse anti-TCR Vbeta7 (clone ZOE); (FACS) | Beckman Coulter | Cat# IM2287; RRID: AB_131323 |
| Mouse anti-ZAP70 (pY319) (clone 17A/P-ZAP70); (FACS, in vitro) | BD Biosciences | Cat# 561458; RRID: AB_10696417 |
| Mouse isotype control (clone MOPC-21; IgG1, κ); (blocking, in vitro) | Biolegend | Cat# 400123 |
| Mouse isotype control (clone MOPC-173; IgG2a, κ); (blocking, in vitro) | Biolegend | Cat# 400223 |
| Mouse isotype control (clone MPC-11; IgG2b, κ); (blocking, in vitro) | Biolegend | Cat# 400323 |
| Multicolor panel mouse anti-CD45-FITC/CD56-PE/CD19-ECD/CD3-PC5 (clones B3821F4A/ N901(NKH-1)/ J4.119/ UCHT1) | Beckman Coulter | Cat# 6607073; RRID: AB_1575973 |
| Rabbit polyclonal anti-RASGRP2; (IHC) | Abcam | Cat# ab170572 |
| Rat anti-GM-CSF (clone BVD2-21C11); (FACS, in vitro) | BD Biosciences | Cat# 554507; RRID: AB_395440 |
| RPMI-1640 medium | Sigma-Aldrich | Cat# R0883 |
| X-Vivo medium | Lonza | Cat# BE04-418F |
| Bacterial and Virus Strains | ||
| EBV strain B95-8 (supernatant produced with marmoset B cell line B95-8) | ATCC | Cat# CRL1612; RRID: CVCL_1953 |
| Biological Samples | ||
| Brain tissue (MS patient 1 and 2) | This paper and Planas et al., 2015 | Neuroimmunology and Clinical MS Research, University Medical Centre Eppendorf, Hamburg, Germany |
| Brain tissue | This paper | UK Multiple Sclerosis Society Tissue Bank, London, UK |
| Brain tissue | This paper | Institute of Neuropathology, University Hospital Zurich, Switzerland |
| Peripheral blood | This paper | Neuroimmunology and MS Research, Neurology Clinic, University Hospital, Zurich, Switzerland |
| Peripheral blood | This paper | Neuroimmunology and Clinical MS Research, University Medical Centre Eppendorf, Hamburg, Germany |
| Peripheral blood | This paper | Department of Neurology, Karolinska University Hospital, Stockholm, Sweden |
| Peripheral blood | This paper | Department of Gastroenterology and Hepatology, University Hospital Zurich, Switzerland |
| Peripheral blood | This paper | Department of Dermatology and Department of Immunology, University Hospital Zurich, Switzerland |
| Chemicals, Peptides, and Recombinant Proteins | ||
| 7-AAD | Biolegend | Cat# 420404 |
| Bovine serum albumin (BSA) | Roth | Cat# 3854.3 |
| Carboxyfluorescein diacetate N-succinimidyl ester (CFSE) | Sigma-Aldrich | Cat# 21888 |
| Dimethyl sulfoxide (DMSO) | Applichem | Cat# A3672 |
| DNase I, recombinant | Roche | Cat# 04536282001 |
| Eosin G | Merck | Cat# 115935 |
| Ficoll | Eurobio | Cat# GAUFIC0065 |
| G418 sulfate (geneticin) | Thermo Fisher Scientific | Cat# 10131035 |
| Gentamicin | Sigma-Aldrich | Cat# G1397 |
| Hematoxylin | Roth | Cat# T865.2 |
| Ibrutinib (PCI-32765; BTK inhibitor) | Selleckchem | Cat# S2680 |
| IL-2 containing supernatant (produced with IL-2T6 cell line) | provided by F. Sallusto, IRB, Bellinzona, Switzerland | provided by F. Sallusto, IRB, Bellinzona, Switzerland |
| IOTest® 3 Lysing Solution | Beckman Coulter | Cat# IM3514 |
| L-aa decapeptide positional scanning library (N-acetylated and C-amidated TPI 2040) | Pinilla et al., 1994 | N/A |
| L-glutamine | Thermo Fisher Scientific | Cat# 25030-081 |
| LIVE/DEAD Fixable Aqua Dead Cell Stain Kit | Thermo Fisher Scientific | Cat# L34957 |
| Methyl-3H-thymidine | Hartmann Analytic | Cat# M1762 |
| Penicillin/Streptomycin | Corning | Cat# 30-002-Cl |
| Peptides, 15-mer, overlapping, human RASGRP2 | Peptides&Elephants | This paper, see also Table S7 |
| Peptides, 10-mer | Peptides&Elephants | This paper |
| Phytohemagglutinin-L (PHA-L) | Sigma-Aldrich | Cat# L2769 |
| PP1 (LCK inhibitor) | Selleckchem | Cat# S7060 |
| Proteinase K, recombinant | Roche | Cat# 03115879001 |
| QIAzol lysis reagent | QIAGEN | Cat# 79306 |
| RASGRP2 protein, human recombinant | OriGene | Cat# TP312719 |
| Saponin | Applichem | Cat# A4518 |
| Tetanus toxoid (TTx) | Novartis Behring | upon request |
| Triton X-100 | Sigma-Aldrich | Cat# T8787 |
| Critical Commercial Assays | ||
| CD4 T Cell Isolation Kit, human (untouched) | Miltenyi Biotec | Cat# 130-096-533 |
| CD19 MicroBeads, human | Miltenyi Biotec | Cat# 130-050-301 |
| CD20 MicroBeads, human | Miltenyi Biotec | Cat# 130-091-104 |
| CD45RA MicroBeads, human | Miltenyi Biotec | Cat# 130-045-901 |
| Cytofix/Cytoperm | BD Biosciences | Cat# 554714 |
| Flow-Count Fluorospheres | Beckman Coulter | Cat# 7547053 |
| GM-CSF ELISA Set | BD Biosciences | Cat# 555126 |
| GolgiStop protein transport inhibitor | BD Biosciences | Cat# 554724 |
| Human IFN-γ/IL-22/IL-17A FluoroSpot kit, pre-coated | Mabtech | Cat# FSP-011803-10 |
| IFN-γ ELISA MAX Deluxe | Biolegend | Cat# 430105 |
| ImmunoSEQ Platform | Adaptive Biotechnologies | https://marketing.adaptivebiotech.com/immunoseq |
| iVIEW DAB Detection Kit | Ventana | Cat# 760-091 |
| LEGENDplex Th Cytokine Panel | Biolegend | Cat# 740001 |
| PicoPure RNA Isolation Kit | Thermo Fisher Scientific | Cat# KIT0204 |
| SMARTer stranded total RNA-seq- pico input mammalian kit | Clontech | Cat# 635007 |
| T Cell Activation/Expansion Kit, human (α-CD2/CD3/CD28 antibody-loaded MACSibead particles) | Miltenyi Biotec | Cat# 130-091-441 |
| TruSeq SR Cluster Kit v4-cBot-HS | Illumina | Cat# GD-401-4001 |
| Deposited Data | ||
| RNA sequencing data of brain LIII of MS patients 1 | Planas et al., 2015 | GEO: GSE60943 |
| RNA sequencing data of CFSEhi/dim CD19+ | This paper | ENA: PRJEB23143 |
| RNA sequencing data of CFSEhi/dim CD3+CD4+ | This paper | ENA: PRJEB19652 |
| TCRVβ sequencing data | This paper | https://clients.adaptivebiotech.com/pub/jelcic-2018-cell |
| Experimental Models: Cell Lines | ||
| Autologous EBV-transformed B cell lines | This paper | This paper |
| Bare lymphocyte syndrome (BLS) cells | provided by B. Kwok, Benaroya Research Institute, Seattle | provided by B. Kwok, Benaroya Research Institute, Seattle |
| marmoset B cell line B95-8 | ATCC | Cat# CRL1612; RRID: CVCL_1953 |
| Experimental Models: Organisms/Strains | ||
| not in this study | ||
| Oligonucleotides | ||
| Primer: TRBC Reverse: gacagcggaagtggttgcgggggt | Microsynth | N/A |
| Primer: TRBV20-1 Forward: tcaaccatgcaagcctga | Microsynth | N/A |
| Primer: TRBV28 Forward: cgcttctcccggattctggagtcc | Microsynth | N/A |
| Primer: TRBV29-1 Forward: gaggccacatatgagagtgg | Microsynth | N/A |
| Primer: TRBV4-1 Forward: gcttctcacctgaatgcccc | Microsynth | N/A |
| Software and Algorithms | ||
| EAGLE2 | Loh et al., 2016 | https://data.broadinstitute.org/alkesgroup/Eagle/ |
| FlowJo | Tree Star | https://www.flowjo.com/ ; RRID: SCR_008520 |
| GraphPad Prism | Graphpad | https://www.graphpad.com/ ; RRID: SCR_002798 |
| ImmunoSEQ analyzer 2.0 | Adaptive biotechnologies | https://marketing.adaptivebiotech.com/immunoseq/analyzer |
| Ingenuity Pathway Analysis | QIAGEN | https://www.ingenuity.com/ ; RRID: SCR_008653 |
| MASCOT | Matrixscience | http://www.matrixscience.com/ |
| PBWT | Durbin, 2014 | https://github.com/richarddurbin/pbwt |
| PRSice v1.25 | Euesden et al., 2015 | http://prsice.info/ |
| R/bioconductor package edgeR | Robinson et al., 2010 | http://bioconductor.org/packages/release/bioc/html/edgeR.html |
| RSEM algorithm (version 1.2.22) | Li & Dewey, 2011 | https://omictools.com/ ; RRID: SCR_002250 |
| Scaffold software (version 4.8.4) | Proteome Software | http://www.proteomesoftware.com/products/scaffold/ |
| SPICE | NIH, NIAID | https://niaid.github.io/spice/ |
Contact for Reagent and Resource Sharing
Further information and requests for resources and reagents should be directed to and will be fulfilled by the Lead Contact, Roland Martin (roland.martin@usz.ch).
Experimental Model and Subject Details
Human subjects
Peripheral blood was collected from 32 healthy donors (HD; age range 25-49, F:M ratio: 1.7) and 50 untreated (nihil) patients with relapsing-remitting MS (RRMS), of which 18 patients where in relapse (REL; age range 20-45, F:M ratio: 2.0) and 32 patients were in remission (REM; age range 22-54, F:M ratio: 1.1), in a first cohort. For a second cohort, we used peripheral blood from 14 HD (age range 25-41, F:M ratio: 0.8) and 14 untreated RRMS patients (REM; age range 22-54, F:M ratio: 1.8). Furthermore, we received additional blood samples from untreated patients with psoriasis (n = 10; age range 25-47, F:M ratio: 0.4) and Crohn’s disease (Morbus Crohn, n = 7; age range 25-53, F:M ratio: 1.3). MS had clinically definite MS by clinical and/or McDonald criteria (Polman et al., 2011). We were blinded for the status of remission and relapse when performing the CFSE assay for samples of RRMS patients. Relapse was defined as clinical worsening of at least 24 h duration and/or contrast-enhancing lesion/s on MRI and within no more than one month of peripheral blood collection. Remission was defined as absence of contrast-enhancing lesion/s on MRI and stable clinical disease course compared to last visit as well as being at least one month before and/or after relapse. Furthermore, peripheral blood was collected from 15 patients with RRMS under natalizumab treatment (age range 23-50, F:M ratio: 4.0) and 10 patients under fingolimod treatment (age range 24-47, F:M ratio: 1.5). The majority of samples were collected at the Neuroimmunology and MS Research Section, Neurology Clinic, University Hospital Zurich, Zurich (Switzerland), and some at the Institute for Neuroimmunology and Clinical Multiple Sclerosis Research, Centre for Molecular Neurobiology, University Medical Centre Eppendorf, Hamburg (Germany). In addition, we collected peripheral blood at the MS clinic of the Department of Neurology, Karolinska University Hospital, Stockholm, from 9 patients before (baseline) and 3 months after rituximab treatment (age range 32-59, F:M ratio: 0.8) and 14 patients under rituximab treatment (age range 30-59, F:M ratio: 1.3). Furthermore, whole blood was collected and directly analyzed by flow cytometry in 188 (n = 179 for B and T cell counts, age range 19-65, F:M ratio: 2.0; n = 9 for T cell subsets, age range 33-54, F:M ratio: 3.5) MS patients before (baseline) and after rituximab treatment. For the RASGRP2 reactivity screening, we collected peripheral blood from 8 RRMS patients under natalizumab treatment (age range 24-53, F:M ratio: 0.6) at the the Neuroimmunology and MS Research Section, Neurology Clinic, University Hospital Zurich, Zurich (Switzerland) and from 20 RRMS patients under natalizumab treatment (age range 21-56, F:M ratio: 0.8) at the MS clinic of the Department of Neurology, Karolinska University Hospital, Stockholm. The demographics of all donors included in the study are shown in detail in Table S1. Analysis of the influence of gender identity on autoproliferation (AP) did not result in any significant difference between females and males, neither in HD nor MS patients (data not shown).
The samples used for the research activities were taken from various research projects. These have been previously reviewed and approved by the corresponding Ethics Committees. This includes: a) research projects with EC-No. 2758 approved on 18th October 2007 by the Ethics Committee of the Hamburg Board of Physicians, Germany; b) research projects with EC-No. 2013-0001 approved on 05th June 2013, EC-No. 2014-0699 approved on 27th February 2015 and EC-No. 1316 (control samples from patients with Crohn’s disease) approved on 05th February 2007 by the Cantonal Ethics Committee of Zurich, Switzerland; c) the control samples of psoriasis patients were received from the Biobank of the Department of Dermatology, University Hospital Zurich, Switzerland; d) research project with EC-No. 2015/1280-32 approved on 21st July 2015 by Ethical Vetting Board of Stockholm, Sweden; e) brain tissue samples and peripheral blood for TCR sequencing were collected from two patients with MS as described previously (Planas et al., 2015) and approved as part of the research projects with EC-No. 2758 by the Ethics Committee of the Hamburg Board of Physicians, Germany (see above); and f) brain tissue samples were provided for immunohistochemistry analyses by the Institute of Neuropathology, University Hospital Zurich and for proteomic analyses by the UK Multiple Sclerosis Society Tissue Bank. The use of these samples for research projects was approved respectively by the Regional Ethics Committee for Wales, UK, on 18th June 2013 (EC-No. 08/MRE09/31+5) and by the Cantonal Ethics Committee of Zurich, Switzerland, on 4th September 2014 (EC-No. 2014-0243). All patients consented for the sampling in the framework of the above-mentioned projects. In addition, all of these patients have consented for the further use of the samples in research (General Consent).
Primary cells and cell lines
Peripheral blood mononuclear cells (PBMCs) from HD and patients were freshly isolated from EDTA-containing blood tubes, sodium citrate-containing cell preparation tubes, or from leukaphereses using Ficoll (Eurobio) density gradient centrifugation. All isolated PBMCs were cryopreserved in freezing media containing 10% dimethyl sulfoxide (DMSO; Applichem) and 90% fetal calf serum (FCS; Eurobio) and stored at −180°C. PBMCs were obtained under ethical approvals and with informed consent as described above. The demographics incl. age and gender of these donors in the respective cohorts are depicted in Table S1.
EBV-transformed B cell lines were generated from above collected PBMCs of few individuals (5 HD, age range 28-49, F:M ratio: 1.5; 5 REM, age range 31-52, F:M ratio: 4.0) under ethical approvals and with informed consent as described above. EBV transformation was performed by using the supernatant of the EBV-producing marmoset B cell line B95-8 (ATCC, see Key Resources Table) and OKT3 antibody (Ortho Biotech). The EBV-transformed B cell lines were maintained in complete RPMI-1640 medium (Sigma-Aldrich) containing 100 U/mL penicillin/streptomycin (Corning), 50 μg/mL gentamicin (Sigma-Aldrich), 2 mM L-glutamine (Thermo Fisher Scientific) and 10% FCS. The B95-8 cell line was cultured also in complete RPMI medium containing 100 U/mL penicillin/streptomycin, 50 μg/mL gentamicin, 2 mM L-glutamine and 10% FCS. Culture supernatants containing EBV particles were collected after sufficient cell growth over 7 days, centrifugation and filtering for removal of cell debris, and finally frozen at −80°C.
Bare lymphocyte syndrome (BLS) cells stably expressing one of the HLA-DR15 haplotype expressing HLA class II alleles (DR2a ( = DRB5∗0101), DR2b ( = DRB1∗1501) or DQw6 ( = DQB1∗0602) were kindly provided by B. Kwok (Benaroya Research Institute, Seattle). HLA class II-expressing BLS cells were cultured in complete RPMI medium containing 100 U/mL penicillin/streptomycin, 50 μg/mL gentamicin, 2 mM L-glutamine and 10% FCS. In order to maintain selection and stable expression of the HLA class II molecules, the medium for the BLS cell lines was supplemented with 1 mg/ml G418 sulfate (geneticin; Thermo Fisher Scientific). HLA class II expression of BLS cell lines was verified with specific antibodies against DR2a, DR2b and DQ (Key Resources Table) and cells were tested negative for mycoplasma.
Method Details
Genotyping and genetic analyses
Individuals were typed for HLA class I and II molecules at Histogenetics LLC, NY, USA. Isolation of DNA from whole blood, with a final concentration of 15 ng/μl, was performed with a standard DNA isolation protocol using a Triton lysis buffer (containing Triton X-100; Sigma-Aldrich) and Proteinase K treatment. The samples were typed for HLA-class I (A∗ and B∗) and HLA-class II (DRB1∗, DRB3∗, DRB4∗, DRB5∗, DQA1∗ and DQB1∗) using high-resolution HLA sequence-based typing (SBT). Genomic DNA from PBMCs of 28 HD and 29 RRMS (REM) individuals (all of Central European ancestry), for which we assessed in vitro AP, was subjected to genotyping using HumanOmniExpress-24 (v1.1) arrays from Illumina (San Diego, CA, USA). Exclusion criteria were maximum per-person missingness (3%), maximum per-SNP missingness (1%), and deviation from Hardy-Weinberg equilibrium (HWE, p < 1x10⁻⁷). Whole-genome imputation was performed using EAGLE2 (Loh et al., 2016) for phasing and PBWT (Durbin, 2014) with the Haplotype Reference Consortium (HRC) reference panel (release 1.1) (McCarthy et al., 2016). Only markers with an imputation info score > 0.8 were included in the final dataset. Linear regression was used to test for association between 134 MS non-HLA risk SNPs (Beecham et al., 2013, Sawcer et al., 2011), a polygenic MS risk score derived from 102 of those markers (A/T and C/G markers removed due to strand ambiguity) using PRSice v1.25 (Euesden et al., 2015), or HLA-DR15 status, respectively, and the AP phenotype. Single SNP associations were subjected to Bonferroni adjustment for multiple testing correction to assess significance.
Proliferation assays
Cryopreserved PBMCs were thawed with complete IMDM medium (GE Healthcare) containing 100 U/mL penicillin/streptomycin (Corning), 50 μg/mL gentamicin (Sigma-Aldrich), 2 mM L-glutamine (PAA) and 5% heat-decomplemented human serum (HS, PAA) and afterward washed once with serum-free AIM-V medium (Thermo Fisher Scientific), containing human albumin. Cells were incubated for 15 min in AIM-V medium containing 50 U/ml DNase (Roche) at 37°C to avoid cell clump formation. Following two wash steps with PBS containing 0.1% HS, cells were resuspended at a concentration of 10×106 cells/ml in PBS/0.1% HS and were then labeled at a final concentration of 0.5 μM carboxyfluorescein diacetate N-succinimidyl ester (CFSE, Sigma-Aldrich) for 3 min at room temperature. The labeling was stopped by quenching with 5x excess volume of cold complete RPMI medium containing 10% HS. After one further wash step with AIM-V, CFSE-labeled cells were seeded at 2 × 10⁵ PBMCs/200 μL per well in AIM-V (10-12 replicate wells per donor and condition) in 96-well U-bottom microtiter plates (Greiner Bio-One) at 37°C, 5% CO2, in the absence of exogenous stimuli for 7 days (AP). Short-term exposure to media containing heat-decomplemented human serum during the protocol did not influence AP (data not shown).
For conventional T cell reactions, we used for the same donors PHA (0.5 μg/ml) as TCR-independent stimulus, tetanus toxoid (TTx, 5 μg/ml, Novartis Behring) as foreign antigen stimulus and mixed lymphocyte reaction (MLR) as allogeneic antigen stimulus. For the MLR we used allogenic irradiated PBMCs pooled from five HD as stimulator cells and CFSE-labeled PBMCs from HD or MS patients as responder cells in a ratio of 1:1 (each 2 × 10⁵ cells). As conventional B cell reaction, we stimulated PBMCs by cross-linking with an anti-human IgM antibody (10 μg/ml, Jackson ImmunoResearch). We tested for competition of AP by incubating CFSE-labeled PBMCs in the presence of anti-HLA-DR (kindly provided by HG. Rammensee, University of Tübingen, Germany) anti-CD4, anti-CD40, anti-IFN-γ and anti-GM-CSF antibodies (10 μg/ml, Key Resources Table) or appropriate isotype controls, and to analyze AP in the presence of serial dilutions of selective LCK (PP1) and BTK (ibrutinib) inhibitors (Key Resources Table).
After 7 days of AP or conventional B- or T cell reactions, CFSE-labeled cells were collected and pooled from replicate wells, washed with PBS, Fc-blocked with human IgG (Sigma-Aldrich) and labeled with Live/Dead® Aqua (Thermo Fisher Scientific) at 4°C. After washing with cold PBS containing 2mM EDTA and 2% FCS, cells were directly stained for surface markers using the fluorochrome-conjugated antibodies (Key Resources Table). Measurements were performed on an LSR Fortessa Flow Cytometer (BD Biosciences), and data were analyzed with FlowJo (Tree Star). For the analysis, gates were set at first on singlets and live cells. CD4+ and CD8+ T cells were gated prior on CD3+ cells.
Thymidine incorporation assay was used to measure proliferative responses after 2-7 days. At day 2-7, the cells were pulsed with 1 μCi of methyl-3H-thymidine per well (Hartmann Analytic) and harvested after 15 h on a membrane (Filtermat A, GF/C, Perkin-Elmer) using a harvester machine (Tomtec). Incorporation was measured by β-scintillation counting (Wallac 1450, Perkin-Elmer). Proliferative responses were given as counts per min (cpm).
B cell depletion and transfer
Specific depletion of B cells was performed by depleting CD19+ B cells or CD20+ B cells after CFSE labeling of PBMCs using magnetic microbeads according to the manufacturer's instructions (Miltenyi Biotec). Co-cultures in transwells (Corning) were used to prevent cell-cell interactions between magnetically isolated CD19+ B cells and autologous PBMCs after CFSE labeling. For post-culture transfer experiments, CFSEhi and CFSEdim B cells were sorted after 7 days of stimulus-free culture using CFSE-labeled PBMCs (150 Mio cells) from RRMS (REM) patients, subsequently incubated with control isotype or HLA-DR-blocking (L243) antibodies (10 μg/ml) for 30 min on ice and then transferred to CFSE-labeled and CD19-depleted autologous PBMCs. FACS analysis of proliferation and activation was then assessed after 7 days of stimulus-free co-culture in AIM-V medium. For B cell transfer experiments in longitudinal samples of rituximab-treated MS patients we isolated either CD20+, CD27- naive or CD27+ memory B cells by separating these B cell subpopulations ex vivo from PBMCs from baseline (pre-therapy) with magnetic microbeads (CD20) or FACS sorting (CD19, CD27), respectively. Isolated CD27- naive or CD27+ memory B cells were incubated with control isotype or HLA-DR-blocking (L243) antibodies (10 μg/ml) for 30 min on ice prior to transfer. Following transfer of the B cell subsets to CFSE-labeled autologous PBMCs from time point of rituximab treatment, cells were seeded in AIM-V for 7 days in the absence of exogenous stimulus (AP) as described above and then analyzed by flow cytometry. All conditions in depletion and transfer experiments were performed with at least 6-10 replicate wells.
Primary B-T cell co-cultures
Naive and memory B cells were sorted upon labeling with antibodies against CD19 and CD27 via FACS and subsequently put in AIM-V medium. At the same time autologous PBMCs were labeled with CFSE as described above and used to magnetically isolate untouched CD4+ T cells according to the manufacturer's instructions (Miltenyi Biotec). All cell populations were checked for > 90% (> 95% for sorting) purity in flow cytometry. Isolated CFSE-labeled CD4+ T cells (5x10⁴ cells) were cultured either alone, with sorted autologous naive or memory B cells (5x10⁴ cells) per well in a 96-well U-bottom microtiter plate in AIM-V in the absence of exogenous stimulus. Following 7 days, cells were analyzed by flow cytometry by staining for live cells, CD4, CD19 and HLA-DR. Each condition was performed with 5 replicate wells.
Expansion of T and B cells
AP cells (CFSEdim) were sorted after 7 days of PBMC culture (5x10⁷) in the absence of exogenous stimulus from 5 HLA-DR15+ HD and 5 HLA-DR15+ RRMS (REM) using a FACSAria (BD). Staining with the viability dye 7-AAD (Biolegend) was used to exclude dead cells. The sorted cells were then expanded as bulk populations for one round with 1 μg/ml phytohemagglutinin (PHA, Sigma-Aldrich) and human IL-2 as previously described (Yousef et al., 2012). Autologous EBV-transformed B cell lines were generated from PBMCs of the HLA-DR15+ individuals using the supernatant of the EBV-producing marmoset B cell line B95-8 and OKT3 antibody as described above.
Cytokine measurement
Supernatants were collected from the wells of cultured CFSE-labeled PBMCs after 7 days. Cytokines were measured with Human T Helper Cytokine Panel LEGENDplex bead-based immunoassay (Biolegend; incl. measurement of 13 human cytokines: IL-2, IL-4, IL-5, IL-6, IL-9, IL-10, IL-13, IL-17A, IL-17F, IL-21, IL-22, IFN-γ and TNF) using flow cytometry according to the manufacturer's instructions. IFN-γ ELISA (Biolegend) and GM-CSF ELISA (BD Biosciences) was performed according to the manufacturer's instructions. Heatmaps for cytokine responses were generated using Spice software (NIH, NIAID). For visualization purposes in graphs using a log axis absent values or values below standard range were set as 1.
Ex vivo multicolor staining
B and T cell numbers were analyzed before and after rituximab treatment in 179 MS patients (Table S1). Whole blood was collected, lysed with IOTest® 3 Lysing Solution (Beckman Coulter) and stained with an antibody mix containing antibodies against CD19 and CD3 (multicolor panel from Beckman Coulter including antibodies against CD45, CD56, CD19 and CD3 and in addition an antibody against CD16 from BD). For the quantification of absolute T and B cell numbers Flow-Count Fluorospheres (Beckman Coulter) with a known concentration were added at an equal volume to the stained sample. Measurements were performed on a Navios (Beckman Coulter) flow cytometer until March 2016 and on an Aquios (Beckman Coulter) flow cytometer after April 2016. The number of cells was calculated as follows: absolute count (cells/μl) = (total number of cells counted / total number of fluorospheres counted) x concentration of flow-count fluorospheres. T cell subtypes and activated T cells were analyzed in 9 RRMS samples before (untreated) and after rituximab therapy (Table S1) using a multicolor panel with appropriate antibodies (Key Resources Table). PBMCs from untreated RRMS (REM) patients used for the in vitro CFSE assay, were stained ex vivo for multiple B cell markers (Key Resources Table) to distinguish different B cell subsets and to correlate their frequency with the AP of T cells in vitro.
Intracellular cytokine and phosphoprotein staining
Intracellular cytokine staining was performed on CFSE-labeled PBMCs of RRMS (REM) patients after adding GolgiStop protein transport inhibitor (BD Biosciences) at day 7 of stimulus-free culture. After 5 hours in the presence of GolgiStop, CFSE-labeled PBMCs were pooled, Fc-blocked with human IgG and labeled with Live/Dead® Aqua at 4°C and subsequently stained for CD3, CD4 and CD8 on ice (Key Resources Table). Following fixation and permeabilization with Cytofix/Cytoperm (BD Biosciences), cells were stained with cytokine-specific antibodies (Key Resources Table) in PBS containing saponin (Applichem) and bovine serum albumin (BSA; Roth).
Measurement of phosphorylated signaling molecules was performed on CFSE-labeled PBMCs of RRMS (REM) patients at day 7 of stimulus-free culture. After pooling replicate wells, cells were labeled with Live/Dead® Aqua and stained with an antibody against CD3 or CD19 on ice to prevent activation by the antibody. All centrifugation steps as well as buffers were pre-chilled at 4°C. Following wash steps in ice-cold PBS containing 2mM EDTA and 2% FCS, cells were fixed with 2% PFA for 15 min and after centrifugation permeabilized with 90% ice-cold methanol. Finally, the cells were stained with antibodies against phosphorylated epitopes of STAT1, CD3ζ, ZAP-70 or BTK (Key Resources Table) in PBS containing saponin and BSA. Measurements were performed on an LSR Fortessa Flow Cytometer (BD Biosciences), and data were analyzed with FlowJo (Tree Star).
RNA sequencing
For RNA sequencing analysis of non-proliferating (CFSEhi) and AP (CFSEdim) CD3+CD4+ and CD19+ cells, we labeled 5x10⁷ CFSE-labeled PBMCs of RRMS (REM) patients at day 7 of unstimulated in vitro culture with Live/Dead® Aqua and antibodies against CD3, CD4, CD8 and CD19 (Key Resources Table) and subsequently sorted live CFSEhi and CFSEdim cells of CD3+CD4+ and CD19+ subsets using a FACSAria III (BD Biosciences). Sorted cells were adjusted to the same cell number for CFSEhi and CFSEdim, washed once in PBS, resuspended in Qiazol (QIAGEN) and after a short incubation at room temperature frozen at −80°C. RNA isolation was performed with the PicoPure RNA Isolation kit (Thermo Fisher Scientific) according to the manufacturer’s instructions after phenol (Qiazol)/chloroform extraction. In brief, Qiazol preserved sorted cells (10.000 – 30.000 cells) were incubated with chloroform and centrifuged for 15 min at 12,000xg at 4°C. The upper aqueous phase was collected and added to an equal volume of 70% ethanol. RNA was then isolated using PicoPure RNA Isolation columns and stored at −80°C until RNA sequencing was performed at the Functional Genomics Center Zurich (FGCZ). RNA integrity and quantity were assessed by capillary electrophoresis using RNA PicoChip on the Agilent Technologies 2100 Bioanalyzer (Agilent Technologies). SMARTer stranded total RNA-seq- pico input mammalian kit (Clontech laboratories) was used according to manufacturer’s instructions for library generation from 500pg of total RNA obtained from CD4+ T cells. Quantification and quality control of generated libraries were performed on an Agilent Technologies 2100 Bioanalyzer with DNA-specific chip (Agilent Technologies). Uniquely barcoded libraries were pooled in equal molarities (10nM) and further used for cluster generation according to the manufacturer’s recommendations using TruSeq SR Cluster Kit v4-cBot-HS (Illumina) and sequenced on the Illumina HiSeq 2500 with single read (1x125bp) approach using the TruSeq SBS Kit v4-HS (Illumina). The raw reads were first cleaned by removing adaptor sequences, trimming low quality ends (four bases from read start and read end), and filtering reads with low quality (phred quality < 20). Sequence alignment and isoform expression quantification of the resulting high-quality reads to the human genome assembly (build GRCh38, ensembl 80 annotations) was performed with the RSEM algorithm (version 1.2.22) (Li and Dewey, 2011) with the option for estimation of the read start position distribution turned on. Genes not present (< 10 counts per gene) in at least 50% of samples from one condition were discarded from further analyses. Differential gene expression analysis between CFSEdim and CFSEhi cell samples was performed using the R/bioconductor package edgeR (Robinson et al., 2010) in which the normalization factor was calculated by trimmed mean of M values (TMM) method. P values were adjusted for multiple testing using the Benjamini-Hochberg procedure. For cluster analysis, a p value < 0.01 was applied. Thresholds log2 fold change > 0.5 and adjusted p values < 0.01 were used for pathway analysis with Ingenuity (QIAGEN).
TCRVβ sequencing
In order to separate CFSEhi and CFSEdim cells for TCRVβ sequencing, we labeled 5x10⁷ PBMCs with CFSE as described above, pooled replicate wells after 7 days of stimulus-free co-culture, stained with the viability dye 7-AAD and subsequently sorted live (7-AAD-) non-proliferating (CFSEhi) and AP (CFSEdim) subpopulations using a FACSAria III (BD Biosciences). Sorted cells were washed with PBS and frozen as dry pellets at −80°C. Amplification and sequencing of TCRVβ CDR3 were performed on extracted DNA of brain lesions and sorted peripheral blood CFSEhi and CFSEdim subpopulations, derived from culture of CFSE-labeled PBMCs, of two MS patients as well as sorted peripheral blood CD4+CD45RO+ and CD8+CD45RO+ memory T cells of one MS patient using the immunoSEQ Platform (Adaptive Biotechnologies®, Seattle, WA). The immunoSEQ Platform combines multiplex PCR with high throughput sequencing and a sophisticated bioinformatics pipeline for TCRVβ CDR3 analysis (Carlson et al., 2013, Robins et al., 2009). In the data analysis, we first excluded non-productive TCRVβ sequences and CDR3 sequences with less than 4 amino acids, and then recalculated the frequency of the remaining unique productive TCRVβ sequences in each sample. Shared unique productive TCRVβ sequences between different cloneset samples were identified with the immunoSEQ analyzer 2.0 of Adaptive Biotechnologies® based on identical CDR3 amino acid, V- and J-chain sequence. Normalization of the cloneset sample overlap was performed with the following equation: amount of shared unique productive TCRVβ sequences in cloneset sample 1 (M) with cloneset sample 2 (N) divided by the amount of total unique productive TCRVβ sequences in cloneset size sample 1 (M) multiplied by the amount of total unique productive TCRVβ sequences in cloneset size sample 2 (N). The result was multiplied by 1000 and depicted as arbitrary unit (AU), based on a previous publication (Zvyagin et al., 2014).
T cell cloning
In order to generate T cell clones (TCCs) from the AP compartment, we splitted 500 CFSEdim cells from the sorted cell pool of CFSEdim cells (20.000 cells) of MS patient 1 (for the TCRVβ sequencing, described above) and performed limiting dilution as previously described (Yousef et al., 2012). TCCs were enriched using an expansion protocol with PHA and human IL-2 (kindly provided by F. Sallusto, IRB, Bellinzona, Switzerland) (Yousef et al., 2012). Sequencing of TCR rearrangements of the generated TCCs was analyzed, as previously described (Yousef et al., 2012). To assess the cytokine response of the TCCs, α-CD2/CD3/CD28 antibody-loaded MACSibead particles (Miltenyi) were used to stimulate each TCC in 7 replicate wells with each 200.000 cells in X-Vivo medium (Lonza). After 48 h supernatants were collected and cytokine responses measured, as described above. For chemokine receptor expression, TCCs were stained with Live/dead Aqua and antibodies against CXCR3 and CCR6 after thawing and resting cells over night.
Positional scanning libraries and Biometrical Analysis
A L-aa decapeptide positional scanning library (N-acetylated and C-amide TPI 2040) was prepared as previously described (Pinilla et al., 1994). Each of the 200 mixtures of the library was tested for their proliferative activity by TCC14 at 40, 120, and 200 μg/ml using thymidine incorporation assay. The restriction of TCC14 was tested with irradiated BLS cells stably expressing one of the HLA-DR15 haplotype expressing HLA class II alleles (DR2a ( = DRB5∗0101), DR2b ( = DRB1∗1501) or DQw6 ( = DQB1∗0602); kindly provided by B. Kwok, Benaroya Research Institute, Seattle), since the TCC is derived from a HLA-DR15 homozygous MS patient. After confirming restriction of TCC14 for DR2b, all further tests for TCC14 were performed with irradiated BLS-DR2b as APC. The results were organized into four matrices (data not shown): three matrices each representing the activity at one of the above doses, and a matrix using the concentration to achieve 3-fold proliferation to combine all three doses into a single activity. Using the biometrical analysis process (Zhao et al., 2001) against the transcriptome protein database from the brain of MS patient 1, predicted peptide lists were generated for each of the four matrices. Due to a large amount of agreement between the predicted lists, a total of 92 distinct decamer peptides occurred within the top 50 predicted peptides in at least one matrix’s prediction list. These peptides were chosen to be synthesized (Peptides & Elephants) and tested for proliferative responses after 72 h using thymidine incorporation assay.
Proteomics by LC-MS/MS
In order to obtain peptides for mass spectrometric analysis, dry pellets of magnetically sorted untouched CD19+ B cells (HD and MS (REM), each n = 4; samples sizes of 2-6x10⁶ cells) were lysed with an adapted filter aided sample preparation (FASP) protocol as previously described (Wiśniewski et al., 2009). Fresh frozen brain tissue from cortical gray matter from brains (n = 6 controls, pooled and n = 6 MS, pooled) was dissociated and lysed using a PCT technology as previously described (Guo et al., 2015). Resulting peptides were dissolved in 3% acetonitrile and 0.1% formic acid before injecting into an Easy-nLC 1000 linked to an Orbitrap Fusion instrument (Thermo Fisher Scientific) on a gradient of 120 min. As column material ReproSil-Pur, C18, 120 Å, AQ, 1.9 μm (Dr. Maisch GmbH) with column dimensions ID 0.075mm/ length 150mm was used. For protein identification, “raw” files were converted into “mgf” files and analyzed on MASCOT software with a human UniProtKB/Swiss-Prot protein database (date: March 22, 2016 with 40912 entries). As search parameters 0.8 Da fragment mass tolerance and 10ppm precursor mass, minimal number of peptides 2, and fdr of 0.1%, allowing 2 mis-cleavages on trypsin fragments were defined. Carbamidomethyl at cysteine was set as a static modification, and oxidation of methionine, acetylation of lysine and protein N terminus were set as variable modification. Scaffold software (version 4.8.4) was used to validate and count spectral peptide matches. All identified peptide sequences of both brain and B cell samples are listed in Table S6.
Immunohistochemical stainings
In brief, slices were dewaxed through graded alcohols. Sections were then incubated in Ventana buffer, and automatically stained with the NEXEX immunohistochemistry robot (Ventana Instruments) using primary antibody against RASGRP2 (dilution 1:50; rabbit polyclonal to RASGRP2 - N-terminal; Key Resources Table). Finally, sections were developed using an iVIEW DAB Detection Kit (Ventana). Omission of the primary antisera in the control slides resulted in no immunostaining at all. Sections were scanned under equal lighting conditions at 40x magnification using a Hamamatsu tissue scanner (Nanozoomer). Hamamatsu NDPI images of each scanned slide were transfered to a computer screen (Viewer Version DIH 4.0.0-20130402-63) and representative images were captured. In addition, hematoxylin (Roth) and eosin (Merck) (HE) stainings were performed.
RASGRP2 reactivity
We tested RASGRP2 reactivity by assessing cytokine production in PBMCs (2.5×10⁵ cell/well) from HD (n = 11), untreated RRMS patients (REM; n = 9) and RRMS patients under natalizumab treatment (NAT; n = 20) (Table S1) using a IFNγ/IL17/IL22 Fluorospot Kit (Mabtech) according to manufacturer’s instructions. PBMCs were cultured for 44h with vehicle control (DMSO), stimulated with anti-CD3 antibody (mAB CD3-2, included in Fluorospot Kit) or RASGRP2 peptide pools (see above, final concentration of pool 10 μM)) in complete RPMI medium containing 10% FCS, 2mM L-glutamine and 50 U/ml penicillin/streptomycin. Wells were set up in duplicates for each condition and fluorescent spots were counted using a fluorospot plate reader (AID iSpot Spectrum, AID GmbH).
In order to test reactivity to RASGRP2 in memory T cells, cryopreserved PBMCs (1×10⁸ cells) of natalizumab-treated MS patients were thawed and afterward depleted for CD45RA-expressing cells using magnetic cell sorting (Miltenyi). 2×10⁵ CD45RA-depleted PBMCs were seeded per well in X-Vivo medium (10-15 replicate wells per condition) and were either unstimulated, treated with vehicle (DMSO) or pulsed with RASGRP2 peptide pools (final concentration of pool 10 μM) or whole purified RASGRP2 protein (Origene; 0.3 μg/ml). The 15-mer-overlapping peptides covering the whole RASGRP2 protein were organized in 9 peptide pools with 7 peptides per pool covering the sequence of RASGRP2 from N- (pool 1) to C terminus (pool 9) (Table S7). α-CD2/CD3/CD28 beads (Miltenyi) were used as positive control and added to 5 replicate wells at day 4 of PBMC culture. Thymidine incorporation assay was used to measure proliferation responses to RASGRP2 after 7 days. Stimulatory index (SI) was calculated as ratio of peptide or protein stimulation versus vehicle control. SI values > 2 were considered as positive.
Quantification and Statistical Analysis
Statistical analyses were performed with GraphPad Prism. Multiple comparison analyses were assessed with a non-parametric one-way Kruskal-Wallis test and Dunn’s multiple comparisons test. Non-parametric two-tailed Mann-Whitney U test was performed on data with only two groups. Wilcoxon matched-pairs signed rank test was used for analysis of paired samples. Correlation was calculated using Spearman’s rank correlation test. P values are reported in the figures and figure legends where significant. Error bars are shown as standard error of the mean (SEM) and are indicated in the figures. Sample sizes were chosen based on previous experience of in vitro experiments (Mohme et al., 2013). Other quantitative and statistical methods are noted above according to their respective technologies and analytic approaches.
Data and Software Availability
The accession numbers of RNA sequencing data of AP B- and CD4+ T cells reported in this paper are ENA: PRJEB19652 for CD3+CD4+ cells and ENA: PRJEB23143 for CD19+ cells (https://www.ebi.ac.uk/ena).
TCRVβ sequencing results reported in this paper can be accessed on the immuneACCESS database of Adaptive Biotechnologies (https://clients.adaptivebiotech.com/pub/jelcic-2018-cell).
Acknowledgments
This study was supported by European Research Council grant ERC-2013-ADG 340733 to R.M., the Clinical Research Priority Program MS (CRPPMS) of the University of Zurich (UZH), Swiss National Science Foundation (SNF) Sinergia grant UnmetMS, a grant to Ivan Jelcic from the Swiss MS society, grants to F.A.N. from the Swedish Society for Medical Research, Swedish Foundation for MS Research and NEURO Sweden, and a career development award from the Stavros Niarchos Foundation to K.F. G.R. received support from the SNF for the Swiss IBD Cohort Study (3347CO-108792); T.O. and F.P. received grants from the Swedish Medical Research Council (2012-2284 and 2014-3077); and T.O. received grants from the Knut and Alice Wallenberg Foundation, the Swedish Brain Foundation, and the MAUS foundation. R.S. and C.P. were supported by the Multiple Sclerosis National Research Institute. We thank the UK MS Society Tissue Bank (grant 007/14 to R.R.) for frozen MS tissue samples; I. Metz and W. Brück (University Medical Center Göttingen) for histopathology of brain lesions; V. Tosevski (UZH) for help with sorting; R. Schlapbach, A. Bratus, and B. Roschitzki (Functional Genomics Center Zurich) for expert support; B. Kwok (Benaroya Research Institute) for providing BLS cells; N. Vilarrasa, D. Istanbullu, P. Tomas, C. Cruciani (NIMS, University Hospital Zurich, USZ), and F. Catto (USZ) for technical support; A. Kolios (USZ) for samples from psoriasis patients; members of the INIMS, University Medical Center Eppendorf, Hamburg for blood samples; M. Manz and A. Müller (USZ) for leukaphereses; M. Foege for regulatory support; and T. Eng and the staff of the MS Outpatient Clinic and Day Hospital (Neurology Clinic, USZ) for patient-care-related aspects. We thank S. Fillatreau (Université Descartes, Paris) and C. Münz (UZH) for their helpful comments.
Author Contributions
Ivan Jelcic designed, performed, and analyzed experiments (AP assay, cell sorting, B-T cell co-cultures, RNA and TCR-seq analysis, T cell cloning, RASGRP2 reactivity) and co-designed the study. F.A.N. designed, performed, and analyzed experiments (AP assay, ex vivo analysis, TCR-seq analysis). Ivan Jelcic and F.A.N. performed statistical analysis, interpreted the data, and wrote the manuscript. J.W. tested reactivity with the peptide library and interpreted the data. V.L. and A.M. performed AP assay and multicytokine assay and characterized TCCs. R.P. and Y.O. processed brain lesions/infiltrates. S.R., H.G., and F.A.N. performed RASGRP2 reactivity using fluorospot. K.F. analyzed RASGRP2 expression in brain tissue. W.F. performed proteomic analyses. Ilijas Jelcic, A.L., and R.M. participated in sample collection and clinical data characterization. C.H. analyzed the SNP genotyping. C.P. and R.S. analyzed positional scanning library data and biometrical analysis results. L.O. analyzed the RNA-seq data. R.R. provided and characterized MS brain samples for proteomic analysis. G.R. and O.B. provided blood samples of other autoimmune diseases. M.K. supervised the sample collection and collected clinical data of MS patients for the rituximab study. T.O. and F.P. recruited the patients for the rituximab study and interpreted the data. M.S. designed experiments and interpreted the data. J.W., V.L., R.P., Ilijas Jelcic, R.S., C.P., C.H., L.O., G.R., O.B., R.R., A.L., T.O., F.P., and M.S. revised the manuscript. R.M. supervised and designed the study and experiments, interpreted the data, and wrote the manuscript.
Declaration of Interests
R.M. received grant support from Biogen and Novartis and compensation for advice or lecturing by Biogen, Novartis, Sanofi Genzyme, Hoffmann La Roche, Neuway, and CellProtect. R.R. has received compensation for advice and lecturing from Novartis, Roche, and Biogen. T.O. has received unrestricted MS research grants, and/or compensation for lectures, and/or advisory boards from Biogen, Novartis, Roche, Merck, and Genzyme, none of which has impact on the submitted work. R.M. and M.S. are listed as co-inventors on a patent on “Immunodominant proteins and fragments in autoimmune diseases” including RAGSRP2.
Published: August 30, 2018
Footnotes
Supplemental Information includes seven figures and seven tables and can be found with this article online at https://doi.org/10.1016/j.cell.2018.08.011.
Supplemental Information
References
- Balashov K.E., Rottman J.B., Weiner H.L., Hancock W.W. CCR5(+) and CXCR3(+) T cells are increased in multiple sclerosis and their ligands MIP-1alpha and IP-10 are expressed in demyelinating brain lesions. Proc. Natl. Acad. Sci. USA. 1999;96:6873–6878. doi: 10.1073/pnas.96.12.6873. [DOI] [PMC free article] [PubMed] [Google Scholar]
- Basdeo S.A., Cluxton D., Sulaimani J., Moran B., Canavan M., Orr C., Veale D.J., Fearon U., Fletcher J.M. Ex-Th17 (Nonclassical Th1) cells are functionally distinct from classical Th1 and Th17 cells and are not constrained by regulatory T cells. J. Immunol. 2017;198:2249–2259. doi: 10.4049/jimmunol.1600737. [DOI] [PubMed] [Google Scholar]
- Beecham A.H., Patsopoulos N.A., Xifara D.K., Davis M.F., Kemppinen A., Cotsapas C., Shah T.S., Spencer C., Booth D., Goris A., International Multiple Sclerosis Genetics Consortium (IMSGC) Wellcome Trust Case Control Consortium 2 (WTCCC2) International IBD Genetics Consortium (IIBDGC) Analysis of immune-related loci identifies 48 new susceptibility variants for multiple sclerosis. Nat. Genet. 2013;45:1353–1360. doi: 10.1038/ng.2770. [DOI] [PMC free article] [PubMed] [Google Scholar]
- Brinkmann V., Billich A., Baumruker T., Heining P., Schmouder R., Francis G., Aradhye S., Burtin P. Fingolimod (FTY720): discovery and development of an oral drug to treat multiple sclerosis. Nat. Rev. Drug Discov. 2010;9:883–897. doi: 10.1038/nrd3248. [DOI] [PubMed] [Google Scholar]
- Cai G., Hafler D.A. Multispecific responses by T cells expanded by endogenous self-peptide/MHC complexes. Eur. J. Immunol. 2007;37:602–612. doi: 10.1002/eji.200636787. [DOI] [PubMed] [Google Scholar]
- Carbone F., De Rosa V., Carrieri P.B., Montella S., Bruzzese D., Porcellini A., Procaccini C., La Cava A., Matarese G. Regulatory T cell proliferative potential is impaired in human autoimmune disease. Nat. Med. 2014;20:69–74. doi: 10.1038/nm.3411. [DOI] [PubMed] [Google Scholar]
- Carlson C.S., Emerson R.O., Sherwood A.M., Desmarais C., Chung M.W., Parsons J.M., Steen M.S., LaMadrid-Herrmannsfeldt M.A., Williamson D.W., Livingston R.J. Using synthetic templates to design an unbiased multiplex PCR assay. Nat. Commun. 2013;4:2680. doi: 10.1038/ncomms3680. [DOI] [PubMed] [Google Scholar]
- Davidsen B., Kristensen E. A prospective, blind investigation of immunological reactions in chronic inflammatory bowel disease. Suppressor activity and immune capacity. Acta Med. Scand. 1986;219:113–124. doi: 10.1111/j.0954-6820.1986.tb03284.x. [DOI] [PubMed] [Google Scholar]
- Dendrou C.A., Fugger L., Friese M.A. Immunopathology of multiple sclerosis. Nat. Rev. Immunol. 2015;15:545–558. doi: 10.1038/nri3871. [DOI] [PubMed] [Google Scholar]
- Durbin R. Efficient haplotype matching and storage using the positional Burrows-Wheeler transform (PBWT) Bioinformatics. 2014;30:1266–1272. doi: 10.1093/bioinformatics/btu014. [DOI] [PMC free article] [PubMed] [Google Scholar]
- Duszczyszyn D.A., Beck J.D., Antel J., Bar-Or A., Lapierre Y., Gadag V., Haegert D.G. Altered naive CD4 and CD8 T cell homeostasis in patients with relapsing-remitting multiple sclerosis: Thymic versus peripheral (non-thymic) mechanisms. Clin. Exp. Immunol. 2006;143:305–313. doi: 10.1111/j.1365-2249.2005.02990.x. [DOI] [PMC free article] [PubMed] [Google Scholar]
- Euesden J., Lewis C.M., O’Reilly P.F. PRSice: Polygenic Risk Score software. Bioinformatics. 2015;31:1466–1468. doi: 10.1093/bioinformatics/btu848. [DOI] [PMC free article] [PubMed] [Google Scholar]
- Geginat J., Paroni M., Facciotti F., Gruarin P., Kastirr I., Caprioli F., Pagani M., Abrignani S. The CD4-centered universe of human T cell subsets. Semin. Immunol. 2013;25:252–262. doi: 10.1016/j.smim.2013.10.012. [DOI] [PubMed] [Google Scholar]
- Goverman J. Autoimmune T cell responses in the central nervous system. Nat. Rev. Immunol. 2009;9:393–407. doi: 10.1038/nri2550. [DOI] [PMC free article] [PubMed] [Google Scholar]
- Guo T., Kouvonen P., Koh C.C., Gillet L.C., Wolski W.E., Röst H.L., Rosenberger G., Collins B.C., Blum L.C., Gillessen S. Rapid mass spectrometric conversion of tissue biopsy samples into permanent quantitative digital proteome maps. Nat. Med. 2015;21:407–413. doi: 10.1038/nm.3807. [DOI] [PMC free article] [PubMed] [Google Scholar]
- Hafler D.A., Buchsbaum M., Weiner H.L. Decreased autologous mixed lymphocyte reaction in multiple sclerosis. J. Neuroimmunol. 1985;9:339–347. doi: 10.1016/s0165-5728(85)80034-5. [DOI] [PubMed] [Google Scholar]
- Hartmann F.J., Khademi M., Aram J., Ammann S., Kockum I., Constantinescu C., Gran B., Piehl F., Olsson T., Codarri L., Becher B. Multiple sclerosis-associated IL2RA polymorphism controls GM-CSF production in human TH cells. Nat. Commun. 2014;5:5056. doi: 10.1038/ncomms6056. [DOI] [PubMed] [Google Scholar]
- Hauser S.L., Waubant E., Arnold D.L., Vollmer T., Antel J., Fox R.J., Bar-Or A., Panzara M., Sarkar N., Agarwal S., HERMES Trial Group B-cell depletion with rituximab in relapsing-remitting multiple sclerosis. N. Engl. J. Med. 2008;358:676–688. doi: 10.1056/NEJMoa0706383. [DOI] [PubMed] [Google Scholar]
- Hug A., Korporal M., Schröder I., Haas J., Glatz K., Storch-Hagenlocher B., Wildemann B. Thymic export function and T cell homeostasis in patients with relapsing remitting multiple sclerosis. J. Immunol. 2003;171:432–437. doi: 10.4049/jimmunol.171.1.432. [DOI] [PubMed] [Google Scholar]
- Jersild C., Fog T., Hansen G.S., Thomsen M., Svejgaard A., Dupont B. Histocompatibility determinants in multiple sclerosis, with special reference to clinical course. Lancet. 1973;2:1221–1225. doi: 10.1016/s0140-6736(73)90970-7. [DOI] [PubMed] [Google Scholar]
- Kitas G.D., Salmon M., Allan I.M., Bacon P.A. The T cell system in rheumatoid arthritis: activated or defective? Scand. J. Rheumatol. Suppl. 1988;76:161–173. doi: 10.3109/03009748809102966. [DOI] [PubMed] [Google Scholar]
- Kondo T., Cortese I., Markovic-Plese S., Wandinger K.P., Carter C., Brown M., Leitman S., Martin R. Dendritic cells signal T cells in the absence of exogenous antigen. Nat. Immunol. 2001;2:932–938. doi: 10.1038/ni711. [DOI] [PubMed] [Google Scholar]
- Krumbholz M., Derfuss T., Hohlfeld R., Meinl E. B cells and antibodies in multiple sclerosis pathogenesis and therapy. Nat. Rev. Neurol. 2012;8:613–623. doi: 10.1038/nrneurol.2012.203. [DOI] [PubMed] [Google Scholar]
- Laplaud D.A., Ruiz C., Wiertlewski S., Brouard S., Berthelot L., Guillet M., Melchior B., Degauque N., Edan G., Brachet P. Blood T-cell receptor beta chain transcriptome in multiple sclerosis. Characterization of the T cells with altered CDR3 length distribution. Brain. 2004;127:981–995. doi: 10.1093/brain/awh119. [DOI] [PubMed] [Google Scholar]
- Li B., Dewey C.N. RSEM: Accurate transcript quantification from RNA-Seq data with or without a reference genome. BMC Bioinformatics. 2011;12:323. doi: 10.1186/1471-2105-12-323. [DOI] [PMC free article] [PubMed] [Google Scholar]
- Li R., Rezk A., Miyazaki Y., Hilgenberg E., Touil H., Shen P., Moore C.S., Michel L., Althekair F., Rajasekharan S., Canadian B cells in MS Team Proinflammatory GM-CSF-producing B cells in multiple sclerosis and B cell depletion therapy. Sci. Transl. Med. 2015;7:310ra166. doi: 10.1126/scitranslmed.aab4176. [DOI] [PubMed] [Google Scholar]
- Loh P.R., Danecek P., Palamara P.F., Fuchsberger C., A Reshef Y., K Finucane H., Schoenherr S., Forer L., McCarthy S., Abecasis G.R. Reference-based phasing using the Haplotype Reference Consortium panel. Nat. Genet. 2016;48:1443–1448. doi: 10.1038/ng.3679. [DOI] [PMC free article] [PubMed] [Google Scholar]
- Lutterotti A., Yousef S., Sputtek A., Stürner K.H., Stellmann J.P., Breiden P., Reinhardt S., Schulze C., Bester M., Heesen C. Antigen-specific tolerance by autologous myelin peptide-coupled cells: a phase 1 trial in multiple sclerosis. Sci. Transl. Med. 2013;5:188ra75. doi: 10.1126/scitranslmed.3006168. [DOI] [PMC free article] [PubMed] [Google Scholar]
- Magliozzi R., Howell O., Vora A., Serafini B., Nicholas R., Puopolo M., Reynolds R., Aloisi F. Meningeal B-cell follicles in secondary progressive multiple sclerosis associate with early onset of disease and severe cortical pathology. Brain. 2007;130:1089–1104. doi: 10.1093/brain/awm038. [DOI] [PubMed] [Google Scholar]
- McCarthy S., Das S., Kretzschmar W., Delaneau O., Wood A.R., Teumer A., Kang H.M., Fuchsberger C., Danecek P., Sharp K., Haplotype Reference Consortium A reference panel of 64,976 haplotypes for genotype imputation. Nat. Genet. 2016;48:1279–1283. doi: 10.1038/ng.3643. [DOI] [PMC free article] [PubMed] [Google Scholar]
- Mohme M., Hotz C., Stevanovic S., Binder T., Lee J.H., Okoniewski M., Eiermann T., Sospedra M., Rammensee H.G., Martin R. HLA-DR15-derived self-peptides are involved in increased autologous T cell proliferation in multiple sclerosis. Brain. 2013;136:1783–1798. doi: 10.1093/brain/awt108. [DOI] [PubMed] [Google Scholar]
- Molnarfi N., Schulze-Topphoff U., Weber M.S., Patarroyo J.C., Prod’homme T., Varrin-Doyer M., Shetty A., Linington C., Slavin A.J., Hidalgo J. MHC class II-dependent B cell APC function is required for induction of CNS autoimmunity independent of myelin-specific antibodies. J. Exp. Med. 2013;210:2921–2937. doi: 10.1084/jem.20130699. [DOI] [PMC free article] [PubMed] [Google Scholar]
- Mullard A. BTK inhibitors get a boost. Nat. Rev. Drug Discov. 2017;16:818. doi: 10.1038/nrd.2017.250. [DOI] [PubMed] [Google Scholar]
- Muraro P.A., Douek D.C., Packer A., Chung K., Guenaga F.J., Cassiani-Ingoni R., Campbell C., Memon S., Nagle J.W., Hakim F.T. Thymic output generates a new and diverse TCR repertoire after autologous stem cell transplantation in multiple sclerosis patients. J. Exp. Med. 2005;201:805–816. doi: 10.1084/jem.20041679. [DOI] [PMC free article] [PubMed] [Google Scholar]
- Olsson T., Barcellos L.F., Alfredsson L. Interactions between genetic, lifestyle and environmental risk factors for multiple sclerosis. Nat. Rev. Neurol. 2017;13:25–36. doi: 10.1038/nrneurol.2016.187. [DOI] [PubMed] [Google Scholar]
- Pal Singh S., Dammeijer F., Hendriks R.W. Role of Bruton’s tyrosine kinase in B cells and malignancies. Mol. Cancer. 2018;17:57. doi: 10.1186/s12943-018-0779-z. [DOI] [PMC free article] [PubMed] [Google Scholar]
- Palanichamy A., Apeltsin L., Kuo T.C., Sirota M., Wang S., Pitts S.J., Sundar P.D., Telman D., Zhao L.Z., Derstine M. Immunoglobulin class-switched B cells form an active immune axis between CNS and periphery in multiple sclerosis. Sci. Transl. Med. 2014;6:248ra106. doi: 10.1126/scitranslmed.3008930. [DOI] [PMC free article] [PubMed] [Google Scholar]
- Paroni M., Maltese V., De Simone M., Ranzani V., Larghi P., Fenoglio C., Pietroboni A.M., De Riz M.A., Crosti M.C., Maglie S. Recognition of viral and self-antigens by TH1 and TH1/TH17 central memory cells in patients with multiple sclerosis reveals distinct roles in immune surveillance and relapses. J. Allergy Clin. Immunol. 2017;140:797–808. doi: 10.1016/j.jaci.2016.11.045. [DOI] [PubMed] [Google Scholar]
- Pinilla C., Appel J.R., Houghten R.A. Investigation of antigen-antibody interactions using a soluble, non-support-bound synthetic decapeptide library composed of four trillion (4 x 10(12) sequences. Biochem. J. 1994;301:847–853. doi: 10.1042/bj3010847. [DOI] [PMC free article] [PubMed] [Google Scholar]
- Planas R., Jelčić I., Schippling S., Martin R., Sospedra M. Natalizumab treatment perturbs memory- and marginal zone-like B-cell homing in secondary lymphoid organs in multiple sclerosis. Eur. J. Immunol. 2012;42:790–798. doi: 10.1002/eji.201142108. [DOI] [PubMed] [Google Scholar]
- Planas R., Metz I., Ortiz Y., Vilarrasa N., Jelčić I., Salinas-Riester G., Heesen C., Brück W., Martin R., Sospedra M. Central role of Th2/Tc2 lymphocytes in pattern II multiple sclerosis lesions. Ann. Clin. Transl. Neurol. 2015;2:875–893. doi: 10.1002/acn3.218. [DOI] [PMC free article] [PubMed] [Google Scholar]
- Planas R., Metz I., Martin R., Sospedra M. Detailed characterization of T cell receptor repertoires in multiple sclerosis brain lesions. Front. Immunol. 2018;9:509. doi: 10.3389/fimmu.2018.00509. [DOI] [PMC free article] [PubMed] [Google Scholar]
- Polman C.H., Reingold S.C., Banwell B., Clanet M., Cohen J.A., Filippi M., Fujihara K., Havrdova E., Hutchinson M., Kappos L. Diagnostic criteria for multiple sclerosis: 2010 revisions to the McDonald criteria. Ann. Neurol. 2011;69:292–302. doi: 10.1002/ana.22366. [DOI] [PMC free article] [PubMed] [Google Scholar]
- Reboldi A., Coisne C., Baumjohann D., Benvenuto F., Bottinelli D., Lira S., Uccelli A., Lanzavecchia A., Engelhardt B., Sallusto F. C-C chemokine receptor 6-regulated entry of TH-17 cells into the CNS through the choroid plexus is required for the initiation of EAE. Nat. Immunol. 2009;10:514–523. doi: 10.1038/ni.1716. [DOI] [PubMed] [Google Scholar]
- Robins H.S., Campregher P.V., Srivastava S.K., Wacher A., Turtle C.J., Kahsai O., Riddell S.R., Warren E.H., Carlson C.S. Comprehensive assessment of T-cell receptor beta-chain diversity in alphabeta T cells. Blood. 2009;114:4099–4107. doi: 10.1182/blood-2009-04-217604. [DOI] [PMC free article] [PubMed] [Google Scholar]
- Robinson M.D., McCarthy D.J., Smyth G.K. edgeR: a Bioconductor package for differential expression analysis of digital gene expression data. Bioinformatics. 2010;26:139–140. doi: 10.1093/bioinformatics/btp616. [DOI] [PMC free article] [PubMed] [Google Scholar]
- Sawcer S., Hellenthal G., Pirinen M., Spencer C.C., Patsopoulos N.A., Moutsianas L., Dilthey A., Su Z., Freeman C., Hunt S.E., International Multiple Sclerosis Genetics Consortium. Wellcome Trust Case Control Consortium 2 Genetic risk and a primary role for cell-mediated immune mechanisms in multiple sclerosis. Nature. 2011;476:214–219. doi: 10.1038/nature10251. [DOI] [PMC free article] [PubMed] [Google Scholar]
- Schopf R.E., Hoffmann A., Jung M., Morsches B., Bork K. Stimulation of T cells by autologous mononuclear leukocytes and epidermal cells in psoriasis. Arch. Dermatol. Res. 1986;279:89–94. doi: 10.1007/BF00417528. [DOI] [PubMed] [Google Scholar]
- Sorensen P.S., Koch-Henriksen N., Petersen T., Ravnborg M., Oturai A., Sellebjerg F. Recurrence or rebound of clinical relapses after discontinuation of natalizumab therapy in highly active MS patients. J. Neurol. 2014;261:1170–1177. doi: 10.1007/s00415-014-7325-8. [DOI] [PubMed] [Google Scholar]
- Sospedra M., Martin R. Immunology of multiple sclerosis. Annu. Rev. Immunol. 2005;23:683–747. doi: 10.1146/annurev.immunol.23.021704.115707. [DOI] [PubMed] [Google Scholar]
- Sospedra M., Zhao Y., Giulianotti M., Simon R., Pinilla C., Martin R. Combining positional scanning peptide libraries, HLA-DR transfectants and bioinformatics to dissect the epitope spectrum of HLA class II cross-restricted CD4+ T cell clones. J. Immunol. Methods. 2010;353:93–101. doi: 10.1016/j.jim.2009.12.006. [DOI] [PubMed] [Google Scholar]
- Stern J.N., Yaari G., Vander Heiden J.A., Church G., Donahue W.F., Hintzen R.Q., Huttner A.J., Laman J.D., Nagra R.M., Nylander A. B cells populating the multiple sclerosis brain mature in the draining cervical lymph nodes. Sci. Transl. Med. 2014;6:248ra107. doi: 10.1126/scitranslmed.3008879. [DOI] [PMC free article] [PubMed] [Google Scholar]
- Stone J.C. Regulation and function of the RasGRP family of Ras activators in blood cells. Genes Cancer. 2011;2:320–334. doi: 10.1177/1947601911408082. [DOI] [PMC free article] [PubMed] [Google Scholar]
- Toki S., Kawasaki H., Tashiro N., Housman D.E., Graybiel A.M. Guanine nucleotide exchange factors CalDAG-GEFI and CalDAG-GEFII are colocalized in striatal projection neurons. J. Comp. Neurol. 2001;437:398–407. doi: 10.1002/cne.1291. [DOI] [PubMed] [Google Scholar]
- Tuller T., Atar S., Ruppin E., Gurevich M., Achiron A. Common and specific signatures of gene expression and protein-protein interactions in autoimmune diseases. Genes Immun. 2013;14:67–82. doi: 10.1038/gene.2012.55. [DOI] [PubMed] [Google Scholar]
- Wiśniewski J.R., Zougman A., Nagaraj N., Mann M. Universal sample preparation method for proteome analysis. Nat. Methods. 2009;6:359–362. doi: 10.1038/nmeth.1322. [DOI] [PubMed] [Google Scholar]
- Wucherpfennig K.W., Strominger J.L. Molecular mimicry in T cell-mediated autoimmunity: viral peptides activate human T cell clones specific for myelin basic protein. Cell. 1995;80:695–705. doi: 10.1016/0092-8674(95)90348-8. [DOI] [PMC free article] [PubMed] [Google Scholar]
- Yamano T., Nedjic J., Hinterberger M., Steinert M., Koser S., Pinto S., Gerdes N., Lutgens E., Ishimaru N., Busslinger M. Thymic B cells are licensed to present self antigens for central T cell tolerance induction. Immunity. 2015;42:1048–1061. doi: 10.1016/j.immuni.2015.05.013. [DOI] [PubMed] [Google Scholar]
- Yednock T.A., Cannon C., Fritz L.C., Sanchez-Madrid F., Steinman L., Karin N. Prevention of experimental autoimmune encephalomyelitis by antibodies against alpha 4 beta 1 integrin. Nature. 1992;356:63–66. doi: 10.1038/356063a0. [DOI] [PubMed] [Google Scholar]
- Yousef S., Planas R., Chakroun K., Hoffmeister-Ullerich S., Binder T.M., Eiermann T.H., Martin R., Sospedra M. TCR bias and HLA cross-restriction are strategies of human brain-infiltrating JC virus-specific CD4+ T cells during viral infection. J. Immunol. 2012;189:3618–3630. doi: 10.4049/jimmunol.1201612. [DOI] [PubMed] [Google Scholar]
- Zhao Y., Gran B., Pinilla C., Markovic-Plese S., Hemmer B., Tzou A., Whitney L.W., Biddison W.E., Martin R., Simon R. Combinatorial peptide libraries and biometric score matrices permit the quantitative analysis of specific and degenerate interactions between clonotypic TCR and MHC peptide ligands. J. Immunol. 2001;167:2130–2141. doi: 10.4049/jimmunol.167.4.2130. [DOI] [PubMed] [Google Scholar]
- Zvyagin I.V., Pogorelyy M.V., Ivanova M.E., Komech E.A., Shugay M., Bolotin D.A., Shelenkov A.A., Kurnosov A.A., Staroverov D.B., Chudakov D.M. Distinctive properties of identical twins’ TCR repertoires revealed by high-throughput sequencing. Proc. Natl. Acad. Sci. USA. 2014;111:5980–5985. doi: 10.1073/pnas.1319389111. [DOI] [PMC free article] [PubMed] [Google Scholar]
Associated Data
This section collects any data citations, data availability statements, or supplementary materials included in this article.