

Summary
LINE-1 retrotransposition is tightly restricted by layers of regulatory control, with epigenetic pathways being the best characterized. Looking at post-transcriptional regulation, we now show that LINE-1 mRNA 3′ ends are pervasively uridylated in various human cellular models and in mouse testes. TUT4 and TUT7 uridyltransferases catalyze the modification and function in cooperation with the helicase/RNPase MOV10 to counteract the RNA chaperone activity of the L1-ORF1p retrotransposon protein. Uridylation potently restricts LINE-1 retrotransposition by a multilayer mechanism depending on differential subcellular localization of the uridyltransferases. We propose that uridine residues added by TUT7 in the cytoplasm inhibit initiation of reverse transcription of LINE-1 mRNAs once they are reimported to the nucleus, whereas uridylation by TUT4, which is enriched in cytoplasmic foci, destabilizes mRNAs. These results provide a model for the post-transcriptional restriction of LINE-1, revealing a key physiological role for TUT4/7-mediated uridylation in maintaining genome stability.
Keywords: LINE-1, retrotransposition, uridylation, 3′ RACE-seq, TUT7, TUT4, MOV10, L1-ORF1p, L1-ORF2p, poly(A)
Graphical Abstract
Highlights
-
•
3′ uridylation of LINE-1 mRNAs is pervasive
-
•
Uridylation by TUT4/TUT7 inhibits LINE-1 retrotransposition
-
•
MOV10 helicase facilitates LINE-1 mRNA uridylation
-
•
TUT4 and TUT7 have differential effects on LINE-1 mRNAs
Post-transcriptional modification of LINE-1 mRNAs offers a general way to restrict retrotransposition across cell types to maintain genome integrity.
Introduction
Long interspersed element-1 (LINE-1, thereafter L1) is a group of active non-long-terminal repeat retrotransposons. Through their ability to mobilize and insert into new genomic locations via a copy-and-paste mechanism, L1s have acted as a major dynamic force that shaped the genomes of humans, mice, and other vertebrate species (Cordaux and Batzer, 2009, Faulkner and Garcia-Perez, 2017). Roughly 500,000 L1 copies constitute ∼17% of the human genome. Because of 5′ truncations, rearrangements, and mutations, most L1s can no longer mobilize. However, in an average human genome 80–100 L1 copies remain potentially active with just <10 highly active L1 copies accounting for genetic variation and mosaicism in humans (reviewed in Beck et al., 2011, Hancks and Kazazian, 2012).
Active L1 elements are ∼6–7 kb in length and contain: a 5′ UTR, two open reading frames (ORFs) separated by a short linker sequence, and a short 3′ UTR. The 5′ UTR contains an internal RNA polymerase II promoter (Swergold, 1990) that drives transcription of the bicistronic L1 mRNA which is translated by an unconventional mechanism into L1-ORF1p and L1-ORF2p (Alisch et al., 2006, Dmitriev et al., 2007). L1-ORF1p is a 40 kDa nucleic acid chaperone which, upon translation, forms homotrimers and tightly encapsulates its parental mRNA (Callahan et al., 2012, Khazina et al., 2011, Martin et al., 2003, Naufer et al., 2016). The 150 kDa L1-ORF2p functions as an endonuclease (Feng et al., 1996) and reverse transcriptase (Mathias et al., 1991). L1-ORF2p is translated far less efficiently than L1-ORF1p (Alisch et al., 2006) and is thought to associate with the poly(A) tail of L1 mRNA (Doucet et al., 2015). L1-ORF2p, together with L1-mRNA encapsulated by L1-ORF1p, forms a minimal retrotransposition particle, or L1-RNP (Doucet et al., 2010, Kulpa and Moran, 2005). Once in the nucleus, L1-RNPs generate new L1 insertions in the genome through a mechanism termed “target-primed reverse transcription” (TPRT) (Jurka, 1997).
Many cellular pathways act to restrict retrotransposition at transcriptional and post-transcriptional levels (reviewed in Goodier, 2016, Pizarro and Cristofari, 2016, Yang and Wang, 2016). However, the mechanism of the latter is not clear. Even for the well-established retrotransposition and retrovirus restriction factor, the RNA helicase MOV10 (Arjan-Odedra et al., 2012, Choi et al., 2018, Goodier et al., 2012, Li et al., 2013, Lu et al., 2012, Skariah et al., 2017), the exact mechanisms of action remain to be clarified.
Here, we examined 3′ uridylation of L1 retrotransposons. The uridylation process involves addition of non-templated uridine residues to 3′ ends of RNA by terminal uridyltransferases (TUTases). In fact, cytoplasmic uridylation mediated by two multi-domain TUTases, TUT4 and TUT7, is an abundant and important modification of 3′ ends of a variety of cellular RNAs (reviewed in Łabno et al., 2016a, Norbury, 2013) including histone mRNAs (Mullen and Marzluff, 2008, Schmidt et al., 2011), let-7 pre-miRNAs (Heo et al., 2012, Faehnle et al., 2017), mature miRNAs (Thornton et al., 2014), canonical mRNAs (Lim et al., 2014), and multiple non-coding RNAs (Łabno et al., 2016b, Pirouz et al., 2016, Ustianenko et al., 2016). Although monouridylation of pre-let7 is involved in biogenesis of mature miRNAs (Heo et al., 2012), in all other known instances, uridylation is linked to RNA destabilization, with an apparent role in apoptosis-inducing global mRNA decay (Thomas et al., 2015). Another uridyltransferase in human cells is nuclear TUT1, which is involved in the maturation of U6 small nuclear RNA (snRNA) (Mroczek and Dziembowski, 2013).
Herein, we present a mechanism for L1 retrotransposition restriction. First, we demonstrate abundant uridylation of endogenous L1 mRNAs in a variety of human cell types and mice testes and show that uridylated L1 mRNAs have severely compromised retrotransposition, despite their apparent persistence in the cell and lack of major effects of uridylation on L1-ORF1p and L1-ORF2p abundance. Uridylation involves cooperation between MOV10 helicase and TUT4 and TUT7, as revealed by a combination of in vivo and in vitro experiments. We speculate that uridylation-dependent restriction occurs by the inhibition of initiation of RT by L1-ORF2p during TPRT and, partially, by enhanced L1 mRNA decay.
Results
TUT4/7 Restrict Retrotransposition of Active Human L1s
New genomic insertions of L1 retrotransposons by TPRT rely on the endonuclease and reverse transcriptase activities of L1-ORF2p, which first nicks genomic DNA preferentially within a 5′-TTTT/AA consensus sequence, exposing an oligo dT stretch that, after base pairing with the L1 RNA poly(A) tail, serves as a primer for RT (Doucet et al., 2015, Jurka, 1997, Monot et al., 2013).
We hypothesized that uridylation of L1 mRNA might interfere with the base-pairing during TPRT, leading to reduction of L1 retrotransposition. We therefore tested the effect of all human TUTases – cytoplasmic TUT4 and TUT7 and nuclear TUT1 on human L1 retrotransposition, using a reporter assay in cultured cells (Moran et al., 1996, Ostertag et al., 2000; reviewed in Kopera et al. [2016]). In the assay, cells are transfected with a plasmid encoding a retrotransposition-competent L1 element tagged with a retrotransposition indicator cassette (EGFP or neomycin antibiotic resistance) cloned in the antisense orientation in the 3′ UTR of the L1 (Figure 1A).
Figure 1.

TUT4 and TUT7 Restrict L1 Retrotransposition
(A) Flowchart of the plasmid-based L1 retrotransposition assays that allow assessment of retrotransposition events by either flow cytometry-based monitoring of cellular EGFP fluorescence (megfpI reporter) or counting drug-resistant colonies (mneoI reporter).
(B) Effects of overexpression of either WT or mutant (MT) TUT4 or TUT7 or WT TUT1, MOV10, or MBP (control) (each point = biological replicate) on L1 retrotransposition in HEK293T cells. Negative control (JM111): a retrotransposition-defective reporter (L1-ORF1pR261A/R262A). The results of independent experiments were normalized relative to the control (MBP). Statistical significance was calculated using one-way ANOVA and Tukey’s multiple comparison test (∗∗∗p < 0.001; ∗∗p < 0.01; and ∗p < 0.05, in comparison to MBP).
(C) Retrotransposition assay in HEK293T cells depleted of TUT7, TUT4 (alone or combined), MOV10, or TUT1 using siRNAs. A control with a non-targeting siRNA was included (CNTRL). Normalization was done relative to CNTRL. Statistical analysis was performed like in (B) (comparison to CNTRL shown). There is no significant difference between CNTRL and TUT1, and a comparison to TUT1 instead of CNTRL gives the same statistical significances.
(D) L1 retrotransposition assays in HeLa-HA cells using mneoI L1 retrotransposition reporter assay. The results were normalized, relative to the control non-targeting siRNA (CNTRL). Statistical analysis is the same as that performed in (B). Shown are comparisons to CNTRL. Normalization was done to CNTRL.
Data in (B)–(D) are represented as medians with individual points and interquartile ranges. See also Figure S1.
We co-transfected HEK293T cells with an active human L1 reporter tagged with the megfpI cassette (Ostertag et al., 2000), together with plasmids for overexpression of wild-type (WT) TUT4, TUT7, TUT1, or TUT4 and TUT7 catalytically inactive mutants. As controls, we used plasmids that overexpress MBP protein, a plasmid for overexpression of MOV10 (positive control for retrotransposition restriction) and a mutant retrotransposition-incompetent L1 (JM111) (Moran et al., 1996). L1 retrotransposition was assessed by flow cytometry. Notably, overexpression of WT TUT4 and TUT7, but neither of their catalytic mutants or WT TUT1, inhibited retrotransposition >5-fold (Figure 1B). As expected, L1 retrotransposition was reduced by MOV10 overexpression and the mutant L1 construct failed to retrotranspose (Figure 1B). Additional controls revealed that all co-transfected factors were expressed at similar levels and did not elicit cytotoxicity (Figures S1A, left panel, and S1B). Furthermore, we tested other known human TENTs (terminal nucleotidyltransferases) including TENT2, TENT4B, and TENT5C, a member of a novel TENT family and a terminal polyadenylase (Mroczek et al., 2017). Neither of these enzymes significantly reduced L1 retrotransposition (Figures S1A and S1C).
Figure S1.

Control Experiments for Plasmid-Based L1 Retrotransposition Assays, Related to Figure 1
(A) Western blotting to show expression of N’-MBP-tagged WT and MT TUT4, TUT7, MOV10 (lanes 1-5), N’-FLAG-tagged MT and WT TUT7 and MOV10 (lanes 6-8), C’-FLAG-tagged TENT4B, TENT2, TUT1 and TENT5C (lanes 9-12). Blots were probed with mouse monoclonal antibodies against MBP or rabbit polyclonal antibodies against FLAG. A probing for γ-tubulin and ponceau S staining were added as loading controls. A black arrow points to weakly expressed TENT2-FLAG in lane 10.
(B and D) A plasmid encoding EGFP was used to test transfection efficiencies and toxicity (EGFP expression) concomitantly with co-transfection of a plasmid overexpressing wild-type or mutant TUT4, TUT7, MOV10 or MBP (CNTRL, B) or concomitantly with siRNA-directed depletion of both TUT4/7, TUT4, TUT7, MOV10 or non-targeting control (CNTRL, D). Data for 9 biological replicates (three independent experiments; panel B) and 3–6 biological replicates (two independent experiments, D) were normalized to controls. Means with SEM are plotted. No significant differences were observed as assessed by one-way ANOVA and Tukey’s multiple comparison test.
(C) L1 retrotransposition assay in HEK293T cells with L1-megfpI reporters and concomitant overexpression of the indicated protein (as in panel A). Normalization was done to TUT7 MT. Statistical significance was calculated using one-way ANOVA and Tukey’s multiple comparison test. Statistical significance of TUT7 WT condition versus TUT7 mutant and the TENTs is shown (∗∗∗p < 0.001).
(E) Western blotting to test depletion of endogenous TUT4, TUT7, both TUTases or MOV10 by siRNAs (probed with specific antibodies; probing with α-tubulin was used as a loading control). Cells were co-transfected with the L1 megfpI reporter concomitantly with siRNAs. Cells were collected on day 4 post-transfection and split for flow-cytometry and western blotting. An asterisk marks an unspecific band detected by the anti-TUT7 antibodies (the band can be used to assess loading). Probing with the anti-α-tubulin mouse monoclonal antibodies showed 2 bands and was not used in other blots in the paper.
(F) RT-qPCR estimation of TUT1 depletion at mRNA level by siRNAs at day 3 post-transfection (in cells co-transfected with the L1 megfpI reporter). Expression was normalized to control.
(G) Western blotting to test depletion of TUT4 and TUT7, MOV10 or both TUTases and MOV10 in HeLa-HA cells under conditions used for retrotransposition assay with the mneoI reporter. Cells were collected at day 3 post-transfection (after co-transfection with L1-mneoI plasmids).
Data on panels C and F are presented as medians with individual points and interquartile ranges shown.
The western blotting exposures were done either to a film and scanned by an Epson scanner and bottom scanning option (panel G) or by a CCD camera (panels A and E). The singnals in the images acuired with a CCD camera were digitally enhanced by using ‘adjust levels’ option for the entire images.
To validate these results, in a reciprocal experiment, we co-transfected L1 reporter with small interfering RNAs (siRNAs) targeting TUT4 and TUT7 or MOV10. Accordingly, silencing of TUTases increased retrotransposition by ∼2.2-fold relative to the controls (non-targeting siRNAs) (Figures 1C, S1D, and S1E). However, when only TUT4 or TUT7 was depleted, we observed a stronger effect for TUT7 (∼2-fold) than for TUT4 (∼1.5-fold). Silencing of TUT1 had no effect (Figures 1C and S1F).
Finally, we used a different cell line (HeLa-HA) and a mneoI retrotransposition indicator cassette, which, upon retrotransposition, confers resistance to G418 (Moran et al., 1996). Retrotransposition frequency was then estimated by the number of G418-resistant colonies (Figure 1A). Depletion of TUT7, TUT4, or MOV10 resulted in a significant increase in the number of G418-resistant foci (Figures 1D and S1G).
Taken together, we show that TUT4 and TUT7 strongly reduce L1 retrotransposition to levels similar to those observed with MOV10. On the contrary, TUT1 and other human TENTs do not affect L1 retrotransposition.
L1 mRNAs Are Uridylated
To uncover the molecular foundation of the observed L1 retrotransposition restriction by TUT4 and TUT7, we investigated 3′ ends of endogenous and reporter L1 mRNAs, using 3′ RACE-seq with individual transcript barcoding and TAIL-seq bioinformatics pipeline (Chang et al., 2014) (Figure S7; Table S1).
Figure S7.

Graphical Visualization of the 3′ RACE-Seq Approach, Related to Figure 2
(A) Graphical representation of 3′ RACE-seq library preparation and the oligonucleotides used. First, the 3′ adaptor RA3_15N was joined to the 3′ end of RNA by enzymatic ligation. The adaptor has: (i) 5′ rApp modification for efficient and specific ligation by the truncated T4 RNA ligase 2, (ii) delimiter sequence to be used in bioinformatics analyses to exclude RT and PCR artifacts (CTGAC, highlighted in violet), (iii) unique 15N barcode for individual transcript barcoding (highlighted in green), (iv) anchor sequence to pair with the reverse transcription primer (underlined) and (v) dideoxyC on the 3′ end to prevent concatamer formation. The RNA ligated to the adaptor sequence was purified from excess adaptor and reverse transcription was performed with the RT primer, which is compatible with Illumina sequencing and has: (i) sequences to base-pair with the adaptor (underlined), (ii) 6-nucleotide barcode for sample barcoding (highlighted in red), (iii) sequences that base pair with the universal outer primer for nested PCR (blue).
Libraries were generated by nested PCR with 2 outer forward primers (F1 and F2) and a single universal reverse primer (uni rev). PCR amplicons of first and second PCRs were purified from excess primers on AmPure beads (Agencourt) before beginning the next step.
(B) Flowchart of the bioinformatics approach to 3′ RACE-seq data analysis. The procedure starts at the top. Datasets are shown in rectangles. Software used is depicted in hexagons.
We first investigated endogenous L1 mRNAs in a panel of human cells and in testes of P10 mice in which L1s are naturally overexpressed (Branciforte and Martin, 1994, Coufal et al., 2009, Garcia-Perez et al., 2010, Muotri et al., 2005). Remarkably, ∼30%–50% of all L1 mRNAs were uridylated (Figures 2A and 2B). Furthermore, a significant fraction of L1 mRNAs did not possess poly(A) tails, and were instead truncated within their 3′ UTRs, while 10%–25% of those non-poly(A) were oligouridylated (Figure 2B, U-tail). Our data reveal that endogenous L1 mRNAs contained mostly only short (uridylated) oligoadenine tails of ∼15 adenines (As) and ∼3 uridines (Us) (Figure S2A; Table S2). Using human embryonic carcinoma cells (PA-1) we showed that the combined depletion of TUT4 and TUT7 significantly lowered the fraction of uridylated L1 mRNAs, with a concomitant increase in the adenylated fraction (Figures 2C and S2B). This was also visible for some control mRNAs including ACTB, GAPDH, PABPC4, and SOGA2 (Figures S2A and S2C).
Figure 2.

3′ RACE-Seq of L1 and Control mRNAs
(A) Fraction of uridylated endogenous L1 mRNAs in human embryonic carcinoma cells (PA-1), human embryonic stem cells (H9-hESCs), human neuronal progenitor cells (derived from hESCs, NPC) and in mouse testes (of P10 young mice; 4 mice, 8 testes).
(B) Distribution of 3′ tails in endogenous L1 mRNAs. The tails were assigned to one of four classes: U-tail (mono- and oligouridylated, but not adenylated); AU-tail (adenylated and mono- and oligouridylated); “no tail” (neither adenylated nor uridylated, mostly truncated within the 3′ UTR); A-tail (oligo- and polyadenylated).
(C) Effect of siRNA-mediated depletion of MOV10 or TUT4 and TUT7 on uridylation of endogenous L1 mRNAs in PA-1. Statistical significance was calculated using one-way ANOVA and Tukey’s multiple comparison test. The comparison and significance are shown relative to a non-targeting siRNA control (CNTRL, ∗∗p < 0.01).
(D) Uridylation of reporter L1 mRNAs in HEK293 cells under overexpression of MBP (CNTRL), WT, and MT TUT7, TUT4, or MOV10 as indicated. Statistical significance was calculated like in (C).
(E) Distribution of 3′ tails in reporter L1 mRNAs, visualized like in (B) under MBP, TUT4, TUT7, or MOV10 overexpression conditions as indicated. White-dashed line and black-dashed line indicate control sample levels of uridylated (U+AU-tails) and adenylated L1 mRNAs, respectively.
(F) Effects of overexpression of TUT1 and TENT5C on uridylation of reporter L1 mRNAs in HEK293 cells. Statistical significance was calculated like in (C).
(G) Effects of depleting TUT4, TUT7, or both TUTases using siRNAs in HEK293 cells on uridylation of reporter L1 mRNAs. Statistical significance was calculated like in (C).
(H) Distribution of 3′ tails in reporter L1 mRNAs, visualized like in (B) under TUT4, TUT4, and TUT7 or TUT7 depletion conditions in HEK293 cells as indicated.
(I) Distribution of endogenous L1 and control mRNAs’ (ACTB, GAPDH, and SOGA2) 3′ ends in the cytoplasmic and nuclear compartments of PA-1 cells. The numbers of sequenced 3′ RACE reads are indicated and plotted assuming cyto+nuc = 100%. Qualities of the mRNAs’ 3′ ends are color-coded like in (B).
Data in (A), (C), (D), (F), and (G) are medians with individual points and interquartile ranges shown. See also Figures S2 and S7 and Tables S1 and S2.
Figure S2.

3′ RACE-Seq of Endogenous and Reporter L1 mRNAs and of Control Cellular mRNAs, Related to Figure 2
(A) Distribution of U-tails, AU-tails and A-tails in endogenous L1, ACTB, GAPDH, PABPC4 and SOGA2 mRNAs (as indicated) possessing non-templated 3′ end nucleotides in the indicated cells/organs: PA-1 cells, human embryonic stem cells (H9), human neuronal progenitor cells (NPC) and in mouse testes (MT). The fraction of transcript 3′ ends is shown in the y axis with total set to 100%. Tails were binned in 10-nucleotide bins (but 1-9 and 60+) according to their length and are visualized in x axis. A black dashed line overlaid onto the graphs and represents total tail-length distribution, normalized to 100% and shown as % of total transcripts (y axis).
(B) Distribution of 3′ tails in endogenous L1 mRNAs in PA-1 cells transfected with control non-targeting siRNA (CNTRL) or siRNAs against MOV10 or TUT4 and TUT7. The tails were assigned to one of four classes: U-tail (mono- and oligouridylated, but not adenylated); AU-tail (adenylated and mono- and oligouridylated); “no tail” (neither adenylated nor uridylated, mostly truncated within the 3′ UTR); A-tail (oligo- and polyadenylated).
(C) Uridylation of control mRNAs: ACTB, GAPDH and PABPC4 (as indicated) in PA-1 cells transfected with control non-targeting siRNA (CNTRL) or siRNAs against MOV10 or TUT4 and TUT7. Statistical significance was calculated using one-way ANOVA and Tukey’s multiple comparison test significance (∗∗∗p < 0.001). No statistical significance was reported between CNTRL and MOV10 depletion.
(D) Distribution of U-tail lengths in reporter L1 mRNAs in HEK293 cells under overexpression of the indicated proteins. The U-tails were grouped according to the number of uridines. Data were normalized to all mRNAs for a given condition.
(E) Examples of 3′ RACE clones with reporter L1 mRNAs, to show the presence of oligouridylated (1,2) and oligoadenylated and oligouridylated 3′ ends (3). Dashed lined boxes indicate the presence of non-templated nucleotides. Blue background indicates 5′ end of the 3′ adaptor used (different for 1, 2 and 3).
(F) Uridylation of control mRNAs: ACTB, GAPDH, PABPC4 and SOGA2 (as indicated) in HEK293 cells overexpressing MBP (CNTRL), wild-type or mutant TUT4/7 and MOV10. Statistical tests were performed as in panel C. No statistically significant changes were observed.
(G) Uridylation of control mRNAs: ACTB, GAPDH, PABPC4 and SOGA2 (as indicated) in HEK293 cells depleted of TUT4 and TUT7 or TUT1 (as indicated). Statistical significance was calculated as in panel C and is shown where applicable.
(H) Distribution of U-tail lengths on reporter L1 mRNAs in HEK293 cells under depletion of the indicated proteins. The U-tails were grouped according to the number of uridines. Data were normalized to all mRNAs for a given condition.
(I) Uridylation of L1 reporter mRNAs in control HEK293 cells (transfected with non-targeting siRNAs, CNTRL) and in cells depleted of TUT1.
Data on panels C, F, G, and I are represented as medians with individual points and interquartile ranges shown.
Next, we investigated the uridylation status of reporter L1 mRNAs in HEK293 cells. Notably, only ∼50% of the L1 reporter transcripts had adenylated 3′ ends. Moreover, we observed a statistically significant increase in uridylation of L1 reporter mRNAs in TUT7 WT, TUT4 WT, and MOV10-overexpressing cells in comparison to the controls: MBP and the catalytic mutants of TUT7 and TUT4 (Figure 2D). The increase in uridylation was accompanied by a decrease in adenylation of L1 reporter mRNAs (Figure 2E). Most of the uridylated L1 reporter 3′ ends contained on average ∼2.5 Us in controls and ∼3.5 Us in TUT4, TUT7, and MOV10 overexpression, although >10 Us oligouridine tails were also present (Figures S2D and S2E). When TUT1 and TENT5C were overexpressed, we observed a non-significant increase in L1 reporter uridylation (Figure 2F). To further test whether uridylation under TUT4, TUT7, or MOV10 overexpression is specific to L1 mRNA or general, we performed 3′ RACE-seq of mRNAs: ACTB, GAPDH, PABPC4, and SOGA2 (the latter two reported as highly uridylated mRNAs in HeLa cells; Chang et al., 2014). We did not observe effects on uridylation of these mRNAs (Figure S2F), thus demonstrating that under our experimental conditions L1 reporter mRNAs were preferentially uridylated. We then tested effects of TUT4, TUT7, and TUT1 depletion on L1 reporter mRNA 3′ ends. As expected, depletion of both TUT4 and TUT7 resulted in a significant drop of L1 uridylation and a concomitant increase in their adenylation (Figures 2G, 2H, and S2H). The same effects were observed for the four control mRNAs (Figure S2G). Finally, consistent with the data on endogenous L1 mRNAs, the depletion of TUT1 had no effect (Figure S2I).
To retrotranspose, L1 RNPs must access the nucleus. Thus, we performed 3′ RACE-seq on RNAs isolated from the nucleus and cytoplasm of PA-1 cells. In stark contrast to control mRNAs (ACTB, GAPDH, and SOGA2), that were present mainly in the cytoplasm, endogenous L1 mRNAs were evenly distributed among cytoplasmic and nuclear compartments (Figure 2I). Moreover, a significant fraction of uridylated L1 mRNAs was detected in the nuclei, suggesting that nuclear re-import of L1 RNPs is not affected.
In sum, we demonstrate abundant uridylation of L1 mRNAs. Moreover, the data raise a possibility that MOV10 may functionally co-operate with TUT4 and TUT7 in uridylating L1 mRNAs.
Inclusion of 3′ Uridines Restricts L1 Retrotransposition
To test whether 3′ uridylation of L1 mRNAs affects retrotransposition, we generated a set of L1 megfpI-tagged reporters containing a tRNA-like element that is cleaved off at its 5′ end by endogenous nuclear RNase P, thus yielding L1 reporters with precisely defined 3′ ends. We prepared L1 reporters ending in homonucleotide tracts of 19A, 26A, 40A, 7U, and 26U, and reporters containing 19A, 26A, or 40A plus a variable number of 3′ uridines including: 19A1U, 19A3U, 26A1U, 26A2U, 26A3U, 26A4U, 26A5U, 26A6U, 26A14U, 26A26U, 40A1U, and 40A2U, as well as a reporter lacking any homonucleotide tract – NT (Figure 3A). Using 3′ RACE-seq we confirmed that the reporters acquire the pre-designed 3′ ends in vivo (Figures S3A and S3B). Remarkably, inclusion of even a single uridine after a poly(A) tail significantly reduced retrotransposition by up to ∼35% (Figure 3B). The reduction level increased gradually with each uridine included at the 3′ end of the reporters. The presence of 5–6 uridines reduced retrotransposition to ∼25% observed with the non-uridylated 26A reporter. Oligouridylated reporters lacking any poly(A) – 7U and 26U, essentially did not support retrotransposition.
Figure 3.

Uridylation of L1 mRNA Abolishes Retrotransposition
(A) Scheme of the L1 retrotransposition megfpI reporters used in this study. Immediately downstream of a reporter’s 3′ UTR, there is a defined sequence encoding a non-uridylated or differentially uridylated poly(A) (19A, 19A1U, 19A3U, 26A, 26A1U, 26A2U, 26A3U, 26A4U, 26A5U, 26A6U, 26A14U, 26A26U, 40A, 40A1U, 40A2U), 7U, 26U, or the sequence is missing (“no-tail”; NT), all followed by a sequence encoding a tRNA-like element.
(B) Retrotransposition frequency (black) and steady-state reporter mRNA levels (blue) with the reporters described in (A). For retrotransposition assays medians with interquartile ranges are shown (4 to 12 biological replicates). Blue boxes plus whiskers (Tukey’s) represent mRNA abundance (8 biological replicates) for the indicated reporters. Normalizations were done using the 26A reporter. One-way ANOVA and Tukey’s multiple comparison test were used to calculate statistics. All uridylated reporters support significantly (p < 0.001) lower levels of retrotransposition than their non-uridylated counterparts. Steady states: 19A versus 19A3U – ns, 26A versus 26A2U – ns, 26A versus 26A4U/6U/26U, 7U, 26U – p < 0.001.
(C) Scheme of the LEAP procedure with description.
(D) LEAP assays using plasmids carrying LINE-1 reporters ending with a defined sequence (26As or 26Us). The reporter used is indicated at the top, and the RT primer used in each LEAP reaction is indicated below (RT primer). Lanes 1 and 8, a DNA ladder (100 bp to 1,000 bp with 100-bp increments). The 100- and 500-bp bands are labeled. Negative controls (neg.cntrl) without RNPs were also included.
See also Figure S3.
Figure S3.

3′ RACE-Seq and LEAP Products Sequencing of the L1 Reporters with Defined 3′ Ends, Related to Figure 3
(A) Graphs showing distribution of total tails’ lengths in 3′ RACE-seq data of L1 reporters designed to possess at their 3′ ends either of: 26A, 26A2U, 26A4U, 26A6U or 26A14U. The respective reporters are color coded as indicated.
(B) Logos representing the 3′ RACE-seq data for the indicated reporters. Shown is the CGGC sequence common to all reporters and specific sequences. Probability of a given nucleotide and of the position occupancy in general is calculated in bits and depicted accordingly.
(C) Plasmids (24), whose inserts’ sequencing is shown in panel D, were cut with XbaI and XhoI Fast digest restriction enzymes, yielding fragments of expected length (approximately 130bp). Lanes from left to right correspond to clones 1-24 in the table in panel D. A molecular weight ladder was included, with the two fastest migrating bands corresponding to 100 and 200bp, respectively.
(D) Validation of genuine reverse transcription of uridylated L1 mRNAs by L1-ORF2p. LEAP products seen in Figure 3D lane 5 were cloned into pJET 1.2 blunt plasmid, and single bacterial colonies used for preparation of plasmids. Clones were sequenced and the results are summarized in the table. One clone (10) possessed a chimeric sequence comprising a short stretch of the L1 reporter plasmid-encoded sequence (in italics) followed by the genuine 3′ LEAP adaptor sequence. 3 clones had a heterogenous sequence cloned (2, 20 and 24), while clone 6 had the expected L1 3′end followed by a 0.7Kb long sequence of unknown origin.
A possible explanation for these results could be a reduction in the amounts of uridylated reporter L1 mRNAs. We addressed this question by measuring steady-state levels of a few selected reporters by RT-qPCR. The oligouridylated L1 reporters were observed at lower steady-state levels than their non-uridylated counterparts (Figure 3B). Nevertheless, the effects were insufficient to explain the observed reduction in retrotransposition. Importantly, we detected substantial amounts of the 26A26U, 7U, and 26U L1 reporter mRNAs (at ∼1/3 of the 26A reporter levels) despite their inability to support retrotransposition. This suggests that the effect of uridines on RNA levels was an important, but not the only, factor in restricting retrotransposition.
We then tested whether L1-ORF2p can reverse transcribe substrates ending with uridine residues. We used a modified version of the L1 element amplification protocol (LEAP) (Kulpa and Moran, 2006) with the 26A and 26U L1 reporters and 3′ adapters comprising 12Ts or 12As and a universal primer sequence to specifically prime RT of either adenylated or uridylated RNAs by L1-ORF2p. Finally, the cDNAs were amplified by PCR with reporter and 3′ adaptor-specific primers (Figure 3C). The expected amplification product of ∼100 bp was only observed with complementary adaptor-reporter pairs (Figure 3D, compare lanes 2 and 5 with lanes 3 and 4). To further ascertain genuine RT of the 26U reporters, we cloned and sequenced the 12A-primed LEAP products (lane 5 in Figure 3D). Notably, 20/24 clones had U-tails of a median length of 21.5U, including clones containing 26Us (Figures S3C and S3D).
We conclude that 3′ uridines abolish L1 retrotransposition, partially through lowering L1 mRNA availability, and that L1-ORF2p can specifically reverse transcribe uridylated L1 mRNAs.
Differential Effects of TUT4 and TUT7 on L1 mRNA Abundance, Stability, and Its Translation
The impact of TUT4, TUT7, and MOV10 on L1s’ oligouridylation and retrotransposition potential prompted us to test their effects on L1 mRNA steady-state levels and stability and on translation of L1 proteins.
Northern blotting of poly(A)-selected RNAs is the gold standard for detecting and quantifying full-length L1 mRNAs (Figure S4A). To account for our discovery of a substantial fraction of oligouridylated and 3′ truncated L1 mRNAs, we omitted the poly(A) selection in our Northern blot analyses and could readily detect abundant expression of full-length L1 reporter mRNAs (Figure 4A). Notably, we observed a ∼50% reduction in the amounts of L1 reporter mRNAs relative to control (MBP) in TUT4 WT and MOV10 overexpressing cells, which is in line with the drop in retrotransposition observed under these conditions (Figures 4A and 4B). Surprisingly, we observed increased amounts of L1 mRNAs in TUT7 WT overexpressing cells (Figures 4A and 4B), consistent with our idea that L1 mRNA availability is one, but not the key, determinant for L1 retrotransposition. Although the reason for increased levels of L1 mRNA in TUT7 overexpressing cells remains unclear, the differential effects of TUT4 and TUT7 on steady-state levels of L1 reporter mRNAs could possibly be explained by differential localization of those enzymes in the cell. In fact, we observed that in HEK293 cells TUT7 was a pan-cytoplasmic protein, but TUT4 and MOV10 were cytoplasmic and clearly co-enriched in cytoplasmic foci (Figures 4C and 4D). To note, L1-ORF1p co-localized with both TUT4 and MOV10 in the cytoplasmic foci (Figure S4B; Table S3), some of which could be P-bodies or stress granules (SG) as previously described (Doucet et al., 2010).
Figure S4.

Effects of TUT4/7 and MOV10 on L1 mRNA Steady-State Levels, Stability, and Translational Competence, Related to Figure 4
(A) Northern blotting to detect endogenous L1 mRNAs in HEK293 (FLP-IN T-Rex), HEK293T, PA-1 and HeLa-HA cells as indicated. Total RNA (lanes 1-4), unbound RNA fraction retrieved after selecting for poly(A) (SN, using PolyA Purist MAG from Ambion; lanes 5-8) and poly(A) RNA (lanes 10-13). The amount of RNA loaded is indicated (μg). The same blot was re-probed for GAPDH and stained with methylene blue prior to any probing, and results are shown below (i.e., loading controls). Substantial fraction of unbound L1 mRNAs likely represents oligouridylated or truncated mRNAs.
(B) Confocal microscopy pictures (maximal projections in z) showing mostly cytoplasmic localization of L1-ORF1p-FLAG (stained with rabbit anti-Flag monoclonal antibodies and secondary Alexa 488 coupled antibodies) and of endogenous TUT4 and MOV10 proteins.
(C) Rapid cell fractionation following the protocol described by Suzuki et al. (2010) and subsequent western blotting to assess subcellular localization of TUT7, TUT4, MOV10 in PA-1 cells. Blotting for cytoplasmic (γ-tubulin) and nuclear (histone H4) markers were also performed. W – whole cell, C – cytoplasmic compartment, N – nuclei. An asterisk denotes an unspecific band.
(D) Western blot analysis of proteins in PA-1 cells after siRNA-mediated depletion of TUT4 and TUT7 or MOV10, as indicated at the top of the panel. CNTRL denotes non-targeting siRNAs. A total of 30% (2x) and 5% of the control sample were loaded as indicated at the top, to assess depletion efficiency. Blots were probed with rabbit polyclonal antibodies as indicated on the left. GAPDH was used as a loading control. Superfluous lanes irrelevant to the study were removed (indicated with the black line).
(E) Western blot validation of overexpression (upper panel) and knock-down (lower panel) in HEK293 (FLP-IN T-Rex) cells used for RNA-seq experiments to analyze endogenous L1 mRNA steady-state levels. Cells (triplicates) were split for RNA isolation and western blots. Blots were probed with rabbit polyclonal antibodies for the detection of MOV10, TUT7, TUT4, GAPDH and actin. The latter two proteins were used as loading controls. Different volumes of lysates were loaded to help assess overexpression and depletion efficiencies. Samples and loading volumes are indicated.
(F) RNA-seq-based estimation of endogenous L1 expression in PA-1 cells transiently depleted of TUT4 and TUT7, MOV10 or all three proteins as indicated, using siRNAs (see panel D). Uniquely mapped reads for 76 Homo sapiens-specific L1s were calculated and normalized to respective controls as indicated. None of the observed changes is statistically significant.
(G–I) Estimation of endogenous L1-Ta mRNAs by RT-qPCR using probes as described in Coufal et al. (2009), in PA-1 (G), and HEK293 FLP-IN T-Rex stable cell lines (in which indicated proteins were overexpressed by addition of tetracycline, and normalized to cells without tetracycline; H) or in HEK293 FLP-In T-Rex cells depleted of the indicated protein/s (I). Three to six biological replicates including those used in the RNA-seq were analyzed.
(J) Plasmid JM101/L1.3-O1EGFP-O2mcherry contains a full-length L1 L1.3 (Sassaman et al., 1997) element producing L1-ORF1p-EGFP and L1-ORF2p-mCherry. Additionally, the plasmid contains the mneoI cassette (Moran et al., 1996) to monitor retrotransposition.
(K) A retrotransposition test with the JM101/L1.3-O1EGFP-O2mcherry and parental JM101/L1.3. Addition of both fluorescent proteins in L1 ORFs does not severely compromise its retrotransposition potential.
(L and M) HEK293T cells were co-transfected with JM101/L1.3-O1EGFP-O2mcherry and plasmids overexpressing the indicated TUTases or MOV10. The percentage of cells expressing L1-ORF1p-EGFP (L) and L1-ORF2p-mCherry (M) were estimated in the total cell populations using FC. Normalized values from 8 biological replicates (3 independent experiments) are shown. Statistical significances were calculated using one-way ANOVA and Tukey’s multiple comparison test (∗∗∗p < 0.001, ∗∗p < 0.01, comparison to MBP).
(N) Plasmids of the pZW-L1RP series containing a full-length L1 (L1RP, Kimberland et al., 1999) element in a modified pcDNA5 FRT/TO backbone producing L1-ORF1p and L1-ORF2p with either an epitope FLAG tag or fluorescent EGFP or mCherry tags as indicated. All but pZW-L1RP-O2G were produced without or with the megfpI L1 retrotransposition reporter cassette.
(O) Retrotransposition test with pZW-L1RP-O1F-megfpI and pZW-L1RP-O1mCh-megfpI reporters. The presence of either tag does not prevent L1 retrotransposition.
(P) Translation of L1-ORF1p-mCherry encoded in pZW-L1RP-O1mCh plasmid. Cells expressing mCherry over background levels (HEK293T cells transfected with control L1 plasmid not encoding any fluorescent tag) were considered. Median mCherry intensity was calculated and used as a measure of L1-ORF1p-mCherry translation.
(R) Translation of L1-ORF2p-EGFP encoded on the pZW-L1RP-O2G plasmid was estimated as in (P) except for EGFP. Six to nine biological replicates (2 or 3 independent experiments) were analyzed.
Statistical significances in (P) and (R) were calculated as in panel (L).
Data on panels G, H, I, L, M, O, P, and R are presented as medians with individual points and interquartile ranges shown.
The western blotting exposures were done either to a film and scanned by an Epson scanner and bottom scanning option (panels C and D) or by a CCD camera (panel E). The singnals in the images acuired with a CCD camera were digitally enhanced by using ‘adjust levels’ option for the entire images.
Figure 4.

Differential Effects of TUT4 and TUT7 on L1 mRNA Abundance, Stability, and Translatability
(A) Northern blot of full-length reporter L1 mRNAs, expressed from a plasmid encoding a full-length L1.3 lacking a reporter cassette (JM101/L1.3 no marker) under overexpression of MBP or N’MBP-tagged TUT4, TUT7, and MOV10 as indicated. GAPDH served as a loading control. Marks on the right indicate positions of the RNA reference ladder (in thousands of nucleotides) and the position of 28S and 18S rRNAs is indicated.
(B) Quantification of four northern blots like in (A) (four biological replicates, three independent experiments) normalized relative to the GAPDH signals and the MBP sample. One-way ANOVA and Tukey’s multiple comparison test were used to calculate statistical significance (∗p < 0.05; ∗∗∗p < 0.001).
(C) Confocal microscopy pictures (maximal projections in z) depicting HEK293 cells transfected with plasmids encoding EGFP-TUT4 (top-left panel) and mCherry-MOV10 (top right, merge on bottom-left panel) or EGFP-TUT7 (bottom right) to assess the subcellular localization of proteins. DNA was stained with Hoechst (cyan). Scale bars represent 10 or 20 μm as indicated.
(D) Quantitation of MOV10 containing foci in HEK293 cells that also contain TUT4 or TUT7 (based on co-transfection experiments and confocal microscopy like in C). For each condition (TUT4 vs. TUT7), 30 cells were analyzed. Statistical significance was calculated using a Wilcoxon signed-rank test (p < 0.0001).
(E) Decay of L1 reporter and endogenous MYC mRNAs normalized to GAPDH mRNA. Actinomycin D was added to cell aliquots for 1–6 hr to block transcription, followed by RNA retrieval and estimation of RNA levels by RT-qPCR using multiplexing and Taq-Man probes. Results of three (MYC) or four (L1) independent biological replicates (time-course assays) are shown (mean values).
(F and G) RNA-seq-based estimation of endogenous L1s expressed in HEK293 cells overexpressing TUT4, TUT7 (stable cell lines), or MOV10 (transient transfection) (F) or siRNA-depleted of these proteins (G). Uniquely mapped reads for 76 Homo sapiens-specific L1s (after Repbase) were calculated and normalized to respective controls as indicated. Statistical significances were calculated by DESeq2 for each respective condition pair using summarized counts of each L1 subfamily and are shown above each pair in (F). No significant changes could be observed in (G).
(H) Analytical flow cytometry of cell populations co-transfected with a pJM101/L1.3-O1EGFP-O2mCherry plasmid and plasmids overexpressing the indicated proteins. The pJM101/L1.3-O1EGFP-O2mCherry contains a full-length L1.3 element from which the fluorescent EGFP and mCherry cDNAs were cloned in-frame in the C terminus of L1-ORF1p and L1-ORF2p, respectively. Normalized EGFP and mCherry intensities for data from 8 biological replicates (3 independent experiments) are shown. Statistical significance was calculated like in (B).
(I) Western blot analysis of FLAG-tagged L1-ORF1p, translated from a full-length L1 without a reporter cassette (pZW-L1RP-O1F; Figure S4N). Co-transfected plasmids are indicated at the top of the panel. Membranes were probed with anti-FLAG, anti-GAPDH and anti-MBP antibodies to detect respectively: overexpressed L1-ORF1p-FLAG, GAPDH (loading control), and MBP-tagged proteins. Note that MBP migrates faster than any tagged protein, and it is beyond the blot and thus not detected.
Data in (B), (D), and (H) are medians with individual points and interquartile ranges shown. See also Figure S4 and Tables S3, S4, and S5.
We next determined the stability of L1 reporter mRNAs using actinomycin D treatment and multiplex Taq-Man RT-qPCR. In general, reporter L1 mRNAs are very stable species, exhibiting an overall stability comparable to GAPDH, and unlike MYC which decayed rapidly (Figure 4E). Consistent with the Northern blot data, we observed destabilization of L1 mRNAs when compared to GAPDH, in TUT4 WT-overexpressing cells, while TUT7 WT overexpression did not significantly destabilize L1 mRNAs. Surprisingly, in MOV10 overexpressing cells L1 mRNAs were as stable as GAPDH, suggesting that a fraction of L1 mRNAs is generally stable and insensitive to MOV10-induced RNA degradation (Figure 4E).
To complement these studies, we tested whether endogenous L1 mRNAs are influenced by TUT4, TUT7 and MOV10. We analyzed L1s from HEK293 cells overexpressing WT TUT4, TUT7, or MOV10 or depleted of these proteins and from PA-1 cells depleted for both TUT4 and TUT7 and TUTases plus MOV10 (Figures S4C–S4E) using RNA sequencing (RNA-seq). In line with the northern blot results, overexpression of TUT7, but not of MOV10 or TUT4, significantly increased expression of most of L1 subfamilies (Figure 4F; Table S4). Consistently, we did not observe statistically significant differences in L1 mRNA abundance in HEK293 and PA-1 cells following depletion of TUT4 and TUT7, MOV10, or both TUTases and MOV10 (Figures 4G and S4F; Table S5). In addition, we also conducted RT-qPCR to analyze changes in L1Hs-Ta mRNAs, but we did not observe statistically significant changes (Figures S4G–S4I). When combined, these results suggest that regulation of L1 retrotransposition is mostly achieved by qualitative, rather than quantitative, changes on its mRNAs.
Finally, we tested whether TUT4, TUT7, and MOV10 influence translation of the L1-encoded proteins. To do that, we constructed several plasmids encoding active L1s in which L1-ORF1p, L1-ORF2p, or both were fused to a fluorescent protein, or which encoded L1-ORF1p tagged with FLAG (Figures S4J, S4K, S4N, and S4O). We only detected a slight, but statistically significant reduction in L1-ORF1p expression (and less so in L1-ORF2p) in cells overexpressing MOV10 and, to a lesser extent, WT TUT7 and TUT4 (Figures 4H, 4I, S4L, S4M, S4P, and S4R).
Summarizing, L1 mRNAs are stable mRNAs. Their steady-state levels, stabilities, and translation are only moderately influenced by TUT4, TUT7, and MOV10. We speculate that the different effects of TUT4 and TUT7 on L1 mRNA levels and stability may be explained by differential subcellular localization of the TUTases, since only TUT4 is enriched in cytoplasmic foci.
TUTases Associate with MOV10
The apparent effect of MOV10 on L1 uridylation (Figure 2D) prompted us to investigate whether MOV10 might be functioning in the same pathway as TUTases. To this end, we first tested interaction partners of TUT4 and TUT7 by establishing HEK293 FLP-IN T-Rex cell lines stably expressing either TUT4 or TUT7 with an EGFP tag at their N termini (Figures S5A–S5G).
Figure S5.

Stable Cell Line Validation and Co-IP Experiments, Related to Figure 5
(A) Flow cytometry profiles of parental HEK293 FLP-IN T-Rex (black traces) and stable cell lines expressing EGFP-TUT4 or EGFP-TUT7 in the absence of (blue traces) or following induction of transgene expression with 100 ng/ml tetracycline (green traces). “EGFP+ GATE” denotes the region with cells showing higher EGFP fluorescence than ∼99.9% of the control cells that do not express EGFP. The histograms were obtained using Flowing software. The table below the histograms summarizes the percentage of EGFP+ cells within each experimental population.
(B) Western blot validation of the EGFP-TUT4-expressing stable cell line. Cells were grown for 48 h without tetracycline or with addition of 25, 50 or 100 ng/ml tetracycline in the medium. Proteins were separated by SDS-PAGE, followed by transfer to nitrocellulose membranes and Ponceau S staining (lower panel) to control for protein loading. The upper panel shows results after probing with a TUT4-specific rabbit polyclonal antibody.
(C) Western blot validation of the EGFP-TUT7-expressing stable cell line as in (B). Lanes 1 and 5 are reference lanes with material from the EGFP-TUT4 cell line and parental HEK293 FLP-IN T-Rex cells, respectively, to show antibody specificity. An asterisk denotes an unspecific band.
(D) HEK293 FLP-In T-Rex cells were fixed with formaldehyde and stained for endogenous TUT4 (upper panel) or TUT7 (lower panel) with rabbit polyclonal antibodies and Alexa 488-coupled secondary goat anti-rabbit antibodies. Nuclei were visualized by Hoechst DNA staining (cyan). Maximal projection images of z stacks are shown. White bars, 10 μm
(E) Single z-slides (epifluorescent – left, and bright field – right) of live cells from stable cell lines expressing either EGFP-TUT4 (upper panel) or EGFP-TUT7 (lower panel). White bars, 10 μm
(F and G) Rapid cell fractionation following the protocol described by Suzuki et al. (2010) and subsequent western blotting to independently assess subcellular localization of TUT7, TUT4, MOV10. Blotting for cytoplasmic (tubulins or GAPDH) and nuclear (fibrillarin, RRP6 nuclear exosome complex exoribonuclease) markers were also performed. Cells were either parental HEK293 FLP-IN T-Rex (F), or HeLa-HA used in L1 mneoI reporter assays (G). An asterisk denotes an unspecific band.
(H) Western blotting of proteins associated with either EGFP-MOV10 or EGFP showed are: blot for TUT7 probing (left), probing with monoclonal αEGFP antibody (middle; 1% co-IP), and polyclonal anti-TUT7 antibodies (right, 5% co-IP, blot before probing depicted on the left). Visible is TUT7 in EGFP-MOV10 co-IP and not in control EGFP co-IP. In TUT7-probed blot some cross-reactivity toward overrepresented EGFP-MOV10 but not EGFP can also be seen.
(I) Flow-chart of the workflow of the RNA co-IP with FLAG-TUT7.
(J) western blotting showing efficient depletion of MOV10 in HEK293T cells used for in vivo UV-crosslinking and co-IP with FLAG-TUT7. Shown are western blotting results after probing with polyclonal antibodies against MOV10 and GAPDH (loading control). Cells were transfected with: Lane 1 – control non-targeting siRNA then plasmids encoding L1 reporter and MBP-TUT7; lane 2 – MOV10 targeting siRNA then plasmids encoding L1 reporter and FLAG-TUT7; lane 3 – control non-targeting siRNA then plasmids encoding L1 reporter and FLAG-TUT7; lanes 4 and 5 – as in lane 3 but 0.5 and 0.2 of the material seen in lane 3 was loaded (control to compare with lane 2).
(K) SDS-PAGE and silver staining of proteins recovered in the MBP- and FLAG-TUT7 co-IP after in vivo UV-crosslinking. Visible are bands representing FLAG-TUT7 (lanes 2 and 3, indicated with an asterisk) and M2 antibody stripped off the beads (lanes 2-4). Loaded were ca. 10% recovered material (lanes 2, 4) and ∼6% recovered material (lane 3). Lane 1 – molecular weight ladder (170 and 55 kDa bands are indicated); lane 2 – IP with MBP-TUT7 (control); lane 3 – IP with FLAG-TUT7 from MOV10-depleted cells; lane 4 – IP with FLAG-TUT7 from control cells.
The western blotting exposures were done either to a film and scanned by an Epson scanner and either top or bottom scanning options (panels B and F respectively) or by a CCD camera (C, G, H, J panels). The signals in the C, G, H and J panels were digitally enhanced by using ‘adjust levels’ option for the entire images (but for the middle H panel).
To stabilize evasive interactions, we performed in vivo cross-linking of proteins with a bifunctional primary amine-reacting cross-linker: dithiobis(succinimidyl propionate) (DSP). Co-immunoprecipitation experiments (coIP) were carried out for cell lines expressing EGFP-TUT4, EGFP-TUT7, or EGFP (control) revealing MOV10 as the most specifically enriched protein with both TUT4 and TUT7 (Figures 5A and 5B; Table S6). In agreement with the differential subcellular distribution of TUTases, TUT4 associated stronger with MOV10 than TUT7 (Figures 4C, S5D, and S5E). In a reciprocal coIP with EGFP-MOV10 we detected TUT4 by LC-MS/MS and TUT7 by a western blot (Figures 5C and S5H; Table S7). Other specifically enriched proteins in MOV10 coIP experiments were IGF2BP2 (7 of 7 coIPs), UPF1 and FAM120A, to cite few examples. Thus, it is clear that MOV10 possesses a wider protein interactome than any of the TUTases. We next validated the interactions without DSP crosslinking and tested their RNA dependence and stability (Figure 5D). In the EGFP-MOV10 coIPs TUT4 was enriched ∼10-fold more than TUT7 (Figure 5D, right panel, lanes 9–13). Addition of RNase A significantly reduced the amounts of enriched TUTases in the coIPs. A similar effect was observed when increasing concentrations of salt were used to wash the IP (Figure 5D, lanes 11–13). A poly(A)-interacting PABPC1 also co-purified with EGFP-MOV10 and showed similar RNA dependence and RNase A sensitivity as TUTases (Figure 5D).
Figure 5.

RNA-Dependent Association of TUT4 and TUT7 with MOV10
(A) Mass spectrometry of coIPs with EGFP-TUT4 (6) and controls (6). Normalized mean intensity (semiquantitative measure of protein abundance) and specificity (quotient of mean intensity in EGFP-TUT4 coIP and in control coIP) are plotted. Only hits identified in at least 3 of 6 EGFP-TUT4 coIPs are shown.
(B) Mass spectrometry of coIPs with EGFP-TUT7 (7) depicted like in (A). Only hits identified in at least 4 of 7 EGFP-TUT7 coIPs are shown.
(C) Mass spectrometry of coIPs with EGFP-MOV10 (7) depicted like in (A). Only hits identified in at least 3 of 7 EGFP-MOV10 coIPs are shown.
(D) Flowchart of experiments used to study RNA-dependence and stability of the TUT4 and TUT7 interactions with MOV10 (left panel) and results of the respective experiment (right panel). CoIP was done with EGFP-MOV10 as bait. Lanes 1–4: input and coIP with lysates from control EGFP-expressing cells; lanes 5–13: coIP with lysates from EGFP-MOV10-expressing cells; lanes 5–8: input proteins; lanes 9–13: enriched proteins without (lanes 9 and 11–13) or with RNase A (lane 10), washed with increasing salt concentrations as indicated (lanes 11–13). Supernatants after incubation with (lane 14) or without (lane 15) RNase A. Blots were probed for MOV10, TUT4, TUT7, PABPC1, and GAPDH as indicated. Probing for GAPDH and control coIP was done to show the absence of non-specific interactions.
(E) TUT7 coIP with RNA after in vivo UV-crosslinking using monoclonal anti-FLAG antibodies and lysates from cells expressing reporter L1 RNAs and either FLAG-TUT7 or control MBP-TUT7. Enrichment fold was calculated by 2ˆΔΔCt method, dividing enriched L1 or GAPDH mRNAs in FLAG-TUT7 coIP by their amounts non-specifically enriched in MBP-TUT7 coIP.
(F) Result of RNA coIP after in vivo UV-crosslinking with FLAG-TUT7 from control cells (transfected with control non-targeting siRNA, CNTRL) or cells depleted of MOV10 (by siRNA), both transfected with plasmids encoding L1 reporter and FLAG-TUT7. L1 enrichment was calculated by 2ˆΔΔCt method of L1 mRNAs enriched in each condition and normalized to GAPDH recovered in each condition.
(E and F) Results of four independent biological experiments are shown. Statistical significance was calculated using a two-tailed Mann-Whitney test. Median values, with individual points and interquartile ranges are shown.
To test whether TUT7 interaction with L1 mRNA depends on MOV10, we performed an RNA coIP experiment employing UV RNA-protein cross-linking in vivo (Figures S5I–S5K). We observed superior enrichment (∼600-fold) of L1 mRNAs in FLAG-TUT7 coIPs as compared to GAPDH (∼60-fold) and normalized to control coIPs with MBP-TUT7 lacking FLAG (Figure 5E). Importantly, depletion of MOV10 reduced the amount of enriched L1 mRNA in FLAG-TUT7 coIPs by ∼30% (Figure 5F).
Overall, we show that TUT4, and to a lesser extent TUT7, associate with MOV10 in an RNA-dependent and salt-sensitive manner. Furthermore, we show that TUT7 specifically interacts with L1 mRNA and that this interaction is partially MOV10 dependent.
MOV10 Facilitates L1 Uridylation by Displacing L1-ORF1p
To clarify the potential direct role of MOV10 in uridylating L1 mRNAs, we performed biochemical in vitro reconstitution experiments. L1-ORF1p has nucleic acid chaperone activity toward its encoding mRNA (Callahan et al., 2012). We therefore hypothesized that L1-ORF1p could prevent uridylation of the 3′ end of L1 mRNA and that MOV10, known as a functional helicase (Gregersen et al., 2014) could counteract this effect. To test this hypothesis, we combined synthetic 32P-labeled RNA without or with MOV10 and without or with recombinant L1-ORF1p in increasing concentrations in a buffer containing ATP and UTP. Uridylation was initiated by the addition of TUT4 WT. L1-ORF1p indeed inhibited uridylation of RNA in a dose-dependent manner (Figures 6A, lanes 1–4, 6B, 6C, S6A, and S6B). In the presence of MOV10 and without L1-ORF1p, uridylation was also inhibited and the median lengths of oligouridine tails were shorter like in the control without MOV10 (Figure 6A, lanes 5–8, 6B, and 6C). Notably, with increasing L1-ORF1p concentrations, MOV10 counteracted the L1-ORF1p adverse effect on RNA uridylation (Figures 6A–6C). On the other hand, the two other helicase/RNPase proteins tested: human SUV3 (Pietras et al., 2018) and yeast PRP2 (Warkocki et al., 2009) did not show such effects (Figures 6A and 6B). To further strengthen our observations, we performed RNase I footprinting experiments. We reasoned that L1-ORF1p would protect RNA from degradation by RNase I, unless its binding was hindered by MOV10 or it was actively removed by MOV10. L1-ORF1p indeed tightly protected the entire RNA molecule (Figure S6C, lanes 4 and 5). Remarkably, when MOV10, in the presence of ATP, was allowed to bind RNA, it prevented protection of the RNA by L1-ORF1p (Figure S6C, compare lanes 4 and 5 to lanes 7 and 8). Furthermore, if ATP was omitted or if a catalytically inactive MOV10 mutant was used (K530A) (Gregersen et al., 2014), we observed RNA protection (Figures S6D and S6E), indicating that the helicase/ATPase activity of MOV10 is essential for removing L1-ORF1p form L1 RNA.
Figure 6.

MOV10 Facilitates Uridylation by Competing with L1-ORF1p
(A) RNA uridylation assay on a 5′ 32P-labeled synthetic RNA by recombinant TUT4 in the absence or presence of recombinant L1-ORF1p and the indicated helicase/RNPase (HsMOV10, ScPRP2 or HsSUV3). Lane IN – input RNA; lanes 1–4: uridylation in the absence (1) or presence of increasing concentrations of rL1-ORF1p (2–4); lanes 5–8: like in lanes 1–4 but in the presence of HsMOV10; lanes 9–12: like in lanes 1–4 but in the presence of ScPRP2; and lanes 13–16: like in lanes 1–4 but in the presence of HsSUV3. The ladder on the right of the panel indicates appended Us.
(B) RNA uridylation levels in the absence or the presence of the indicated helicase proteins were plotted as functions of rL1-ORF1p concentration. Medians of four independent replicates like in (A).
(C) Results of 5 independent RNA uridylation experiments like in (A) in the absence or presence of MOV10. Statistical significances were calculated using two-way ANOVA and Bonferroni multiple comparison test. Mean values with SD are shown.
See also Figure S6.
Figure S6.

MOV10 Prevents Binding of L1-ORF1p to L1-RNA, Related to Figure 6
(A) A 5′-FAM-labeled RNA was incubated with increasing amounts of recombinant L1-ORF1p in the presence of TUT7 WT purified from human cells and UTP (lanes 2-6). A reaction containing only the RNA (lane 1) was included as a control. Another reaction containing the RNA, UTP and WT TUT7 but no L1-ORF1p was also included (lane 2). On lanes 3-6, increasing amounts of recombinant L1-ORF1p were added (as indicated at the top), changing the molar ratio of L1-ORF1p to the RNA from 0 to 3-fold. Reactions were stopped, purified and separated by PAGE.
(B) Quantification of the RNA present in the reactions shown in panel (A). Note that the graph contains the results of three independent experiments. Measured values were corrected for background, assuming no elongation in the control samples. Medians, ranges and individual points are shown. Statistical significances were calculated using one-way ANOVA and Tukey’s multiple comparison test (∗∗∗p < 0.001, ∗∗p < 0.01).
(C) RNase I footprinting assay. An in vitro transcribed L1-3′UTR RNA was labeled randomly by the incorporation of α32P UTP and incubated alone (lane 2), or was incubated in the presence of Mg2+ATP (lanes 3-8), without (lanes 3 and 6) or with recombinant L1-ORF1p in the indicated molar ratio to RNA (lanes 4, 5 and 7, 8) or with MOV10 purified from human cells (lanes 6-8). Note that MOV10 was added prior to L1-ORF1p addition. Lanes 1 and 9, alkaline hydrolysis ladders used as RNA mobility makers. An arrow points to full length L1 RNA.
(D) RNase I footprinting assay as in panel C. The in vitro transcribed L1-3′UTR RNA (lane 1) was incubated in a buffer supplemented with Mg2+ and with ATP and increasing concentrations of L1-ORF1p (lanes 2-4); followed by incubation with MOV10 (lanes 5-7); or preceded by incubation with MOV10 (lanes 8-10); or preceded by incubation with MOV10 but without ATP (lanes 11-13). Finally, all the samples (excluding lane 1) were depleted of Mg2+, subjected to RNase I footprinting, purified and separated by denaturing PAGE. Visible is lack of L1-ORF1p displacement in lanes 12 and 13 as compared to lanes 9 and 10. Visible is effect of MOV10 addition after L1-ORF1p in lanes 6 and 7 that might suggest kinetic competition of MOV10 and L1-ORF1p in binding to RNA. The arrow points to full length L1 RNA.
(E) RNase I footprinting assay as in panel C but with either wild-type (lanes 2-4) or mutant (K530A) MOV10 (lanes 5-7). Visible is increased protection of the RNA in mutant MOV10 condition, which suggests less effective competition/removal of L1-ORF1p of the RNA by the mutant protein. The arrow points to full length L1 RNA.
In sum, we demonstrated the ability of MOV10 to counteract the chaperone effects of L1-ORF1p on L1 mRNAs, and thus likely to set the stage for TUT4/TUT7-mediated uridylation.
Discussion
We discovered a mechanism of L1 restriction acting at the level of L1 mRNA, that relies on MOV10 helicase/RNPase activity followed by the uridylation of 3′ ends of L1 mRNAs by TUTases. Poly(A) tracts were recently shown to be essential for L1 retrotransposition (Doucet et al., 2015). Nevertheless, the actual global quality of L1 mRNA 3′ ends in human cells had not been investigated, in part due to technical challenges. We demonstrated pervasive 3′ end uridylation of L1 mRNAs in human cells and mouse testes, comprising molecular niches where L1 are transcribed and thus post-transcriptional regulatory mechanisms are expected to operate. We propose that this abundant uridylation of L1 mRNAs provides a general, specific, and efficient way of restricting retrotransposition of active L1s.
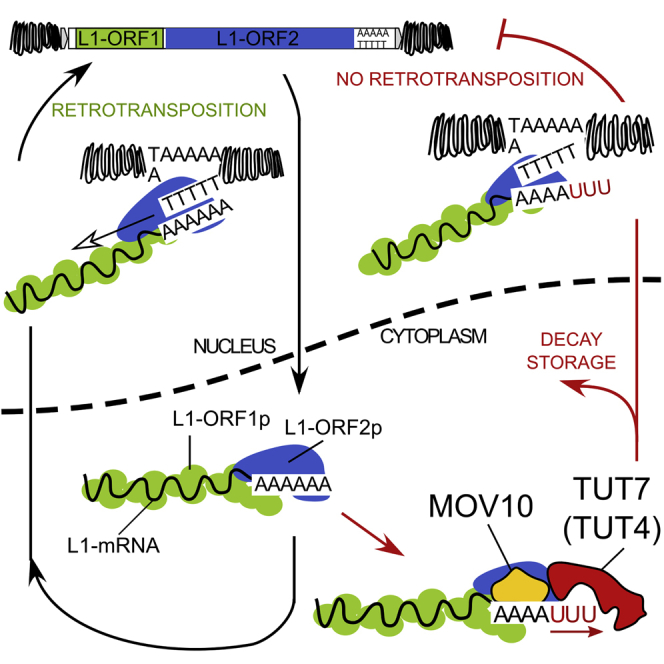
This study allowed us to propose a model of MOV10-TUT4/TUT7-driven restriction of retrotransposition in mammalian cells (Figure 7). Following transcription in the nucleus, L1 mRNA is exported to the cytoplasm where translation of the L1-encoded proteins occurs. L1 mRNAs face MOV10, which had been shown in several independent studies to be a potent restriction factor of retrotransposition (Arjan-Odedra et al., 2012, Choi et al., 2018, Goodier et al., 2012, Li et al., 2013, Lu et al., 2012, Skariah et al., 2017). Despite efficient production of L1-ORF1p, newly synthesized L1-ORF1p is likely in constant kinetic competition with MOV10 (Naufer et al., 2016). Direct binding of L1 mRNAs by MOV10 was previously demonstrated by cross-linking and immunoprecipitation (Gregersen et al., 2014), with the highest MOV10 occupancy just 5′ and within the L1 3′ UTR. Given its 5′→3′ directionality (Gregersen et al., 2014), MOV10 likely moves along the L1 3′ UTR toward the 3′ end of this RNA to prime its uridylation by TUT4/TUT7 (Figures 6 and S6). Although canonical uridylation of mRNA has been suggested to reduce their mRNA life time (Lim et al., 2014), in the case of L1 this effect seemed to depend on the subcellular localization of the uridylated L1 mRNA. Remarkably, canonically polyadenylated L1 reporter and endogenous L1 mRNAs were slightly stabilized by TUT7 WT, but not TUT4 WT (Figure 4), which likely might be explained by the differential localization of those enzymes in the cytoplasm with TUT4 enriched in cytoplasmic foci (Figure 4). Thus, here we showed that uridylation by TUT4 and TUT7 differentially affects the fate of the uridylated RNA. Nevertheless, L1 reporters with pre-defined uridylated 3′ ends were indeed less stable than their adenylated counterparts (Figure 3).
Figure 7.

Model of Restriction of L1 Retrotransposition by Uridylation
Uridylated endogenous L1 mRNAs could access the nucleus (Figure 2) where de novo L1 insertions are accumulated via TPRT (Jurka, 1997). During TPRT, the endonuclease activity of L1-ORF2p nicks dsDNA at a consensus sequence (5′TTTT/AA and variants), exposing a dT stretch that might promote base-pairing with the L1 poly(A) tail (Cost et al., 2002, Feng et al., 1996, Jurka, 1997). The recently proposed “snap-velcro” model for initiation of RT by human L1-ORF2p (Monot et al., 2013) suggests that RT initiation is dependent on the degree of complementarity between the 3′ end of the L1 mRNA and the exposed genomic DNA present at the site of L1-ORF2p endonuclease nicking. The most important residues for this process are the four 3′-most nucleotides (the “snap”). Thus, 3′ uridylated L1 mRNAs could not base-pair efficiently with the short exposed dT genomic sequence, and as a consequence any uridine present at the 3′ end of L1 mRNAs will greatly diminish its competency for RT initiation (Figure 3). While it is feasible that RT is initiated by L1-ORF2p within the poly(A) tract, irrespective of terminal 3′ uridines, the very weak retrotransposition potential of the 26A6U, 26A14U, and 26A26U L1 reporters (Figure 3) suggests that such internal priming must be highly inefficient.
In sum, our data suggest that uridylation is a major mechanism of retrotransposition control in mammals, as it can act in all cell types where L1s retrotranspose. Although this hypothesis requires further testing, recent discoveries that female mice with a conditional double-knockout of TUT4/TUT7 are infertile (Morgan et al., 2017) are an interesting coincidence because high levels of L1 transcription occur in the germline.
STAR★Methods
Key Resources Table
| REAGENT or RESOURCE | SOURCE | IDENTIFIER |
|---|---|---|
| Antibodies | ||
| Rabbit polyclonal anti-ZCCHC11 (TUT4) | Proteintech | 18980-1-AP; RRID: AB_10598327 |
| Rabbit polyclonal anti-ZCCHC6 (TUT7) | Sigma | HPA020620; RRID: AB_1858984 |
| Rabbit polyclonal anti-MOV10 | Abcam | Ab80613; RRID: AB_1603879 |
| Mouse monoclonal anti-hDCP1A | Santa Cruz Biotechnology | sc100706; RRID: AB_2090408 |
| Mouse monoclonal anti-FLAG | Sigma-Aldrich | F1804; RRID: AB_262044 |
| Rabbit monoclonal anti-FLAG | Sigma-Aldrich | F2555; RRID: AB_796202 |
| Rabbit polyclonal anti-GAPDH | Novus Biologicals | NB300-327; RRID: AB_10001915 |
| Mouse monoclonal anti-γ-tubulin | Sigma-Aldrich | T6557; RRID: AB_477584 |
| Rabbit monoclonal anti-Histone H4 | Merck | Cat. #05-858; RRID: AB_390138 |
| Mouse monoclonal anti-MBP | NEB | E8032S; RRID: AB_1559730 |
| Rabbit polyclonal anti-PABP | Abcam | Ab21060; RRID: AB_777008 |
| Chemicals, Peptides, and Recombinant Proteins | ||
| Phusion HF polymerase | Thermo Fisher Scientific | F530L |
| TRI Reagent | Sigma-Aldrich | T9424 |
| Lipofectamine 2000 | Thermo Fisher Scientific | 11668019 |
| Lipofectamine RNAiMAX | Thermo Fisher Scientific | 13778150 |
| CNBr-activated SepFast MAG 4HF beads | BioToolomics | 310202 |
| Anti-FLAG M2 affinity gel | Sigma-Aldrich | A2220 |
| Dynabeads Protein-G coupled | Thermo Fisher Scientific | 10004D |
| GFP-Trap | Chromotek | gtma100 |
| Amylose resin | NEB | E8021L |
| Agencourt AMPure XP magnetic beads | Beckman Coulter | A63880 |
| TURBO DNase | Ambion | AM2239 |
| T4 RNA ligase 2, truncated | NEB | M0242L |
| SuperScript III Reverse Transcriptase | Invitrogen | 18080-085 |
| Viscolase | A&A Biotechnology | 1010-100 |
| PerfectHyb Plus hybridization buffer | Sigma | H7033 |
| Critical Commercial Assays | ||
| Ribo-Zero Gold rRNA-removal kit H/R/M | Illumina | RZG1224 |
| KAPA Stranded RNA-seq Library Preparation Kit for Illumina platforms | KAPA Biosystems | KR0934 |
| Platinum SYBR Green qPCR SuperMix-UDG | Thermo Fisher Scientific | 11733046 |
| Clean-up RNA Concentrator Kit | A&A Biotechnology | 039-100C |
| TaqMan Fast Advanced Master Mix | Thermo Fisher Scientific | 4444556 |
| TaqMan Gene Expression Assay (GAPDH, VIC dye) | Thermo Fisher Scientific | 4448490 |
| TaqMan primers and probe with FAM dye (TAQMAN_EGFPI_2_PROBE) | Thermo Fisher Scientific | 4331348 |
| Actinomycin D | Roth | 8969.1 |
| Deposited Data | ||
| RNA-seq data | This paper | GEO: GSE105264 |
| 3′ RACE-seq data | This paper | http://adz.ibb.waw.pl/warkocki-et-al-2018 |
| The scripts used to analyze the RACE-seq data | This paper | https://github.com/smaegol/LINE_1_RACE_seq_analysis |
| Data used for Figure production and maps of the created plasmids | This paper | http://dx.doi.org/10.17632/zkb2nr99rw.1 |
| Experimental Models: Cell Lines | ||
| HEK293 FLP–In T–Rex EGFP–TUT4 | ADZ Lab; This paper | N/A |
| HEK293 FLP–In T–Rex EGFP–TUT7 | ADZ Lab; This paper | N/A |
| HEK293 FLP–In T–Rex EGFP–MOV10 | ADZ Lab; This paper | N/A |
| HEK293 FLP–In T–Rex parental | Invitrogen | R78007 |
| HEK293T | Invitrogen | N/A |
| Human foreskin fibroblasts (HFFs). | Jose L. Garcia-Perez Lab; cells originally purchased from ATCC; This paper | N/A |
| Human embryonic carcinoma PA-1 | Jose L. Garcia-Perez Lab; cells originally purchased from ATCC; This paper | N/A |
| Human embryonic stem cells H9 | Jose L. Garcia-Perez Lab; cells originally purchased from Wicell; This paper | N/A |
| Neuron progenitor cells (NPCs differentiated from H9-hESCs) | Jose L. Garcia-Perez; We differentiated hESCs to NPCs using a previously validated protocol (Macia et al., 2017); This paper | N/A |
| FreeStyle 293-F cells | Invitrogen | R79007 |
| Experimental Models: Organisms/Strains | ||
| C57BL/6/Tar mice | Animal facility University of Warsaw | N/A |
| Oligonucleotides | ||
| RA3_15N (3′ adaptor) /5rApp/CTGACNNNNNNNN NNNNNNNTGGAATTCTCGGGTGCCAAGG/3ddC/ |
Integrated DNA Technologies; This paper | 67719860 |
| Spike-in_0 (without poly(A); fixed index = 19) AAT GATACGGCGACCACCGAGATCTACACGTTCA GAGTTCTACAGTCCGACGATCNNNNNNNNNN NNNNNNNNNNNNNCTGACGAGCTACTGTTG GAATTCTCGGGTGCCAAGGAACTCCAGTCAC GTGAAAATCTCGTATGCCGTCTTCTGCTTG |
Integrated DNA Technologies; This paper | 70242976 |
| Spike-in_8 (fixed index = 20) AATGATACG GCGACCACCGAGATCTACACGTTCA GAGTTCTACAGTCCGACGATCNNNNNN NNNNNNNNBAAAAAAAACTGACGAGC TACTGTTGGAATTCTCGGGTGCCAAGGAA CTCCAGTCACGTGGCCATCTCGTATGC CGTCTTCTGCTTG |
Integrated DNA Technologies; This paper | 70242977 |
| Spike-in_16 (fixed index = 21) AATGATA CGGCGACCACCGAGATCTACACGTTCA GAGTTCTACAGTCCGACGATCNNNNN NNNNNNNNNBAAAAAAAAAAAAAAAA CTGACGAGCTACTGTTGGAATTCTCGG GTGCCAAGGAACTCCAGTCACGTTTCGATC TCGTATGCCGTCTTCTGCTTG |
Integrated DNA Technologies; This paper | 70242978 |
| Spike-in_32 (fixed index = 22) AATGATACGGCGA CCACCGAGATCTACACGTTCAGAGTTCTACAGTC CGACGATCNNNNNNNNNNNNNNBAAAAAAAAAAA AAAAAAAAAAAAAAAAAAAAACTGACGAGCTACTG TTGGAATTCTCGGGTGCCAAGGAACTCCAGTCAC CGTACGATCTCGTATGCCGTCTTCTGCTTG |
Integrated DNA Technologies; This paper | 70242979 |
| Spike-in_64-5 (for splint ligation with the 3′ part) AATGATACGGCGACCACCGAGATCTACACGTTC AGAGTTCTACAGTCCGACGATCNNNNNNNNNN NNNNBAAAAAAAAAAAAAAAAAAAAAAAAAAAAA AAAAAAAAAAAAAAAAAAAAAAAAAAAAAAAAAAAC |
Integrated DNA Technologies; This paper | 70242980 |
| Spike-in_64-3-P (for splint ligation with the 5′ part; fixed index = 23) /5Phos/TGACGAGCTACTGTTGGA ATTCTCGGGTGCCAAGGAACTCCAGTCAC GAGTGGATCTCGTATGCCGTCTTCTGCTTG |
Integrated DNA Technologies; This paper | 70242981 |
| Spike-in splint (for splint ligation) TCCAACAG TAGCTCGTCAGTTTTTTTTTTTTTTTTT |
Integrated DNA Technologies; This paper | N/A |
| RNA44 CGACUGGAGCACGAGGACACUGACAUG GACUGAAGGAGUAGAAA |
Future Synthesis; This paper | N/A |
| Stealth RNAi siRNA Negative Control Hi GC | Invitrogen | 12935400 |
| siRNA; for detailed information on all other siRNAs used see Table S1 | Invitrogen | 10620318/ 10620319 |
| For detailed information on all other oligonucleotides used see Table S1 | N/A | N/A |
| Recombinant DNA | ||
| 99 PUR RPS EGFP; a wild-type LINE-1 RP retrotransposition megfpI reporter | John Goodier; Goodier et al., 2012 | N/A |
| 99 PUR JM111 EGFP; a retrotransposition incompetent (due to L1-ORF1p mutations) LINE-1 RP retrotransposition megfpI reporter | John Goodier; Goodier et al., 2012 | N/A |
| JM101/L1.3 nomarker; a LINE-1 L1.3 element under CMV promoter without a reporter sequence | Jose L. Garcia Perez Lab; Wei et al., 2001; This paper | N/A |
| JM101/L1.3–O1EGFP–O2cherry (EGFP–tagged L1–ORF1p, mCherry–tagged L1–ORF2p, on a full–length L1.3 element containing the mneoI retrotransposition indicator cassette) | Jose L. Garcia Perez Lab; This paper | N/A |
| pZW-L1RP-O1F (FLAG-tagged L1-ORF1p on a full-length L1RP element) | ADZ Lab; This paper | Mendeley data https://doi.org/10.17632/zkb2nr99rw.1 |
| pZW–L1RP–O1F–megfpI (FLAG-tagged L1–ORF1p on a full-length L1RP element tagged with the megfpI retrotransposition indicator cassette) | ADZ Lab; This paper | Mendeley data https://doi.org/10.17632/zkb2nr99rw.1 |
| pZW–L1RP-O1mCh (mCherry-tagged L1-ORF1p on a full-length L1RP element) | ADZ Lab; This paper | Mendeley data https://doi.org/10.17632/zkb2nr99rw.1 |
| pZW–L1RP-O1mCh-megfpI (mCherry-tagged L1-ORF1p on a full-length L1RP element tagged with the megfpI retrotransposition indicator cassette) | ADZ Lab; This paper | Mendeley data https://doi.org/10.17632/zkb2nr99rw.1 |
| pZW–L1RP–O2G (EGFP-tagged L1–ORF2p on a full-length L1RP element) | ADZ Lab; This paper | Mendeley data https://doi.org/10.17632/zkb2nr99rw.1 |
| pZW–L1RP–megfpI (Active full-length L1RP element tagged with the megfpI, containing a CMV promoter upstream of L1RP, giving high retrotransposition rates without a need for antibiotic selection) | ADZ Lab; This paper | Mendeley data https://doi.org/10.17632/zkb2nr99rw.1 |
| pZW–L1RP–megfpI–TRL (“blunt ended” L1RP megfpI reporter due to excision of the tRNA-like element, see below for details) | ADZ Lab; This paper | Mendeley data https://doi.org/10.17632/zkb2nr99rw.1 |
| pZW–L1RP–megfpI–xyz–TRL (megfpI tagged L1RP where xyz specifies the 3′ tail, for example 26A or 19A3U see methods for details) | ADZ Lab; This paper | Mendeley data https://doi.org/10.17632/zkb2nr99rw.1 |
| pZW plasmids for generation of stable cell lines and transient overexpression of TUT4, TUT7, MOV10, TENT4B, TENT2 proteins with N-terminal EGFP, mCherry, MBP or FLAG tags | ADZ Lab; This paper | Mendeley data https://doi.org/10.17632/zkb2nr99rw.1 |
| Plasmid for overexpression of TUT1-FLAG | ADZ Lab; Mroczek and Dziembowski, 2013 | Mendeley data https://doi.org/10.17632/zkb2nr99rw.1 |
| Plasmid for overexpression of TENT5C-FLAG | ADZ Lab; Mroczek et al., 2017 | Mendeley data https://doi.org/10.17632/zkb2nr99rw.1 |
| Software and Algorithms | ||
| Prism 5 for Windows | GraphPad Software | https://www.graphpad.com/scientific-software/prism/ |
| Attune NxT flow cytometry software provided with the Attune NxT instrument | Thermo Fisher Scientific | N/A |
| MultiGauge 5.1 | Fuji Film (discontinued) | N/A |
| ImageJ | Schneider et al., 2012 | https://imagej.nih.gov/ij/ |
| SnapGene 3.3.4 | GSL Biotech LLC | http://www.snapgene.com/ |
| MaxQuant 1.3.0.5. | Max Planck Institute for Biochemistry; Cox and Mann 2008 | http://www.coxdocs.org/doku.php?id=maxquant:common:download_and_installation#download_and_installation_guide |
| Flowing Software | Perttu Terho | http://flowingsoftware.btk.fi/ |
| Tailseeker3 | Chang et al., 2014 | https://github.com/hyeshik/tailseeker |
| TEToolkit | Jin et al., 2015 | https://github.com/mhammell-laboratory/tetoolkit |
| STAR | Dobin et al., 2013 | https://github.com/alexdobin/STAR |
| Bowtie2 | Langmead and Salzberg, 2012 | http://bowtie-bio.sourceforge.net/bowtie2/index.shtml |
| Repeatmasker | Smit, AFA, Hubley, R & Green | http://www.repeatmasker.org/ |
| Sabre | N/A | https://github.com/najoshi/sabre |
| RACE-seq analysis scripts | This paper | https://github.com/smaegol/LINE_1_RACE_seq_analysis |
Contact for Reagent and Resource Sharing
Further information and requests for reagents should be directed to the Lead Contact, Andrzej Dziembowski (andrzejd@ibb.waw.pl).
Experimental Model and Subject Details
We use standard procedures to derivate and cultivate all cell types used in this study (see below for a detailed description of these methods). Absence of Mycoplasma spp. was confirmed at least once a month and STR-genotyping was used to control the identity of the cell lines (Lorgen, Spain).
HEK293 FLP-IN T-Rex and HEK293T cells
HEK293 cells were derived from a female. HEK293 FLP-In T-Rex cells were purchased from Invitrogen. The cells were cultured in monolayers in Dulbecco’s modified Eagle’s medium (DMEM, GIBCO) supplemented with 10% fetal bovine serum (FBS w/o tetracycline, GIBCO) at 37°C in a 5% CO2 incubator.
HeLa-HA and PA-1 cells
HeLa-HA (Hulme et al., 2007) and human embryonic carcinoma PA-1 (Thomson et al., 1998) were derived from females.
The cells were cultured in monolayers in minimal essential medium (MEM, GIBCO) supplemented with L-glutamine and 10% heat-inactivated fetal bovine serum (FBS, GIBCO) at 37°C in a 5% CO2 incubator.
Human foreskin fibroblasts
Human foreskin fibroblasts (HFFs, passage 3-10, from ATCC) were only used to generate Conditioned Media (CM). HFFs were grown following the provider’s instructions in Iscove’s Modified Dulbecco’s Medium (IMDM) supplemented with 25 mM HEPES, 2 mM L-glutamine and 10% heat-inactivated FBS.
H9-human embryonic stem cells
WA09/H9 human embryonic stem cells (hESCs) are female cells. The cell line was obtained from Wicell and was maintained in HFF-conditioned media (HFF-CM) using Matrigel-coated plates as described (Garcia-Perez et al., 2007, Macia et al., 2017). To prepare HFF-CM, HFFs were inactivated by γ-irradiation with 3000-3200 rads, seeded in T225 flasks (3x10⁶ cells/flask) and cultured in hESC media for 24h (DMEM KnockOut supplemented with 4 ng/ml β-FGF, 20% Knockout serum replacement, 1 mM L-Glutamine, 0.1 mM β-mercaptoethanol and 0.1 mM non-essential amino acids). HFF-CM was collected and frozen until used, and we harvested HFF-CM during seven consecutive days. HESCs were passaged manually using a cell-scraper as described (Garcia-Perez et al., 2007, Macia et al., 2017).
HESC-NPCs were cultured in KnockOut DMEM/F-12 with Stem Pro Neural Supplement, 1 mM L-Glutamine and Penicillin-Streptomycin (10,000 U/mL). All the cell lines were grown in a humidified 7% CO2 incubator at 37°C.
HESC-derived Neuronal Progenitor Cells
To differentiate hESCs to neuronal progenitor cells (NPCs), H9-hESCs were initially cultured for 2 days in N2 media (DMEM/F12 + N2 supplement (Invitrogen)) containing 10 μm SB-431542 (Sigma) and 1 μm dorsomorphin (Calbiochem). After 2 days, hESCs were collected from plates using a cell-scraper. To generate embryoid bodies (EBs), hESCs were seeded in low-attachment plates using N2 media containing 10 μm SB-431542 (Sigma) and 1 μm dorsomorphin (Calbiochem). EBs were cultured for 4-6 days, with daily changes of media. Next, EBs were plated in Matrigel-coated plates (60-mm plates) and cultured during 5-7 days on NB medium (0.5x N2, Invitrogen; 0.5x B-27, Invitrogen; 20 ng/ml FGF-2, Miltenyi Biotec and 1% penicillin-streptomycin), replacing media every other day. After 5-7 days, neuronal rosettes were manually collected, dissociated and plated on poly-L-ornithine (Sigma)/laminin (Invitrogen) coated plates using NB medium. Upon reaching confluence, NPCs were detached from plates using StemPro Accutase Cell Dissociation Reagent (Invitrogen), passaging in a 1:3 ratio. NPCs were grown for < 10 passages.
Mouse testes
Testes were isolated from 4 P10 young wild-type C57BL/6/Tar mice. The mice were maintained according to national regulations http://www.dziennikustaw.gov.pl/du/2015/266/D2015000026601.pdf. Prior to the experiment, the animals were kept in the laboratory animal facility with free access to food and water with a 12 h light/dark cycle.
Method Details
Cloning
Plasmids for TUT4/7, MOV10 and other TENTs overexpression
The pcDNA5 FRT/TO-derived plasmids used in this study were generally named using pZW as a prefix with respective tag and protein names specified. Generation of pZW-EGFP-ZCCHC6, pZW-EGFP-ZCCHC11, pZW-EGFP-ZCCHC6_D1060A, pZW-EGFP-ZCCHC11_D1011A plasmids for establishing stable cell lines expressing N-terminally EGFP-tagged TUT4 (ZCCHC11) or TUT7 (ZCCHC6) or their catalytically inactive mutant versions was described in Łabno et al. (2016b). For the sake of this study following plasmids were prepared: pZW-EGFP-MOV10, pZW-EGFP-MOV10_K530A, pZW-EGFP-MOV10_D645N, pZW-FLAG-TUT7, pZW-FLAG-TUT7_D1060A, pZW-MBP-TUT4, pZW-MBP-TUT4_D1011A, pZW-MBP-TUT7, pZW-MBP-TUT7_D1060A, pZW-mCherry-MOV10, pZW-mCherry-TUT4, pZW-mCherry-TUT4_D1011A, pZW-mCherry-TUT7, pZW-mCherry-TUT7_D1060A. Other plasmids used in the study were plasmids for overexpression of C-terminally FLAG-tagged TUT1, TENT4B, TENT2, TENT5C. All plasmids were generated using Sequence and Ligation-Independent Cloning procedures (SLIC) (Li and Elledge, 2012) and methods described in details in Szczesny et al., 2018. Briefly, the respective cDNA inserts were generated by standard PCR using custom DNA oligonucleotides (as specified in the Table S1) comprising a common pcDNA5 FRT/TO sequence for homologous recombination in bacteria including either AgeI or NheI restrictase restriction sites and a cDNA specific sequence. Phusion HF polymerase and cycling conditions depending on the insert size to be amplified (assuming ∼30sec for 1kb) were used. For generating site-specific mutations in TUT4, TUT7 and MOV10 genes splint PCR was used i.e., first two fragments were amplified with outer primers and internal primers comprising the desired nucleotide change. Thereafter, gel-purified fragments were mixed in 1-to-1 molar ratio and used as a template for PCR with outer primers only to generate full-length insert with a desired nucleotide change (see Table S1). The amplified DNA fragments were separated from primers and non-specific amplification products by agarose gel electrophoresis, correct DNA bands were excised and DNA purified using ‘gel out’ kit (A&A Biotechnology). 50ng – 150ng purified insert were mixed with 100ng AgeI and NheI digested pcDNA5 FRT/TO derivative (Szczesny et al., 2018) in 1X buffer G with 0.1 mg/ml BSA (Thermo Scientific) in the presence of 0.6U T4 DNA polymerase (NEB) in 10 μL and incubated at room temperature for 2 min. Then dATP was added to 1 mM and reactions incubated at 37°C for 2 min, followed by incubation in ice and addtion to a MH1 bacterial chemicompetent cells’ aliquot for a standard heat-shock transformation procedure. The cells were spread onto 100 ng/ml amplicilin-containing agar plates. Single colonies were used to isolate plasmids, followed by restriction analysis and sequencing. All parental plasmids (w/o inserts) were made available through the Addgene repository (https://www.addgene.org/Andrzej_Dziembowski/).
3′ homonucleotide tracts in L1 megfpI reporters
An L1RP element lacking its 5 ‘UTR and containing the megfpI retrotransposition indicator cassette was recloned as an entire fragment from plasmid 99 PUR RPS EGFP (Ostertag et al., 2000) into plasmid pZW-HSVTKpA (comprising the universal Multi Cloning Site of pKK (see Szczesny et al. [2018]), a puromycin resistance gene (PAC) instead of the original hygromycin gene, and a HSV polyadenylation site instead of the original bGH polyadenylation site) by PCR amplification using the forward primer ORF1f2 (see Table S1) and reverse primer LINE-1rep_NheI and Sequence and Ligation Independent Cloning (SLIC) into AgeI and NheI sites to yield the pZW-L1RP-megfpI-HSVTKpA plasmid. This plasmid was then cleaved with SrfI (New England Biolabs) and NotI FD (Thermo Fisher Scientific) restriction enzymes, followed by dephosphorylation with FastAP (Thermo Fisher Scientific).
Synthetic long DNA comprising part of the SrfI site, the desired 3′ L1 end sequence, a sequence encoding a full tRNA-like element cleavable at its 5′ end by endogenous RNase P (see Doucet et al. [2015]) and part of the NotI site were ordered from IDT: xyz_for (GGGC(xyz)GACGCTGGTGGCTGGCACTCCTGGTTTCCAGGACGGGGTTCAAGTCCCTGCGGTGTCTGC) xyz_rev (GGCCGCAGACACCGCAGGGACTTGAACCCCGTCCTGGAAACCAGGAGTGCCAGCCACCAGCGTC(zyx)GCCC); where (xyz) in the forward primer specifies either of: 19A, 19A1U, 19A3U, 26A, 26A1U, 26A2U, 26A3U, 26A4U, 26A5U, 26A6U, 26A14U, 26A26U, 40A, 40A1U, 40A2U, 7U, 26U and where (zyx) in the reverse primer specifies a complementary sequence. In case of the “no tail” reporter there was no additional sequence in the place of (xyz) and (zyx) in the respective forward and reverse primers.
The primers were either ordered with a 5′ phosphate or phosphorylated using PNK (NEB) and annealed after pooling the respective pairs in PNK reaction buffers at a 1:1 ratio (10 pmol each; 20 μL total volume) and addition of water to a volume of 100 μL followed by heating to 95°C for 10 min (simultaneous enzyme deactivation), 75°C for 2 min, 55°C for 2 min and cooling to RT.
Following this step, the annealed oligonucleotides were combined with the SrfI/NotI- cleaved dephosphorylated plasmid and ligated for 1h at 22°C using T4 DNA ligase (NEB).
The resulting plasmids were named pZW-L1RP-megfpI-xyz-TRL, where xyz indicates the precise end of each L1 mRNA, and are listed in the Key Resources Table.
Plasmids were produced from 100 mL MH1 E. coli cultures using a Plasmid Midi kit (A&A Biotechnology), sequenced and validated.
Tagging L1-ORF1p with FLAG
Two DNA fragments were amplified using the 99 PUR RPS EGFP plasmid as a template. The 5′ fragment encompassed the L1-ORF1p CDS without the 5′ UTR and a sequence encoding the FLAG tag attached directly to L1-ORF1 lacking the stop codon, which was moved to the end of the FLAG tag. The 3′ fragment encompassed the FLAG-stop codon-linker-L1-ORF2 CDS with or without the megfpI reporter cassette. The 5′ fragment primers were (see Table S1): forward primer ORF1f2,reverse primer SOPO1Fr1. The 3′ fragment primers: forward primer SOPO1Ff2, reverse primer for L1 w/o reporter SOPO21r2 and reverse primer for L1 with megfpI reporter SOPO21r3. The 5′ and 3′ fragments were combined in ∼1:1 molar ratios and used in a splice PCR with the 5′ and 3′ outer primers. Finally, the purified splice PCR product was inserted into the HindIII and XhoI sites of pKK-NoTag (Szczesny et al., 2018) by SLIC. The plasmids pZW-L1-O1F and pZW-L1-O1F-megfpI were prepared from 100 mL bacterial cultures, the inserts were sequenced and retrotranspositional competence was validated.
Tagging L1-ORF1p with mCherry
Tagging was accomplished as described above for pZW-L1RP-O1F, but the mCherry reference sequence and L1-ORF1p CDS were first amplified and used in splice PCR to create a joint L1-ORF1-mCherry 5′ fragment. This fragment was then combined with either of the 3′ fragments (i.e., lacking or carrying the megfpI reporter cassette sequence) and used in splice PCR. The insert was cloned between the HindIII and XhoI sites of the pZW-HSVTKpA plasmid. Primers used to produce the mCherry fragment were (see Table S1): ORF1_mCherry_for (forward) and ORF1_mCherry_rev (reverse). Additionally, for L1-ORF1 CDS amplification, the L1-ORF1 reverse primer ORF1_mChtag_rev was used instead of SOPO1Fr1. For Linker-ORF2 CDS amplification (both without and with megfpI), the forward primer L1_linker_for was used instead of SOPO1Ff2.
Plasmids pZW-L1RP-O1mCh and pZW-L1-O1mCh-megfpI were prepared from 100 mL bacterial cultures, the inserts were sequenced and we next demonstrated that these constructs retain their retrotransposition potential in cultured cells.
Tagging L1-ORF2p with EGFP
Tagging was accomplished by recloning LINE-1 RPS from the 99 PUR RPS EGFP plasmid into pKK-TEV-mEGFP linearized with BstHI (AgeI) and NheI restriction enzymes using described protocols (Szczesny et al., 2018).
Primers used to PCR amplify a single insert encompassing the LINE-1 RPS (without the 5′ UTR and the megfpI retrotransposition indicator cassette) were: L1Orf1f (forward; see Table S1) and L1r-Stp (reverse).The obtained plasmid pZW-L1RP-O2-G was prepared from 100 mL bacterial culture, and the insert was then sequenced and validated.
Tagging both L1 ORFs with EGFP and mCherry
To generate plasmid JM101/L1.3-O1EGFP-O2cherry, we used a cloning strategy very similar to the one described above (available upon request). The final construct was fully sequenced. The vector includes an mneoI retrotransposition indicator cassette, which allowed us to demonstrate that tagging both L1-encoded proteins with fluorescent proteins does not significantly affect retrotransposition efficiency in cultured cells.
Stable cell lines – generation and validation
Related to Figures 5 and S5. Stable cell lines were generated using human HEK293 FLP-In T-Rex cells (Invitrogen) and the FLP-In T-Rex system (Invitrogen). The cells were seeded in 6-well plates (Greiner) at 0.5x10⁶ cells per well. On the following day (∼20h post seeding), the medium was replaced and cells in a single well were transfected with 0.2 μg pOG44 plasmid and 1.8 μg pZW plasmid encoding either of the N-terminally EGFP-tagged human TUT4, TUT7, MOV10 or TUT4/7 mutant versions encoding catalytically inactive proteins using 5 μL Lipofectamine 2000 (ThermoFisher Scientific). At ∼24h post-transfection the cells were trypsinized and seeded onto 60-mm dishes (Greiner) in medium supplemented with 50 μg/ml hygromycin (Invitrogen). Cells were selected for 12-18 days and the medium was exchanged every 2-3 days. No further clonal selection was performed.
Tetracycline-inducible expression of EGFP was tested using titration of tetracycline from 25 to 100 ng/ml in 6-well plates. The cells were harvested and lysed, with the lysates used for western blotting (see below) with anti-EGFP and anti-ZCCHC11, ZCCHC6 or MOV10 antibodies. The cells were also analyzed by flow cytometry. Prior to analysis, the cells were detached from the plates by trypsinization, followed by addition of media and centrifugation at 350 rcf. for 3 min. The medium was removed and the cells were suspended in 1 mL PBS. EGFP signals were measured using a FACScalibur instrument (BD Biosciences) and the data were analyzed using Flowing software (http://flowingsoftware.btk.fi/) or Cyflogic software (CyFlo, Ltd.).
Maximal expression of the EGFP-tagged proteins was observed with ≥ 25 ng/ml tetracycline.
Cell compartment fractionation
Related to Figures S4C, S5F, and S5G. Cells (HEK293, HeLa and PA-1) were fractionated into cytoplasmic and nuclear compartments using the REAP fractionation method described by Suzuki et al., 2010.
Related to Figure 2I. To separate cytoplasmic and nuclear RNA, we used 200 μL 1x PBS, 0.1% Igepal CA-630, 5 mM EDTA to extract cytoplasmic RNA, after which the nuclei were pelleted by 10 s centrifugation at 5000 rcf. and 200 μL of the cytoplasmic fraction (supernanant) taken for RNA isolation. Nuclear pellet was resuspended and washed and pelleted twice with additional 200 μL of the buffer. The nuclei were then pelleted and resuspended once again in the buffer. The 200 μL fractions were used for RNA extraction with 1 mL TRI-reagent (Sigma) according to the manufacturer’s recommendations.
Western blotting
Cells from a single well of a 6-well plate were detached with PBS (HEK293) or trypsinized (HeLa, PA-1) and pelleted by centrifugation at 350 rcf. for 3 min. Cells were lysed by pipetting the entire pellet 10-20 times in 30 μL 0.5x PBS/0.15% NP40 supplemented with protease inhibitors as well as viscolase, a DNA and RNA nuclease (A&A Biotechnology), added to 0.1 U/μl. The mixtures were incubated at 37°C for 15 min with occasional shaking to allow digestion of nucleic acids before 20 μL 3x SDS-PAGE loading buffer with 30 mM DTT was added. The mixture was then boiled and loaded onto 10% SDS-PAGE gels.
After SDS-PAGE, the proteins were transferred to Protran nitrocellulose membranes (GE Healthcare) by wet transfer at 40 V 300 mA for 2h at 4°C in 1x transfer buffer (25 mM Tris-HCl, pH 7.5, 192 mM glycine, 0.1% SDS, 20% methanol).
Membranes were stained with 0.3% w/v ponceau S in 3% v/v acetic acid, and the staining pattern was digitized. The ponceau S stain was removed and membranes were incubated with 4% w/v skim milk in TBST20 buffer followed by incubation with specific primary antibodies (see Key Resources Table) diluted 1:1,000 (TUTases, FLAG) or 1:2,500 (MOV10, GAPDH, tubulins, EGFP, PABP) at 10°C for 14-20 h. Membranes were washed 3 times for 20 min each in TBST20, and then incubated with HRP-coupled secondary antibodies (anti-rabbit or anti-mouse; Jackson Bioscience) at 1:5000 to 1:30000 (depending on the expected amount of protein) in 4% skim milk in TBST20. The membranes were washed 4 times for 20 min each with TBST20 and the proteins were detected using an ECL kit (Bio-Rad). The ECL signals were digitized with a CCD camera (Alpha Innotech) or exposed to films (CL-Exposure, Thermo Scientific) and developed in AGFA Curix CP-1000 device.
Co-immunoprecipitation
Related to Figure 5 and Tables S5, S6, and S7. HEK293 FLP-In T-Rex cells stably expressing EGFP (control), EGFP-TUT4, EGFP-TUT7 or EGFP-MOV10 cultured for 7-10 days in the absence of tetracycline. Between 40 and 48h before harvesting, the cells were plated onto four 145 mm dishes (Greiner) in medium containing 25-100 ng/ml tetracycline. After 40-48h the medium was removed and the cells were gently washed twice with room-temperature PBS. Thereafter, dithiobis (succinimidyl propionate) (DSP, Pierce) freshly prepared in DMSO was diluted in room-temperature PBS to 2 mM in 10 mL and overlaid onto the cells. Cells were incubated with PBS/DSP for 30-45 min at ∼10°C prior to removing the solution and harvesting the cells by scraping (with rapid buffer flow from a 5 mL pipette tip) into ice-cold 100 mM Tris-HCl (pH 8.0)/PBS (to stop DSP primary-amine reactivity) and centrifugation at 500 rcf. for 5 min in 50 mL tubes (BD). The cell pellets were either processed directly or flash frozen in liquid nitrogen and stored at −80°C.
Prior to analysis, the cells were suspended and lysed in 2.5 mL 1x lysis and binding buffer (20 mM HEPES-KOH, pH 7.1, 100 mM NaCl, 0.5% Igepal CA-630 (NP40), 3 mM MgCl2, 10% glycerol, with 2 mM benzamidine, 0.6 μM leupeptin, 2 mM pepstatin A and 1 mM PMSF as protease inhibitors and 0.1 mg/ml RNase A) for 30 min on ice before sonication. Crude lysates were centrifuged at 16,000 rcf. at 4°C for 15 min in low protein-binding siliconized tubes (Eppendorf or Sigma). Cleared lysates were mixed with ∼100 μL magnetic beads coupled with GFP-Trap nanobody and incubated at ∼10°C for 1h with head-over-tail rotation. The lysates with unbound proteins were removed and the beads with bound proteins were washed 6 times with 1x washing buffer (as for 1x lysis and binding buffer but with 0.5 M NaCl). The proteins retained on the beads were released by boiling with 120 μL release buffer (3% SDS, 50 mM Tris-HCl pH 8.0, 50 mM DTT, 10% glycerol) for 5 min. Part (1/10) of the material was analyzed by SDS-PAGE and silver staining and the remainder was precipitated using methanol-chloroform and analyzed by LC-MS/MS (see below).
Related to Table S5. ORF1-FLAG pull-downs were done using HEK293 FLP-IN T-Rex cells with tetracycline-inducible expression of full-length LINE-1 RPS with L1-ORF1p-FLAG. The co-IP was done as described above.
LC-MS/MS
Proteins were dissolved in 100 μL 100 mM ammonium bicarbonate buffer, reduced in 100 mM DTT for 30 min at 57°C, alkylated in 55 mM iodoacetamide for 40 min at RT in the dark and digested overnight with 10 ng/ml trypsin (V5280, Promega) at 37°C. To stop the digestion, trifluoroacetic acid was added at a final concentration of 0.1%. The mixture was centrifuged at 14,000 rcf. at 4°C for 20 min to remove precipitated material. MS analysis was performed by LC-MS in the Laboratory of Mass Spectrometry (IBB 334 PAS, Warsaw) using a nanoAcquity UPLC system (Waters) coupled to a LTQ-Orbitrap Velos or QExactive mass spectrometer (Thermo Fisher Scientific). The mass spectrometer was operated in the data-dependent MS2 mode, and data were acquired in the m/z range of 300-2,000. Peptides were separated by a 180 min linear gradient of 95% solution A (0.1% formic acid in water) to 35% solution B (0.1% formic acid in acetonitrile). Each sample measurement was preceded by three washing runs to avoid cross-contamination.
UV-crosslink of LINE-1 mRNA to FLAG-TUT7
Related to Figures 5E, 5F, and S5I–S5K. 8x10⁶ 293T cells were seeded onto 6 145-mm culture dishes. Next day the cells (each dish) were transfected with 300 pmoles non-targeting control siRNA (stealth siRNA, Invitrogen) or MOV10-targeting siRNA (C; in the Key Resources Table) using 60 μL Lipofectamine RNAiMAX (Invitrogen) in 5 mL OPTI-MEM (GIBCO; to 20ml medium). Next day, cells were trypsinized and 10x106 cells of each condition were placed onto 2 new 145-mm dishes. Next day, to overexpress LINE-1 and TUT7 the cells (each dish) were transfected with 15 μg pZW-L1RP-megfpI and 15 μg either pZW-MBP-TUT7 (control) or pZW-FLAG-TUT7 using 60 μL Lipofectamine2000 (Invitrogen) in 5 mL OPTI-MEM (GIBCO; to 20ml medium). Cells were allowed to propagate for ∼36-40h followed by media removal, careful washing of the cells attached to the dish with 2x 18 mL PBS (room temperature). Thereafter, cells were overlaid with 5 mL PBS and placed on a tray with ice and water. Cells were irradiated with 4x 120 mJ/cm2 in a UV crosslinker (UVP), with 1 min intervals between individual crosslinking sessions. Harvested cells were pelleted and placed in ice, followed by IP or flash freezing in liquid nitrogen and storage at −80°C.
Protein G Dynabeads preparation
50 μL beads (bed volume; 1.5 mg; per cells’ aliquot obtained from 145-mm dish) were washed 2x in 1ml PBS/0.1% Tween20. Thereafter the beads were suspended in 50 μL PBS/Tween plus 10 μL M2 mouse monoclonal anti-FLAG antibodies (10 μg; Sigma), followed by incubation at room temperature for 30-45 min with occasional pipetting. The unbound antibody was then removed and the beads washed 2x in 1ml PBS/Tween supplemented with 10 ng/ml E. coli tRNA (Roche) for 15min. Finally, the beads were suspended in 100 μL PBS/Tween plus 10 ng/ml tRNA and added to clear lysates aliquots. Note the beads for all experimental conditions within one experimental set were prepared in batch.
IP with FLAG-TUT7 (and MBP-TUT7 as the control)
The cells (of one 145-mm dish) were lysed in 1 mL Lysis buffer (50 mM Tris-HCl, 8.0; 50 mM NaCl; 0.5% Igepal CA-630 (NP40 substitute; Sigma); 5 mM EDTA supplemented with a protease inhibitors mix) by pipetting 20 times in ice, followed by 10 min incubation in ice and 5 cycles of sonication (at 4°C; 30 s on, 30 s off; H setting in a Diagenode Bioruptor sonicator). Crude lysates were centrifuged at 500 rcf., 4°C in 2 mL protein low-bind tubes (Eppendorf). Cleared lysates were mixed with the protein G-M2 anti-FLAG antibodies-coupled Dynabeads in protein low-bind tubes, followed by head-over-tail rotation at ∼6-8°C for 2h. Thereafter, the lysates (unbound material) were removed and the beads were washed 2x with 1ml 1x Lysis buffer, followed by 4x in Stringent Washing Buffer (50 mM Tris-HCl, 8.0; 1 M NaCl, 0.1% Igepal CA-630; 1.3 M urea; 5 mM EDTA supplemented with a protease inhibitor mix) and 2x in Lysis buffer. Each washing was performed for 8-10 min at ∼8°C. Washing volumes were removed efficiently while beads were gathered on a magnetic stand using a vacuum pump with disposable tips. For the last washing the beads were transferred to new tubes. Thereafter, enriched proteins and RNAs were released from the beads by heating at 80°C for 3 min twice with 75 μL Release Buffer (2% SDS; 20 mM EDTA; 50 mM Tris-HCl, 8.0; 10 mM DTT; 20% glycerol; 10 ng/ml E. coli tRNA). 130 μL were taken for RNA extraction. To uncouple covalently cross-linked RNA and protein the mix was supplemented with 20 ng proteinase K (USB) and incubated for 30 min at 37°C followed by standard phenol-chloroform-isoamyl alcohol extraction, TURBO DNase treatment and final purification on RNA-specified silica columns (A&A Biotechnology). Remaining released materials were treated with 50U viscolase for 10 min at 37°C (to uncouple covalently linked RNA and proteins; A&A Biotechnology) separated on SDS-PAGE and stained with silver or transferred to nitrocellulose membrane (Protran, Amersham) and analyzed by western blotting for MOV10 depletion.
Estimation of LINE-1 and GAPDH mRNA enrichment levels
All of the retrieved RNA was reverse transcribed with Superscript III (according to the manufacturer’s recommendations). The cDNA was used for qPCR with Taq-Man probes as described below in the methods applied to estimate steady-state levels and stabilities of mRNAs.
Related to Figure 5E. Enrichment of either LINE-1 or GAPDH mRNA in FLAG-TUT7 co-IP versus control MBP-TUT7 co-IP (after transfection with non-targeting control siRNA) were calculated by using the following formula: 2-(Ct(FLAG-TUT7 co-IP) – Ct(MBP-TUT7 co-IP)); where Ct is an average Ct of 3 technical qPCR reactions of either LINE-1 megfpI or GAPDH.
Related to Figure 5F. LINE-1 and GAPDH levels in FLAG-TUT7 co-IPs from cells transfected with either control non-targeting siRNA or siRNA for MOV10 depletion were related by using the following formula: 2-(Ct(LINE-1) – Ct(GAPDH)) and normalizing median reported for all control co-IPs (without MOV10 depletion) to 1.
Enrichments were calculated using methods described by Livak and Schmittgen (2001). Statistics were calculated using a non-parametric two-tailed Mann-Whitney test (GraphPad Prism package).
Retrotransposition assay – megfpI
Transfection and culture conditions
Related to Figure 1B. 293T cells were seeded in 6-well plates at 0.3x10⁶ cells per well. At ∼20h after seeding, cells from a single well in 2 mL medium were transfected with 0.75 μg of 99 PUR RPS EGFP (or 99 PUR JM111 EGFP as an internal negative control) plasmid and 1.5 μg of pZW plasmids encoding MOV10, TUT4 or TUT7, or catalytically inactive mutant versions of TUT4 or TUT7 (all with N-terminal maltose binding protein tags, MBP) or only MBP (internal positive control), using 7 μL Lipofectamine 2000 (ThermoFisher Scientific) in 300 μL OPTI-MEM (GIBCO) per well. The next day, the medium was exchanged for medium supplemented with 1 μg/ml puromycin (Invitrogen) to select for cells carrying the L1 reporter plasmids. Cells were further selected for 3 days. The medium was then exchanged and the cells were analyzed by flow cytometry on the following day (4 days post-transfection). LINE-1 retrotransposition restriction was also observed when TUTases or MOV10 were tagged with N-terminal FLAG or mCherry tags.
Related to Figure 1C. 293T cells were seeded in 6-well plates at 0.3x10⁶ cells per well. At ∼20h after seeding, cells in a single well in 2 mL medium were transfected with 1 μg 99 PUR RPS EGFP (or 99 PUR JM111 EGFP for negative controls) LINE-1 retrotransposition reporter plasmids and 50 pmol (in total) siRNAs targeting TUT4, TUT7, MOV10 or TUT1 mRNAs or control non-targeting siRNA (high GC content control siRNA from Invitrogen) as described above. Cells were selected for 3 days. The medium was exchanged for medium lacking puromycin and the cells were analyzed by flow-cytometry 4 days post-transfection.
Duplicate to triplicate transfections were performed for each condition in a single experiment. Two or three experiments included up to at least 6 biological replicates. We generally observed 1%–4% of EGFP-positive cells in the control conditions (MBP). We did not find selection with puromycin critical however it prevented excessive proliferation of cells within the 4 days between transfection and FC analysis.
Related to Figure 3B. 293T cells were seeded in 12-well plates at ∼100-150x103 cells per well. Next day, the cells were transfected with 0.5 μg pZW-L1RP-x reporters (where x specifies the pre-designed 3′ end) using 3 μL Lipofectamine 2000 (ThermoFisher Scientific) in 200 μL OPTI-MEM (GIBCO). Retrotransposition was allowed to occur for ∼80h followed by FC analysis as described above. Selection of cells was not carried out. On average 2%–4% cells transfected with th 26A reporter were EGFP positive at the day of analysis.
Flow cytometry – retrotransposition assays
Cells were detached from the wells of the multiwell plates by trypsinization and were suspended in medium containing FBS to stop trypsin activity before centrifugation at 350 rcf. for 3 min. The medium was removed and the cells were suspended in 1 mL PBS. EGFP signals were measured using an Attune NxT instrument (Thermo Fisher Scientific) equipped with 488 nm and 561 nm light beams. The data were analyzed using software provided with the instrument. To gate EGFP+ cells, we first used cells transfected with 99 PUR JM111 EGFP containing a mutated LINE-1 (L1-ORF1p, R261A/R262A), which abolish retrotransposition (Moran, et al., 1996). The gates were adjusted such that ≤ 0.025% cells transfected with 99 PUR JM111 EGFP fell within the EGFP+ gate. At least 200x103 singlet cells were analyzed for each condition. Medians were calculated for all biological replicates and the medians for positive control samples were arbitrarily set as 1. Statistical significance was calculated using ANOVA and Tukey’s multiple comparison test for all pairs.
Retrotransposition assay – mneoI
HeLa-HA cells were seeded in 6-well plates at 0.12-0.5x10⁶ cells per well. At ∼20h after seeding, cells from a single well in 2 mL medium were transfected with 50 pmol (in total) siRNA targeting TUT4, TUT7, or MOV10 or control siRNA (high or low GC content control siRNA from Invitrogen) using 3-5 μL Lipofectamine RNAiMAX (ThermoFisher Scientific) in 300 μL OPTI-MEM (GIBCO). On the following day, the medium was exchanged and the cells were allowed to propagate for 48h before subsequent transfection with 1 μg of either JM101/L1.3 mneoI plasmid or 99 PUR RPS EGFP (for negative controls) LINE-1 retrotransposition reporter plasmids. The day after transfection, the medium was exchanged and the cells were allowed to propagate for 4 days with a change of medium every 2 days. Thereafter, the cells were incubated for 12-18 days with medium supplemented with 600 μg/ml G-418 (Invitrogen) to select cells in which retrotransposition occurred. The medium was exchanged every 2 days. The colonies were stained with crystal violet and counted. Six independent experiments were performed (some in duplicates). The number of colonies in each experiment and experimental condition was normalized to respective controls assuming that the mean retrotransposition rate in the control is 1.
Analyses of L1-ORF1p and L1-ORF2p translation
Plasmids encoding active LINE-1s: (i) JM101/L1.3-O1EGFP-O2cherry, where L1-ORF1 has been fused with the EGFP cDNA and where L1-ORF2 has been fused with the mCherry cDNA, (ii) pZW-L1RP-O1-mCh encoding L1-ORF1p-mCherry and (iii) pZW-L1RP-O2-G encoding L1-ORF2p-EGFP were used to estimate translation efficiency.
293T cells were co-transfected with either of the above plasmids and pZW plasmids for overexpression of N-terminal tagged proteins as described in “Retrotransposition assay – megfpI.”
Cells were analyzed by flow cytometry 48 h post-transfection. For analyses of L1-ORF1p and/or L1-ORF2p translation alone, only those cells displaying fluorescent signals above that of background levels determined for non-transfected control cells were used. Median intensities were calculated for biological replicates and arbitrarily set to 1 for MBP-expressing cells (controls). Statistical significance was calculated as described in the section “Flow cytometry – retrotransposition assays.”
RNA isolation
Total RNA was isolated from cells using 1 mL TRI-reagent (Sigma) (Chomczynski and Sacchi, 1987) per well of 6-well plates according to the manufacturer’s instructions. After RNA recovery, the RNA pellets were suspended in ∼100 μL TNES buffer (50 mM Tris-HCl pH 8, 100 mM NaCl, 10 mM EDTA, 1% SDS) supplemented with 20 ng/ml proteinase K (USB) and incubated for 15 min at 37°C to remove contaminating proteins. The material was then subjected to two phenol-chloroform extractions. To remove DNA contamination, 5-10 μg input RNA used for RNA-seq and 3′ RACE-seq was additionally treated for 30 min at 37°C with 2 μL Ambion TURBO DNase (ThermoFisher Scientific) in 50 μl. RNA was then purified by either two sequential phenol-chloroform extractions and ethanol precipitation or with Clean-Up RNA concentrator silica RNA-binding columns (A&A Biotechnology).
Northern blotting
Cell culture and RNA retrieval
Related to Figure 4A. 293T cells were seeded in 6-well plates at 0.5x10⁶ cells per well. At ∼20h post-seeding, cells in a single well in 2 mL medium were transfected with 0.75 μg JM101/L1.3 nomarker and 1.5 μg pZW plasmids: empty (p0 described as pKK-NoTag in Szczesny et al. [2018]), or encoding EGFP, mCherry, MBP, or MOV10, TUT4, TUT7 or TUT4 and TUT7 catalytically inactive mutant versions tagged with N-terminal MBP using 7 μL Lipofectamine 2000 (ThermoFisher Scientific) in 300 μL OPTI-MEM (GIBCO) per single well. At 30h post-transfection, the medium was removed and RNA was extracted using 1 mL TRI-reagent per well (as described in “RNA isolation”).
Related to Figure S4A. Total, TURBO DNase (Ambion)-treated RNA from HEK293 FLP-IN T-Rex, 293T, PA-1 and HeLa-HA cells was used in a poly(A) mRNA selecting protocol with the Ambion’s Poly(A)Purist MAG kit according to the manufacturer’s recommendations.
RNA separation in denaturing agarose gels
To visualize long RNA with high resolution, we used the protocol described by Mansour and Pestov (2013). Briefly, RNAs were separated in 15 × 20 cm 1% agarose gels with 0.45 M formaldehyde in TT buffer for 4-5h at 70 V until the xylene cyanol dye front was within ∼0.5 cm of the gel margin. Gel electrophoresis capillary transfer to Amersham Hybond N+ nylon positively charged membranes was then immediately performed O/N at RT in 20x SSC. The blots were rinsed in water and RNA was fixed to the membrane by 254 nm UV crosslinking using a CL-1000 crosslinker (UVP) with the auto crosslink function (120 mJ/cm2). The membranes were stained with methylene blue and the staining was digitized. The membranes were then preincubated in PerfectHyb hybrydization buffer (Sigma) for at least 1h at 65°C.
Probe production
We used ssDNA probes randomly labeled with α32P (dATP). For templates, we used PCR amplicons generated on the template of the 99 PUR RPS EGFP plasmid and the primers L1_seq7 (forward; see Table S1) and ORF2_rev1 (reverse) to obtain a 497 bp fragment of the L1-ORF2 3′ region. The PCR amplicon (100 ng) was used in a custom linear amplification using only a single primer, SONDA_ORF2 (reverse), together wtih 50 μM dCTP/dGTP/dTTP and α32P dATP ∼1 μM in Phusion HF buffer using Phusion HF polymerase (Thermo Scientific). A total of 25 cycles were used to generate a 154 bp probe. Analogous probes were prepared for GAPDH using the primers GAPDH_qP_f1 (forward) and GAPDH_qP_r2 (reverse) to yield a 930 bp dsDNA fragment and GAPDH_qP_r1 (reverse) to generate the ssDNA probe.
All probes were separated from template dsDNA and shorter products using 6% denaturing PAGE. Full-length probes were cut-out of the gel, eluted in 300 mM sodium acetate/2 mM EDTA/5%phenol+chloroform+isoamyl alcohol mixture (25:24:1) overnight and precipitated with ethanol as described in Razew et al. (2018).
Hybridization conditions
Blots were incubated with ∼0.5-1x10⁶ cps/ml probes in ∼5-10 mL PerfectHyb hybridization buffer (Sigma) for 24h at 65°C with constant head-over-tail rotation. Blots were washed 3 times with 0.5x SSC/0.1% SDS for 20 min at 65°C before drying and exposure to Fuji 32P screens. The screens were scanned using a Fuji PhosphorImager (FLA7000).
RNA-seq
Cell culture and RNA retrieval
Triplicate biological samples were prepared for each tested condition.
HEK293 FLP-In T-Rex cells were cultured (and transfected) in 6-well format as decribed above for retrotransposition assays.
For overexpression conditions: HEK293 FLP-In T-Rex stable cell lines expressing EGFP-TUT4, EGFP-TUT7 were cultured for 48h in the presence of 100 ng/ml tetracycline or in its absence. Similarly, HEK293 FLP-In T-Rex cells were transfected with pZW-EGFP-MOV10 plasmid for MOV10 overexpression and cultured with or without tetracycline for ∼48h before harvest.
For depletion conditions in HEK293 FLP-In T-Rex: cells were transfected with 50 pmoles respective siRNAs using 5 μL Lipofectamine RNAiMAX (Invitrogen) according to the manufacturer’s recommendations and cultured for ∼68h prior to harvesting.
For depletion conditions in PA-1: cells were transfected with siRNAs as described in “Northern blotting.” After 3 days, the cells were trypsinized and transferred into new 6-well plates at 0.2x10⁶ cells per well, followed by another identical transfection. Finally, 6 days after the first siRNA transfection the cells were used to isolate total RNA as described above. A portion (1/3 volume in media) of the trypsinized cells was used for protein retrieval for western blotting validation of protein depletion. RNA was treated with Ambion TURBO DNase (ThermoFisher Scientific) according to the manufacturer’s recommendations.
RNA-seq library preparation
Following DNase treatment, all RNA samples were supplemented with equal amounts of ERCC RNA spike-in mix (Thermo Fisher Scientific) followed by depletion of rRNA using a Ribo-Zero H/R/M Kit (Epicenter) according to the manufacturer’s protocol. Strand-specific RNA libraries were prepared in triplicate using a KAPA Stranded RNA-seq Library Preparation Kit for Illumina platforms (KAPA Biosystems) according to the manufacturer’s protocol that included RNA fragmentation for 8 min at 95°C and 700 μM adapters for amplification. We used 7 cycles of amplification to generate the libraries, which were analyzed by capillary electrophoresis using a Bioanalyzer 2100 (Agilent). The libraries contained ∼250 bp inserts.
RNA-seq library sequencing
The libraries were sequenced using Illumina NextSeq500 (75-nt paired-end mode) and HiSeq2500 (100-nt paired-end mode) sequencing platform to an average number of ∼20x106 reads per library. Details in the online supporting material.
LINE-1 s differential expression
Reads were mapped against the human genome (ver. hg38) using STAR (Dobin et al., 2013) and counted using TEtranscripts (Jin et al., 2015) and –mode unique settings, with Gencode v27 basic for gene and hg38_rmsk_TE.gtf downloaded from http://labshare.cshl.edu/shares/mhammelllab/www-data/TEToolkit/ for repetitive elements annotation. Differential expression analysis was performed using DESeq2. For the purpose of statistical analysis counts for all human-specific LINE1 sequences were summed and treated as single. For the purpose of Figures 4F, 4G, and S4F experimental samples were normalized to controls using a normalized counts mean across all control replicates.
Rapid Amplification of 3′ cDNA ends with high throughput sequencing (3′ RACE-seq)
Cell culture and RNA retrieval
At least 3 biological replicates were prepared for each tested condition.
Tests of the effects of either protein overexpression or depletion were performed in both HEK293 FLP-In T-Rex cells. The transfection conditions were as described above in “Retrotransposition assay – megfpI.”
PA-1 cells were used to assess the effects of TUTases or MOV10 depletion on LINE-1 3′ ends. Cells were transfected as described above in “RNA-seq.”
To test genome-encoded LINE-1 mRNA, wild-type, unperturbed PA-1, H9 and NPC cells were cultured as described above.
Mouse testis tissue was acquired as described above.
RNA was isolated as described above.
Splint-ligation of long spike-in ssDNA
In the original TAIL-seq paper (Chang et al., 2014), full-length spike-in sequences used in TAIL-seq sequencing for poly(A) length estimation were generated by PCR using a long ssDNA template. We prepared spike-ins as described by Cheng et al., 2014. In this case, however, long-A spike-ins (64 As and to a far lesser extend 32As) but not the short-A spike-ins tended to become shortened in PCR. Thus we ordered full-length ssDNA spike-ins to avoid amplification. Spike-ins having 0, 8, 16 and 32 consecutive adenines could be ordered as single synthetic DNAs whereas spike-in comprising 64 consecutive adenines could not be synthesized in this way. We thus ordered 5′ and phosphorylated 3′ regions of these spike-in (see Key Resources Table) for use in splint ligations. The reaction comprised 200 pmol 5′ fragment, 200 pmol splint DNA and 300 pmol 3′ phosphorylated fragment in 10 mM Tris-HCl pH 8 and 20 mM NaCl in 33 μl. The reaction was heated to 80°C for 5 min, slowly cooled to RT, and combined with 4 μL and 3 μL T4 DNA ligase buffer and enzyme (NEB), respectively. The reaction was incubated at RT (22°C) for 2h and then mixed with formamide loading dye. Ligated full-length ssDNA spike-in were separated from 5′ and 3′ fragments and the splint in 6% denaturing PAGE and purified. The ligation efficiency was ∼50%–70%.
3′ RACE-seq library preparation
Total RNA acquired from either whole cells or testis or from cytoplasmic and nuclear cell compartments was treated with Ambion TURBO DNase (ThermoFisher Scientific) according to the manufacturer’s recommendations and as described above. RNA (∼2-3 μg) for each sample was used in a ligation reaction containing 125 pmol RA3_15N 3′ adaptor (5′ preadenylated and individually barcoded with a 15N sequence). The reactions were carried out in 20 μL with 1x T4 RNA ligase 2 truncated buffer (NEB) supplemented with PEG-8000 at 10% final concentration, 0.25 U/μl RiboLock inhibitor (Thermo Fisher Scientific), 3 pmol of the 5′ FAM-labeled 44-mer oligonucleotide RNA44 (Future Synthesis) and 300 U T4 RNA ligase 2 truncated (NEB) for 18h at 18°C. To assess ligation efficiency, 1/10 of the sample was loaded onto 10% denaturing PAGE to separate free and RA3_15N-ligated RNA44. The gels were scanned using a FLA-7000 apparatus (GE Healthcare). We assessed the ligation efficiency of RNA44 and RA3_15N to be at least 80% for all samples. The remaining sample was mixed with 18 μL Agencourt AMPure XP magnetic beads (Beckman Coulter) and the ligated RNAs were separated from non-ligated adapters and short (< 100 nt/bp) RNA/DNA fragments according to the manufacturer’s protocol. RNA ligated to RA3_15N was released from the beads with 20 μL water.
The samples were then mixed with 100 pmol RNA PCR Index Primers (Tru-Seq Illumina) that each contained a barcode specific for the sample (48 indexes available). The primers base-paired with the 3′ end of the RA3_15N adaptor to preserve the individual transcript barcoding (15 degenerate nucleotides). The samples were then reverse-transcribed in 20 μL using 200 U (1 μl) Super Script III reverse transcriptase (Thermo Fisher Scientific) according to the manufacturer’s protocol. After incubating RNA-RA3_15N with the primers and dNTPs (0.2 μM) at 65°C for 5 min, the samples were cooled to 55°C for 5 min and placed on ice. Buffers were then added, followed by addition of SSIII and incubation at 55°C for 1 min and 45 min at 45°C. The enzymes were then denatured by incubating at 75°C for 15 min. The cDNAs were purified from the excess primers, fragmented RNA and reaction buffers using Agencourt AMPure XP beads as described above.
3′ RACE-seq libraries were generated using a nested PCR approach for reporter plasmid-encoded and endogenous genome-encoded LINE-1 mRNAs. Libraries for ACTB, GAPDH, PABPC4 and SOGA2 mRNAs were prepared as controls. For each sample, 1/4 of the cDNA was used in a 20 μL PCR reaction with mRNA-specific outer primers (see Table S1) at 0.4 μM and 0.3 μM of a universal reverse primer RPuni (denoted uni rev in Figure S7), which is complementary to the extreme 3′ region of all RNA PCR Index Primers. Phusion HF enzyme and buffers (Thermo Fisher Scientific) were used according to the manufacturer’s recommendations. Routinely, 20 PCR cycles were performed with a 12 s elongation at 70°C. The PCR1 amplicons were purified from excess unused primers, fragmented RNA and reaction buffers using Agencourt AMPure XP beads as described above.
A second PCR (PCR2) was performed using purified products from the first PCR (PCR1) as templates in a 25 μL reaction volume. Outer primers specific for the mRNAs were used as specified in Table S1 at 0.36 μM and RPuni at 0.4 μM. The other reaction conditions were as for PCR1. PCR2 products were purified twice using Agencourt AMPure XP beads. Following purification, the libraries were eluted in 20 μL and quantified using a NanoDrop spectrophotometer (Thermo Fisher Scientific). Most of the libraries were within 10-30 ng/μl. The libraries were diluted to 3-5 ng/μl and analyzed by capillary electrophoresis using a Bioanalyzer 2100 (Agilent). Most libraries were ∼280-300 bp long (after subtracting 120 bp adaptor sequences). Libraries and spike-in ssDNA sequences (used to estimate poly(A) length, synthesized as “ultramers” by IDT) were quantified using qPCR with primers P5 and P7R and a Platinum qPCR kit (Thermo Fisher Scientific).
3′ RACE-seq library sequencing
3′ RACE-seq libraries were sequenced on Illumina MiSeq, using V3 chemistry, with settings forcing storage of raw intensity files (cif files). To overcome the limitation of maximum number of individual libraries sequenced in single sequencing run we pooled libraries targeting different transcripts and restored them in the further analysis steps using unique primer sequences. All libraries were sequenced with the pair-end settings, with read lengths 300+300 (with the exception of one experiment, where 100+150 read lengths were used). Special full-length spike-in ssDNA (references for poly(A) length) were included to produce ∼150x103 reads per single spike-in.
3′ RACE-seq library cloning
Related to Figure S2E. Selected libraries were also cloned into pCR-Blunt II-TOPO (Invitrogen) or pJET1.2/blunt (Thermo Fisher Scientific) according to the manufacturer’s recommendations. Plasmid mini (A&A Biotechnology) was used for plasmid preparation. Clones were digested with enzymes flanking the insert and selected clones were sequenced using standard Sanger sequencing.
3′ RACE-seq data analysis
Graph presenting the flow of the analysis is presented in Figure S7B. Raw sequencing data (containing cif intensity files) were processed using tailseeker 3.17 (https://github.com/hyeshik/tailseeker), to produce fastq output and get information about the length of A-tails (and possible additions at the 3′end of the tail). Output files were demultiplexed by primer sequences using sabre (https://github.com/najoshi/sabre, modified to leave primer sequences from the output), allowing maximum 2 mismatches in the primer sequence. Resulting reads were then further processed using a set of in-house prepared scripts to get detailed information regarding 3′ ends of analyzed transcripts. For libraries targeting LINE1 reporter (or control transcripts: ACTB, GAPDH, PABPC4 or SOGA2) both 5′ (R5 – notation based on the tailseeker3 output) as well as 3′ (R3) reads were mapped to the respective sequences using bowtie2 (Langmead and Salzberg, 2012), with –very-sensitive-local setting to allow for soft-clipping of non-templated nucleotides. In the case of libraries targeting endogenous LINE1 sequences Repeatmasker (Smit, AFA, Hubley, R & Green, P. RepeatMasker Open-4.0. 2013-2015, http://www.repeatmasker.org) was used over both R5 and R3 reads, with settings “-norna -nolow -qq -div 10” and human repeats library filtered to contain LINE1 sequences only, or mouse specific database in case of murine samples. Part of sequences which were not assigned to any LINE1 sequence were treated as non-templated (clipped) as in the case of reporter LINE1 sequences and extracted for further analysis. For all subsequent steps only pairs in which at least one read was identified as coming from desired transcript were considered for analysis.
Next, we analyzed 3′ end types of tails present in analyzed samples and the rate of uridylation. All pairs for which tailseeker identified any tail were included in the analysis without any modification. In the other case we used non-templated nucleotides to further classify such reads. As we expected short fragments due to localization of RACE primers, only reads containing tailseq-delimiter sequence CTGAC in non-templated fragment of R5 were considered for analysis. Any nucleotides preceding the delimiter were treated as a possible tail. If a non-templated fragment didn’t contain any nucleotides before CTGAC such reads were excluded from the analysis. In the case of experiment, where R5 read was much shorter (50nt), if we were able to locate CTGAC delimiter sequence in R5 non-templated fragment, preceding nucleotides were treated as a tail, otherwise sequence clipped from the R3 read was treated as a possible tail.
All possible tails were then grouped into classes based on their nucleotide composition: (i) A-only tails ii) AU tails (A tail with additional U); (iii) U-only tails; (iv) no tail – when no tail was detected and (v) other (no falling into any of mentioned classes). The latter were excluded from the analysis as they are possible artifacts of the nested PCR protocol used for library generation.
Uridylation frequency was calculated as fraction of AU and U-only tails compared to all classified.
3′ RACE-seq statistics
For multiple group comparisons, when normality assumptions were met, we used one-way ANOVA and Tukey’s post hoc test.
Assessment of LINE-1 mRNA steady-state levels and stabilities by RT-qPCR
Estimation of LINE-1 mRNA steady-state levels
Related to Figure 3B. 293T cells were plated at 120x103 cells per well of a 12-well plate. Next day the cells in a single were transfected with 0.5 μg pZW-L1RP-megfpI-xyz-TRL (where xyz is either of: 19A, 19A3U, 26A, 26A2U, 26A4U, 26A6U, 26A26U, 7U, 26U) and 3 μL Lipofectamine 2000 (Invitrogen) in 200 μL OPTI-MEM (GIBCO). Triplicate to quadruplicate transfections were done for a single reporter in a single experiment (3 experiments in total). Cells were harvested ∼36-40h post-transfection and RNA isolated using TRI reagent and as described in the below paragraph.
Related to Figures 4 and S4. RNA was retrieved as for RNA-seq. Four to six biological replicates were analyzed.
Estimation of reporter LINE-1 mRNA stability – transfections and RNA retrieval
293T cells were plated at 360x103 cells per well of a 6-well plate. Next day the cells in a single well were co-transfected with 1 μg pZW-L1RP-megfpI and 1 μg pZW plasmid encoding either MBP, MBP-TUT4, MBP-TUT7, MBP-MOV10 (or FLAG-tagged versions, but TUT4 that does not express well with N’ FLAG) and 6 μL Lipofectamine 2000 (Invitrogen). 8h later cells from 1 well of a 6-well plate were trypsinized and reseeded onto 6 wells of a 24-well plate. After additional 12h actinomycin D was added in time intervals to expose the cells to the chemical for 6, 4, 3, 2, 1h and a single well was kept without actinomycin D addition. The medium was removed and the cells were covered with 0.5 mL TRI reagent (Sigma). RNA was isolated using extraction with chloroform as described in the manufacturer’s procedures and additional phenol-chloroform extraction. RNA was measured and 5 μg treated with 2 μL TURBO DNase (Ambion) according to the manufacturer’s procedure for 1h. Following enzymatic DNA removal RNA was purified from the reaction mixture using Clean-Up RNA Concentrator silica columns (A&A Biotechnology), eluted with 40 μL water and concentration estimated by UV spectroscopy. Six independent biological replicates were performed.
RT-qPCR
Reverse transcription of 0.2-1 μg of RNA was performed with SuperScript III (Invitrogen) according to the attached protocol and using priming with 50 ng of random primers (Invitrogen). Obtained cDNA was subjected to qPCR experiments in 20x final dilution. Two different approaches were applied. Endogenous LINE1 and LINE1 reporter transcripts were detected in TaqMan type assay (Applied Biosystems, TaqMan Fast Advanced Master Mix and primers and probe with FAM dye) in one reaction with probes for detection of GAPDH transcripts (Applied Biosystems, TaqMan Gene Expression Assay, 4448490, probe with VIC dye). Custom oligonucleotides sequences were as follows, for detection of LINE1 reporter: forward primer TAQMAN_EGFPI_2_FOR, reverse primer TAQMAN_EGFPI_2_REV, probe TAQMAN_EGFPI_2_PROBE (see Table S1).
For detection of endogenous L1-Ta mRNA primers and probe were adapted from Coufal et al. (2009): forward primer Coufal_for (see Table S1), reverse primer Coufal_rev, probe Coufal_probe.
MYC transcripts levels were detected using standard qPCR approach and Platinum SYBR Green qPCR SuperMix-UDG (Invitrogen) with 0.2 μM primers: forward primer TTCGCAACTATGTGTTCGCG (U6ChF), reverse primer AAAACGGTTCATCCTTATGC (U6ChR).
Amplification and data acquisition was conducted in LightCycler® 480 (Roche) using standard temperature schema and reaction compositions proposed by the qPCR reagents manufacturers.
LINE-1 Amplification Protocol
LINE-1 amplification protocol (LEAP) analysis was performed on the basis of the concept described by Kulpa and Moran (2006) with modifications.
Briefly, three 145-mm dishes were each seeded with 3x10⁶ HEK293T cells. Fourteen hours after seeding, the cells in 25 mL medium were transfected with 14 μg of pZW-L1-26A-TRL, pZW-L1-26U-TRL or pZW-L1-26A26U-TRL using 60 μL Lipofectamine in 5 mL OPTI-MEM (GIBCO) as per the manufacturer’s recommendations. Around 40h after transfection, the cells reached ∼90% confluency and were harvested by scraping into PBS and centrifuging at 2,800 rcf. for 7 min at 4°C. The cell pellets were then suspended in 300 μL lysis buffer (0.35x PBS, 6 mM EDTA, 0.12% Igepal CA-630) supplemented with EDTA-free protease inhibitors (Roche). The cells were lysed by pipetting several times, incubated on ice for 10 min and centrifuged at 4,000 rcf. for 2 min at 4°C. Then, 300 μL was taken from each sample and centrifuged again as described above. About 220 μL was loaded onto a sucrose cushion in 20 mM Tris-HCl pH 7.5, 80 mM NaCl, 5 mM MgCl2, 1 mM DTT supplemented with EDTA-free protease inhibitors at 25°C (top 250 μL 8% sucrose, bottom 800 μL 17% sucrose) in TFT-80.2 tubes and spun at 58,000 rpm for 2h at 4°C in a TFT-80.2 rotor (Thermo Fisher Scientific). The transparent to yellowish pellets, ∼3 mm in diameter, were suspended by pipetting in 160 μL (each) 0.1x PBS, 50% glycerol, 5 mM DTT supplemented with EDTA-free protease inhibitors. A portion of this sample was flash frozen in liquid nitrogen and stored at −80°C for RT-PCR.
Eight reverse transcription reactions in 20 μL that included 1 μL suspended RNPs, 0.2 μM reverse primer LEAP_12T or LEAP_12A, 0.3 mM dNTPs and buffers provided with the Super Script III reverse transcriptase (First Strand buffer, 250 mM Tris-HCl pH 8.3 at RT, 375 mM KCl, 15 mM MgCl2 supplemented with DTT to 5 mM) were prepared. Reactions were carried out at 37°C for 1h followed by protein denaturation at 75°C for 15 min. The cDNA was purified using 1 volume Agencourt AMPure XP beads as described above and eluted with 20 μL water.
The purified cDNA (1 μl) was used in a standard PCR reaction in 25 μL total volume with Phusion HF polymerase and buffers (Thermo Fisher Scientific) and 0.2 μM both forward L13UTRef primer and LEAP_rev reverse primer. Amplification was performed in 35 amplification cycles. 10 μL of the reactions were separated in 1% EtBr-agarose gel.
Recombinant protein production
TUT7 was expressed in FreeStyle 293-F cells (Invitrogen) that were cultured to a density of 1 × 10⁶ cells/ml in five 30 mL aliquots of FreeStyle 293 Expression Medium (GIBCO). The cells were transfected using 90 μg linear PEI at 1 μg/μl (MW = 25,000; Polysciences, Inc.) and 30 μg of pZW-EGFP-ZCCHC6 for EGFP-TEV-TUT7 expression. Following transfection, the cells were cultured for 48h at 37°C, 5% CO2, with constant rocking at 120 rpm. Flow cytometry of a small fraction of the pZW-EGFP-ZCCHC6-transfected and non-transfected cells showed that ∼25%–35% of cells expressed EGFP-TUT7 proteins over that of background levels. The cells were then centrifuged for 5 min at 500 g and the resulting cell pellet was suspended in 5 mL Buffer 1 (20 mM Tris-HCl pH 8, 500 mM NaCl, 0.1% Triton X-100, 100 U viscolase nuclease (A&A Biotechnology) and protease inhibitors). The mixture was rotated head-over-tail at 10°C for 15 min and then sonicated at 10°C for 30 min using a Bioruptor sonicator (Diagenode) operating in the heavy duty setting with 15 s pulses followed by 45 s pauses. The lysate was cleared by centrifugation at 12,000 rcf. at 4°C for 20 min. The resulting supernatant was bound to magnetic beads (CNBr-activated SepFast Mag4F, Biotoolomics) coupled to an anti-EGFP nanobody (home-made) for 2h at 10°C with head-over-tail rotation. The beads were then washed with 40 bed volumes Buffer 1. TUT7 was released from the beads by TEV protease (home-made) digestion in 300 μL Buffer 1 supplemented with 10 μg TEV protease for 12h. The released and bead-retained proteins were analyzed by SDS-PAGE and Coomassie Brilliant Blue staining. Aliquots were supplemented with glycerol to 20%, frozen and stored at −80°C.
MOV10 WT and MOV10 K530A mutant (Gregersen et al., 2014) were prepared similarly to what is decribed above except that an N-terminal MBP tag was used (pZW-MBP-MOV10 or pZW-MBP-MOV10_K530A plasmids) and affinity chromatography was carried out with amylose resin (NEB).
L1-ORF1p was produced in Escherichia coli. The full-length L1-ORF1 CDS was amplified using the 99 PUR RPS EGFP plasmid as a template and was cloned into the pET28 expression vector, with a C-terminal 6xHis tag. The plasmid was then transformed into BL21-RIL cells and an aliquot was used to inoculate LB supplemented with kanamycin (50 μg/ml) and chloramphenicol (37.5 μg/ml). The cells were grown for 12h at 37°C with constant rocking (150 rpm). An inoculum from this culture was then used to start a 1 L culture in an autoinducing medium (AIM-Formedium) and the culture was continued for 48h at 18°C with constant rocking. The cells were harvested by centrifugation and the cell pellet was suspended in 150 mL Buffer 1 (20 mM Tris-HCl pH 8, 500 mM NaCl, 10 mM imidazole supplemented with protease inhibitors (Roche EDTA-free) and 50 μg/ml lysozyme). The cells were lysed with the Emulsiflex for 15 min following the manufacturer’s guidelines. The lysate was cleared by centrifugation at 37,000 rpm in a Thermo FL37 8 × 100 rotor at 4°C for 45 min. Recombinant L1-ORF1p was bound to a 5 mL NiNTA FastFlow column (QIAGEN) using Akta Xpress, and the column was washed with 20 column-volumes of Buffer 1 and two column volumes of Buffer 2 (20 mM Tris-HCl pH 8, 1 M NaCl). ORF1 was eluted with Buffer 3 (20 mM Tris-HCl pH 8, 500 mM NaCl, 300 mM imidazole). Aliquots of the collected fractions were analyzed by SDS-PAGE and Coomassie Brilliant Blue staining. Those fractions containing L1-ORF1p were diluted to produce 100 mM NaCl and underwent a final purification on a RESOURCE Q column (GE Healthcare) and gel-filtration on a size-exclusion HiLoad Superdex-200 column (GE Healthcare). The purified protein was analyzed by SDS-PAGE and the concentration was determined using a Nanodrop apparatus at 280 nm and the respective molar extinction coefficient. Samples were supplemented with glycerol to 10%, frozen and stored at −80°C.
ScPRP2 was purified as described in Warkocki et al. (2009). The full length PRP2 gene was PCR amplified from a genomic library of S. cerevisiae (Strain W303A) and ligated into pET21a (Novagen), thus fusing the protein to the C-terminal hexahistidine tag. The plasmid was transformed into E. coli strain Rossetta II (Novagen) by heat-shock procedure. Cultures were grown in 1 L of an auto inducing media, containing amipicillin, incubated at 17°C for 20 or 48 h, respectively. Cells were harvested by centrifugation, washed and the pellets stored at –80°C. Prp2 protein purification was performed at 4°C. The cell pellets were suspended by vortexing in 5ml lysis buffer (50 mM HEPES NaOH pH 7.5, 600 mM NaCl, 2 mM β-mercaptoethanol (β-ME), 20 mM Imidazol, 10% glycerol) per 1 g cells and lysed with a fluidiser system at 80 psi 6 times (Microfluidics). Insoluble material was removed by centrifugation for 40 min at 10,000 rpm in a Sorval SS 34 rotor. The supernatant was applied onto HisTrap HP FF crude column (GE Healthcare), pre equilibrated with lysis buffers, using the Äkta Prime system (GE Healthcare). Contaminants were removed (His tagged proteins) with 10 column volumes (CV) of the lysis buffer followed by 2xCV of a washing buffer (20 mM HEPES-NaOH pH 7.5, 2 M LiCl, 5% glycerol) and further by 2xCV of the lysis buffer, 3xCV of 5% of elution buffer (50 mM HEPES-NaOH pH 7.5, 600 mM NaCl, 2 mM β- ME, 250 mM Imidazol and 10% glycerol) followed by 2xCV of 10%, 15% and 20% of the elution buffer. Bound proteins were eluted with a 20xCV gradient of 20%–100% elution buffer. The Prp2 protein was then applied again onto affinity column, where tags and proteases were bound and purified protein without the tag was collected in the flow through. Protein was concentrated using Centricon concentrators (Millipore) and further purified by size exclusion chromatography (GE Healthcare) using buffers containing 20 mM HEPES NaOH pH 7.5 and salt concentrations ranging from 100 250 mM NaCl (depending on the protein), 2 mM DTT and 5% glycerol. The purified proteins were analyzed by SDS-PAGE (Figure S1). Fractions with 97% or higher purity (estimated by Coomassie Blue staining) were aliquoted, flash frozen in liquid nitrogen and stored at –80°C. The concentration of the proteins was estimated by Bradford assay and A280 measurements.
HsSUV3 was purified as described in Pietras et al. (2018). Briefly, hSuv3 (47-786 aa) was expressed as N-terminal 6xHis-SUMO-tagged protein in E. coli BL21 strain. Bacteria were cultured in autoinduction Super Broth base including trace elements medium (Formedium), supplemented with 2% glycerol and kanamycin (50 μg/ml) for 48 h at 18°C. Bacteria were pelleted and homogenized using EmulsiFlex and protein extracts were subjected to purification. 6xHis-SUMO-tagged proteins purification included following steps: Ni affinity chromatography on the 5-ml column filled with Ni-NTA Superflow resin (QIAGEN), followed by SUMO protease on-column cleavage, desalting, a second round of Ni affinity chromatography with collection of unbound material, and gel filtration Hiload 16/60 Superdex S200 column (GE Healthcare). The purification procedure was performed using an ÄKTA express apparatus. Purified proteins were analyzed by standard SDS-PAGE and Nanodrop (Thermo Fisher Scientific).
In vitro uridylation assays
With 5′ 32P-labeled RNA, L1-ORF1p, MOV10 and TUT4
Five pmoles synthetic RNA44 (Future Synthesis) was labeled with 32P at their 5′ end in 20 μL by using 6 μL γ32P ATP (10 days post the reference date) and PNK (NEB) in 0.7x NEB2 buffer (home-made) for 30 min at 37°C. The RNA was purified off unincorporated γ32P ATP by passing through Sephadex G-50 column and further purified by denaturing PAGE in a 6% gel, excised with a single nucleotide resolution, eluted in REB (300 mM NaOAc, 5.3; 2 mM EDTA; 0.5% phenol/chloroform/isoamyl alcohol 25:24:1) at 4°C overnight and precipitated.
Final concentrations of components in the biochemical in vitro reconstitution reactions: RNA44 0.6–1.25 nM, ATP – 0.5 mM, UTP – 0.25 mM, salt (NaCl) ∼130 mM, DTT 1.25 mM, Tris-HCl 8.0 20 mM, MgCl2 2 mM, MOV10/HsSUV3/ScPRP2 ∼5 nM, TUT4 ∼0.25 nM, cold-trap DNA oligo ∼30 nM. Cold trap was included to prevent rebinding of L1-ORF1p to RNA44 after it has been displaced by the MOV10 RNPase activity.
RNA was mixed with ATP, UTP, DTT and Tris-HCl 8.0/MgCl2. 20 μL of the mix (for 4 reactions) were then mixed with 6 μL of either 500 mM NaCl/20 mM TrisTRI-HCl 8/20% glycerol or proteins MOV10, HsSUV3 or ScPRP2 suspended in this buffer. The mixes were incubated in ice for 5 min. Thereafter 4x 6 μL from each condition were mixed with 1 μL 20 mM Tris-HCl 8/20 mM NaCl or increasing concentrations of recombinant L1-ORF1p in this buffer (prepared as set of dilutions) to final L1-ORF1p in 10 μl: 0, 5, 10, 20 nM. The mixes were incubated for 5 min in ice. Thereafter 2.5 μL of TUT4/cold trap DNA were added and reactions immediately placed at 37°C in 30 s intervals. Reactions were incubated for 18 min keeping the time intervals and then rapidly stopped by addition of 100 μL TNES (Tris-HCl 8/NaCl/EDTA/SDS) supplemented with 20 ng/μl proteinase K (USB). RNA was purified by 2 rounds of phenol/chloroform/isoamyl alcohol 25:24:1 extraction, precipitated with ethanol (after addition of 1.5 μL GlycoBlue precipitant to each sample) and resolved in a 9.6% denaturing PAGE with single nucleotide resolution, scanned and quantified using MultiGauge software.
With 5′ FAM-labeled RNA, L1-ORF1p and TUT7
FAM-labeled 44-mer RNA (RNA44, 50 nM, Future Synthesis) was combined with 0.5 mM UTP in 0.5x NEB2 buffer (home-made, 1x: 10 mM Tris-HCl pH 8, 50 mM NaCl, 10 mM MgCl2, 1 mM DTT). Recombinant L1-ORF1p (or respective buffer) was added to the indicated concentration (0-150 nM) and samples were incubated 5 min at RT. Purified TUT7 WT was then added to 0.5 nM and the samples were incubated at 37°C for 10 min. The reactions were stopped by the addition of proteinase K (USB) in 100 μL TNES (50 mM Tris-HCl pH 8, 100 mM NaCl, 10 mM EDTA, 1% SDS) and purified as described in “RNA isolation.” Finally, the RNA was dissolved in 4 μL standard formamide loading dye, loaded onto an 8% denaturing PAGE gel (20 × 20 × 0.04 cm; 28 lanes) and separated for 70 min at 700 V. The gel was immediately scanned using a FLA-9000 apparatus (GE Healthcare).
In vitro RNase I footprinting assay
Production of 32P-labeled RNA
DNA templates for in vitro RNA transcription were produced by PCR using the 99 PUR RPS EGFP plasmid as a template and forward and reverse primers (T7_L13UTRef gtgagagatgtaatacgactcactataggGGAACTCCATATATGGGCTAT- the T7 promoter is underlined and preceded by several stabilizing nucleotides; and L13UTRrv, TAGGGTACATGTGCACATTGC). The purified DNA was used for two in vitro run-off transcription reactions, “cold” and “hot,” using home-made T7 RNA polymerase to generate 79 nt RNAs. Random 32P labeling was accomplished using 0.5 mM rATP/rCTP/rGTP and 0.1 mM UTP supplemented with 0.1 μM α32P UTP that resulted in labeling of ∼1 of 50 transcripts. “Cold” and “hot” RNAs were separated from the template and shorter products by 6% denaturing PAGE. The relevant bands were excised (after exposure to a film and its development in AFGA Curix CP-1000 device or by illumination with UV of the gel placed on TLC with a fluorescent indicator) and the nucleic acids were eluted overnight in REB (0.3 M sodium acetate pH 5.2, 3 mM EDTA, 1:17 vol/vol of a 25:24:1 phenol/chloroform/isoamyl mixture) followed by ethanol precipitation.
Footprinting
RNase I RNA footprinting was performed as described in Razew et al. (2018) with modifications. Cold and hot L1-3′UTR RNA (125 nM; final concentration in 10 μL was 50 nM or ∼400 cps per sample) were combined in 0.5x NEB2 buffer (home-made, 1x: 10 mM Tris-HCl pH 8, 50 mM NaCl, 10 mM MgCl2, 1 mM DTT) with 2.5 mM ATP (1 mM final concentration in 10 μl) on ice. Recombinant MOV10 or respective buffer was then added where indicated to 22 nM (15 nM final concentration in 10 μl) and samples were moved to RT before recombinant L1-ORF1p was added to a final concentration of 0, 20, or 100 nM in 10 μl. After 2 min, “cold trap DNA” (100 nM final concentration in 10 μl) was added to all samples to bind L1-ORF1p released from the RNA by MOV10 and to prevent rebinding to the RNA, followed by the addition of 1 μL Ambion RNase I (100 U; Thermo Fisher Scientific). The RNA was degraded with RNase I for 25 min at 25°C and the reaction was stopped with 10 μL proteinase K (200 ng; USB) in TNES (50 mM Tris-HCl pH 8, 100 mM NaCl, 10 mM EDTA, 1% SDS) and purified as described in “RNA isolation.” Glycoblue (2 μl) was added to the aqueous phase. Sodium acetate (50 mM, pH 5.2) was then added and the mixture was precipitated for 2 h at −20°C. The RNA was centrifuged, dissolved in 4 μL formamide loading dye and separated on an 8% PAGE gel (30 × 20 × 0.04 cm) at 1250 V for 2 h at RT. The gel was exposed to a phosphorimager screen (Fuji) and scanned using a Fuji PhosphorImager (FLA7000).
Immunofluorescence
Preparation of cells
To visualize EGFP-tagged proteins, parental HEK293 FLP-In T-Rex cells were seeded in 6-well plates at 0.3x10⁶ cells per well and transfected on the following day with 2 μg pZW plasmid encoding the indicated N-terminal EGFP-tagged protein using 7 μL Lipofectamine 2000 (ThermoFisher Scientific) in 300 μL OPTI-MEM (GIBCO). Cell lines stably expressing the indicated proteins were also used and treated as described below.
For co-localization studies of L1-ORF1p-FLAG and endogenous TUT7 and MOV10, HEK293 FLP-In T-Rex cells were transfected as above but instead using 0.75 μg pZW-L1RP-O1F plasmid and 5 μL Lipofectamine 2000.
Next day cells were trypsinized and 1/5 of the cells was reseeded onto polylysine-coated glass slides in new 6-well plate wells or ∼33x103 cells were seeded in a single well of a 8-well Nunc Lab Tek II Chamber slides (for in vivo microscopy) in medium supplemented with 100 ng/ml tetracycline. Cells were analyzed 24-48h after seeding either as live cells or after fixation and staining.
Cell fixation and protein staining
To examine immunofluorescence of fixed cells, the medium was removed from the chamber and the cells were gently washed twice with PBS at 37°C. The cellular contents were fixed by overlaying 3.7% formaldehyde (from 37% aqueous solution) and 5% sucrose in PBS at RT for 15 min, after which the cells were washed with RT PBS three times. The cells were then permeabilized with 0.2% Igepal CA-630 (NP40) with 10% FBS in PBS for 15 min at RT. The permeabilized cells were washed once with RT PBS and incubated in 10% FBS in PBS for 15 min at RT. After removing the solution, primary antibodies (see Key Resources Table) were added at 1:50 (FLAG, TUT4, TUT7) to 1:200 (MOV10) dilutions. Monoclonal mouse anti-FLAG M2 antibodies (Sigma) yielded reproducible L1-ORF1p-FLAG staining. Monoclonal rabbit anti-FLAG antibody F2555 (Sigma) performed well after delivery and when stored at 4°C, but showed no reactivity after freezing and thawing. The cells were incubated with the antibodies for 1 h at RT, washed three times with PBS and secondary Alexa488/555/647-coupled antibodies (depending on the staining) in 10% FBS in PBS were overlaid at 1:800 and incubated for 1 h at RT. The antibodies were then removed and the cells were overlaid with 1:10,000 Hoechst in PBS for 10 min at RT to stain DNA. The cells were washed three times with PBS and the slides were mounted using ProLong Gold Antifade (Thermo Fisher Scientific) and left in the dark at RT to dry overnight.
Microscopic analysis
Imaging was performed using a FluoView1000 Olympus confocal system with a PLANAPO 60x/1.40 oil immersion lens. Live cell imaging was performed at 37°C in a humidified 5% CO2 incubator. Cross-talk was tested and eliminated using bandpass filters.
Quantification of co-localization cytoplasmic foci
The foci were identified by the presence of enriched MOV10 staining. Enrichment of plasmid-encoded TUT4 and TUT7 was assessed by merging images (confocal microscopy channels) in a single frame and visual inspection.
Quantification and Statistical Analysis
Quantification of LC-MS/MS data
Raw data files were used to calculate semiquantitative measures of protein abundances in the samples using MaxQuant software version 1.3.0.5 (Cox and Mann, 2008) and default settings including DSP-acetamide modification and setting multiplicity to 1. Database used for uniprot_human protein sequence database as of Feb. 2013.
Estimation of L1-ORF1p and ORF2p translation
Analysis of L1-ORF1p and L1-ORF2p translation was performed using Attune NxT software and reported in terms of EGFP and mCherry intensities. Laser intensities accommodated the entire fluorescence range without saturation. Singlet cells were analyzed based on initial FSC-A/SSC-A gating (gate 1) and subsequent FSC-H/FSC-A gating (gate 2 used for further analysis). Gates for EGFP+ and mCherry+ cells were then set according to control cells that were not fluorescent. Less than 0.02% of cells among the control cell population were allowed within the EGFP+ or mCherry+ gates.
Data and Software Availability
The accession number for the mRNA expression data reported in this paper is GEO: GSE105264.
The primary data and output of the RACE-seq pipeline can be retrieved from http://adz.ibb.waw.pl/warkocki-et-al-2018
The scripts used in the analysis of the RACE-seq output can be found at https://github.com/smaegol/LINE_1_RACE_seq_analysis
Other data including uncropped blots, Prism files and Snap Gene files can be found at http://dx.doi.org/10.17632/zkb2nr99rw.1
Acknowledgments
We thank Drs. John Goodier and Gael Cristofari for providing plasmids and Dr. Seweryn Mroczek, Dr. Roman Szczesny, Aleksander Chlebowski, and Dominik Cysewski for assistance with cell culture, flow cytometry, confocal microscopy, and mass spectrometry, respectively. We thank Dr. Szymon Swieżewski for critically reading the manuscript and Janina Durys and Aleksander Chlebowski for language editing. This work received support from the National Science Centre (UMO-2012/04/S/NZ1/00036) (to Z.W.), the European Research Council (ERC-STG-2012309419) (to A.D.), and the Foundation for Polish Science (TEAM/2016-1/3) (to A.D.). We used the EU-Financed CePT Infrastructure (Innovative Economy 2007–13 and POIG.02.02.00-14-733 024/08-00) and NGS Platform in the IIMCB Warsaw (6405/IA/1789/2014). J.L.G.-P. is supported by CICE-FEDER-P12-CTS-2256, Plan Nacional de I+D+I 2008-2011 and 2013-2016 (FIS-FEDER-PI14/02152), PCIN-2014-115-ERA-NET NEURON II from the European Research Council (ERC-STG-2012-233764), an International Early Career Scientist grant from the Howard Hughes Medical Institute (IECS-55007420), the Wellcome Trust-University of Edinburgh Institutional Strategic Support Fund (ISFF2), and a private donation by Ms. Francisca Serrano (Trading y Bolsa para Torpes, Granada, Spain).
Author Contributions
Z.W. conceived of the project, provided funding, designed and performed a majority of the experiments, contributed to all of the experiments, and supervised the work; P.S.K. performed the bioinformatics analyses and wrote the respective methods; D.A. set up NGS and performed RT-qPCR; K.B. prepared the recombinant proteins; J.L.G.-P. provided the materials and consulted on the project; A.D. provided funding, designed the experiments, and supervised the work; and Z.W., J.L.G.-P., and A.D. wrote the paper.
Declaration of Interests
The authors declare no competing interests.
Published: August 16, 2018
Footnotes
Supplemental Information includes seven figures and seven tables and can be found with this article online at https://doi.org/10.1016/j.cell.2018.07.022.
Contributor Information
Zbigniew Warkocki, Email: zwarkoc@gmail.com.
Andrzej Dziembowski, Email: andrzejd@ibb.waw.pl.
Supplemental Information
List of DNA oligonucleotides (adaptor, primers and spike-ins) used in preparation of 3′ RACE-seq libraries. Given are names of the oligonucleotides, their sequences and what they were used for.
3′ RACE-seq analysis of the 3′ ends of endogenous and reporter L1 and control mRNAs. Following data are provided: (i) internal reference number; (ii) experimental condition where: “proteinnameKD” denotes knock down of the protein; “protein name” denotes overexpression of the protein; “NT” denotes no transfection; (iii) number of the biological replicate; (iv) cell line; (v) name of the primer used in 3′ RACE-seq amplification; (vi) analyzed mRNA species; (vii) localization where: “total” denotes whole cell; “CYTO” denotes cytoplasmic fraction after cell fractionation; “NUC” denotes” nuclear fraction after cell fractionation; (viii) identifier of the sequencing run; (ix) status of uridylation where: “FALSE” denotes non-uridylated mRNAs and “TRUE” denotes uridylated mRNAs; (x) number of sequenced and analyzed reads, (xi) mean number of As in A-tails (nucleotides); (xii) mean number of As in AU-tails (nucleotides); (xiii) mean number of Us in AU-tails (nucleotides); (xiv) mean number of Us in U-tails (nucleotides).
Analysis of the mass spectrometry results of the L1-ORF1p-FLAG co-IP and its relevant control performed using MaxQuant software. Only proteins specifically enriched in the L1-ORF1p-FLAG co-IP and not identified in the control co-IP are included.
Analysis of the expression of L1s in cells overexpressing TUT4, TUT7 or MOV10. Sequencing reads were mapped against the human genome (ver. hg38) using STAR and counted using TEtranscripts for repetitive elements quantification. Differential expression analysis was done using DESeq2. Table shows Log2 Fold Change and adjusted p values (padj) of each of LINE class included in the analysis for each condition tested (in relation to control samples), calculated by DEseq2.
Analysis of the L1s expression in cells depleted of TUTases and MOV10. Sequencing reads were mapped against human genome (ver. hg38) using STAR and counted using TEtranscripts for repetitive elements quantification. Differential expression analysis was done using DESeq2. Table shows Log2 Fold Change and adjusted p values (padj) of each of LINE class included in the analysis for each condition tested (in relation to control samples), calculated by DEseq2.
Analysis of the mass spectrometry results of EGFP-TUT4 and EGFP-TUT7 co-IPs (with in vivo DSP protein-protein cross-linking and without any crosslinking) and their relevant controls performed using MaxQuant software. In aggregate, following number of co-IPs for the indicated proteins were analyzed: 6 for EGFP control with DSP crosslinking, 6 for EGFP-TUT4 with DSP cross-linking, 7 for EGFP-TUT7 with DSP cross-linking, 6 for control EGFP/HEK293 FLP-IN T-Rex, 7 for EGFP-TUT4, 3 for EGFP-TUT7. Color-coded columns show: (i) normalized mean intensities divided by the detected protein molecular mass, (ii) specificities (i.e., quotient of normalized mean intensities divided by the proteins’ molecular mass in test and control co-IPs). Further, columns show how many times a protein was detected in the indicated sets of co-IPs. The remaining columns are parameters returned by the MaxQuant software as described in its on-line manual and Cox and Mann, 2008. The header of each column is presented in the following manner X Y_(Z)_S_(W)_L where X specifies the MaxQuant parameter, and Y_(Z)_S_(W)_L specify the co-IP conditions in the following order: Y – protein, Z – “DSP” indicates DSP cross-linking, not indicated if not applicable, S – NaCl concentration in mM, W – “RN” indicates inclusion of RNase A in the co-IP, not indicated if not applicable, L – the biological replicate within a series.
Analysis of the mass spectrometry results of EGFP-MOV10 co-IPs (with in vivo DSP protein-protein cross-linking and without any crosslinking) and their relevant controls performed using MaxQuant software. In aggregate, following number of co-IPs for the indicated proteins were analyzed: 5 for EGFP control with DSP crosslinking, 7 for EGFP-MOV10 with DSP cross-linking. Color-coded columns show: (i) normalized mean intensities divided by the detected protein molecular mass, (ii) specificities (i.e., quotient of normalized mean intensities divided by the detected protein molecular mass in test and control co-IPs). Further, columns show how many times a protein was detected in the indicated sets of co-IPs. The remaining columns are parameters returned by the MaxQuant software as described in its on-line manual and Cox and Mann, 2008. The header of each column is presented in the following manner X Y_(Z)_S_(W)_L where X specifies the MaxQuant parameter, and Y_(Z)_L the co-IP conditions in the following order: Y – protein, Z – “DSP” indicates DSP cross-linking, not indicated if not applicable, L – the biological replicate within a series. All co-IPs were done with addition of RNase A, followed by washing with buffer containing 500 mM NaCl.
References
- Alisch R.S., Garcia-Perez J.L., Muotri A.R., Gage F.H., Moran J.V. Unconventional translation of mammalian LINE-1 retrotransposons. Genes Dev. 2006;20:210–224. doi: 10.1101/gad.1380406. [DOI] [PMC free article] [PubMed] [Google Scholar]
- Arjan-Odedra S., Swanson C.M., Sherer N.M., Wolinsky S.M., Malim M.H. Endogenous MOV10 inhibits the retrotransposition of endogenous retroelements but not the replication of exogenous retroviruses. Retrovirology. 2012;9:53. doi: 10.1186/1742-4690-9-53. [DOI] [PMC free article] [PubMed] [Google Scholar]
- Beck C.R., Garcia-Perez J.L., Badge R.M., Moran J.V. LINE-1 elements in structural variation and disease. Annu. Rev. Genomics Hum. Genet. 2011;12:187–215. doi: 10.1146/annurev-genom-082509-141802. [DOI] [PMC free article] [PubMed] [Google Scholar]
- Branciforte D., Martin S.L. Developmental and cell type specificity of LINE-1 expression in mouse testis: implications for transposition. Mol Cell Biol. 1994;14:2584–2592. doi: 10.1128/mcb.14.4.2584. [DOI] [PMC free article] [PubMed] [Google Scholar]
- Callahan K.E., Hickman A.B., Jones C.E., Ghirlando R., Furano A.V. Polymerization and nucleic acid-binding properties of human L1 ORF1 protein. Nucleic Acids Res. 2012;40:813–827. doi: 10.1093/nar/gkr728. [DOI] [PMC free article] [PubMed] [Google Scholar]
- Chang H., Lim J., Ha M., Kim V.N. TAIL-seq: genome-wide determination of poly(A) tail length and 3′ end modifications. Mol. Cell. 2014;53:1044–1052. doi: 10.1016/j.molcel.2014.02.007. [DOI] [PubMed] [Google Scholar]
- Choi J., Hwang S.-Y., Ahn K. Interplay between RNASEH2 and MOV10 controls LINE-1 retrotransposition. Nucleic Acids Res. 2018;46:1912–1926. doi: 10.1093/nar/gkx1312. [DOI] [PMC free article] [PubMed] [Google Scholar]
- Chomczynski P., Sacchi N. Single-step method of RNA isolation by acid guanidinium thiocyanate-phenol-chloroform extraction. Anal. Biochem. 1987;162:156–159. doi: 10.1006/abio.1987.9999. [DOI] [PubMed] [Google Scholar]
- Cordaux R., Batzer M.A. The impact of retrotransposons on human genome evolution. Nat. Rev. Genet. 2009;10:691–703. doi: 10.1038/nrg2640. [DOI] [PMC free article] [PubMed] [Google Scholar]
- Cost G.J., Feng Q., Jacquier A., Boeke J.D. Human L1 element target-primed reverse transcription in vitro. EMBO J. 2002;21:5899–5910. doi: 10.1093/emboj/cdf592. [DOI] [PMC free article] [PubMed] [Google Scholar]
- Coufal N.G., Garcia-Perez J.L., Peng G.E., Yeo G.W., Mu Y., Lovci M.T., Morell M., O’Shea K.S., Moran J.V., Gage F.H. L1 retrotransposition in human neural progenitor cells. Nature. 2009;460:1127–1131. doi: 10.1038/nature08248. [DOI] [PMC free article] [PubMed] [Google Scholar]
- Cox J., Mann M. MaxQuant enables high peptide identification rates, individualized p.p.b.-range mass accuracies and proteome-wide protein quantification. Nat. Biotechnol. 2008;26:1367–1372. doi: 10.1038/nbt.1511. [DOI] [PubMed] [Google Scholar]
- Dmitriev S.E., Andreev D.E., Terenin I.M., Olovnikov I.A., Prassolov V.S., Merrick W.C., Shatsky I.N. Efficient translation initiation directed by the 900-nucleotide-long and GC-rich 5′ untranslated region of the human retrotransposon LINE-1 mRNA is strictly cap dependent rather than internal ribosome entry site mediated. Mol. Cell. Biol. 2007;27:4685–4697. doi: 10.1128/MCB.02138-06. [DOI] [PMC free article] [PubMed] [Google Scholar]
- Dobin A., Davis C.A., Schlesinger F., Drenkow J., Zaleski C., Jha S., Batut P., Chaisson M., Gingeras T.R. STAR: ultrafast universal RNA-seq aligner. Bioinformatics. 2013;29:15–21. doi: 10.1093/bioinformatics/bts635. [DOI] [PMC free article] [PubMed] [Google Scholar]
- Doucet A.J., Hulme A.E., Sahinovic E., Kulpa D.A., Moldovan J.B., Kopera H.C., Athanikar J.N., Hasnaoui M., Bucheton A., Moran J.V., Gilbert N. Characterization of LINE-1 ribonucleoprotein particles. PLoS Genet. 2010;6:e1001150. doi: 10.1371/journal.pgen.1001150. [DOI] [PMC free article] [PubMed] [Google Scholar]
- Doucet A.J., Wilusz J.E., Miyoshi T., Liu Y., Moran J.V. A 3′ poly(A) tract is required for LINE-1 retrotransposition. Mol. Cell. 2015;60:728–741. doi: 10.1016/j.molcel.2015.10.012. [DOI] [PMC free article] [PubMed] [Google Scholar]
- Faehnle C.R., Walleshauser J., Joshua-Tor L. Multi-domain utilization by TUT4 and TUT7 in control of let-7 biogenesis. Nat. Struct. Mol. Biol. 2017;24:658–665. doi: 10.1038/nsmb.3428. [DOI] [PMC free article] [PubMed] [Google Scholar]
- Faulkner G.J., Garcia-Perez J.L. L1 mosaicism in mammals: extent, effects, and evolution. Trends Genet. 2017;33:802–816. doi: 10.1016/j.tig.2017.07.004. [DOI] [PubMed] [Google Scholar]
- Feng Q., Moran J.V., Kazazian H.H., Jr., Boeke J.D. Human L1 retrotransposon encodes a conserved endonuclease required for retrotransposition. Cell. 1996;87:905–916. doi: 10.1016/s0092-8674(00)81997-2. [DOI] [PubMed] [Google Scholar]
- Garcia-Perez J.L., Marchetto M.C.N., Muotri A.R., Coufal N.G., Gage F.H., O’Shea K.S., Moran J.V. LINE-1 retrotransposition in human embryonic stem cells. Hum. Mol. Genet. 2007;16:1569–1577. doi: 10.1093/hmg/ddm105. [DOI] [PubMed] [Google Scholar]
- Garcia-Perez J.L., Morell M., Scheys J.O., Kulpa D.A., Morell S., Carter C.C., Hammer G.D., Collins K.L., O’Shea K.S., Menendez P., Moran J.V. Epigenetic silencing of engineered L1 retrotransposition events in human embryonic carcinoma cells. Nature. 2010;466:769–773. doi: 10.1038/nature09209. [DOI] [PMC free article] [PubMed] [Google Scholar]
- Goodier J.L. Restricting retrotransposons: a review. Mob. DNA. 2016;7:16. doi: 10.1186/s13100-016-0070-z. [DOI] [PMC free article] [PubMed] [Google Scholar]
- Goodier J.L., Cheung L.E., Kazazian H.H., Jr. MOV10 RNA helicase is a potent inhibitor of retrotransposition in cells. PLoS Genet. 2012;8:e1002941. doi: 10.1371/journal.pgen.1002941. [DOI] [PMC free article] [PubMed] [Google Scholar]
- Gregersen L.H., Schueler M., Munschauer M., Mastrobuoni G., Chen W., Kempa S., Dieterich C., Landthaler M. MOV10 Is a 5′ to 3′ RNA helicase contributing to UPF1 mRNA target degradation by translocation along 3′ UTRs. Mol. Cell. 2014;54:573–585. doi: 10.1016/j.molcel.2014.03.017. [DOI] [PubMed] [Google Scholar]
- Hancks D.C., Kazazian H.H., Jr. Active human retrotransposons: variation and disease. Curr. Opin. Genet. Dev. 2012;22:191–203. doi: 10.1016/j.gde.2012.02.006. [DOI] [PMC free article] [PubMed] [Google Scholar]
- Heo I., Ha M., Lim J., Yoon M.-J., Park J.-E., Kwon S.C., Chang H., Kim V.N. Mono-uridylation of pre-microRNA as a key step in the biogenesis of group II let-7 microRNAs. Cell. 2012;151:521–532. doi: 10.1016/j.cell.2012.09.022. [DOI] [PubMed] [Google Scholar]
- Hulme A.E., Bogerd H.P., Cullen B.R., Moran J.V. Selective inhibition of Alu retrotransposition by APOBEC3G. Gene. 2007;390:199–205. doi: 10.1016/j.gene.2006.08.032. [DOI] [PMC free article] [PubMed] [Google Scholar]
- Jin Y., Tam O.H., Paniagua E., Hammell M. TEtranscripts: a package for including transposable elements in differential expression analysis of RNA-seq datasets. Bioinformatics. 2015;31:3593–3599. doi: 10.1093/bioinformatics/btv422. [DOI] [PMC free article] [PubMed] [Google Scholar]
- Jurka J. Sequence patterns indicate an enzymatic involvement in integration of mammalian retroposons. Proc. Natl. Acad. Sci. USA. 1997;94:1872–1877. doi: 10.1073/pnas.94.5.1872. [DOI] [PMC free article] [PubMed] [Google Scholar]
- Khazina E., Truffault V., Büttner R., Schmidt S., Coles M., Weichenrieder O. Trimeric structure and flexibility of the L1ORF1 protein in human L1 retrotransposition. Nat. Struct. Mol. Biol. 2011;18:1006–1014. doi: 10.1038/nsmb.2097. [DOI] [PubMed] [Google Scholar]
- Kimberland M.L., Divoky V., Prchal J., Schwahn U., Berger W., Kazazian H.H. Full-length human L1 insertions retain the capacity for high frequency retrotransposition in cultured cells. Hum Mol Genet. 1999;8:1557–1560. doi: 10.1093/hmg/8.8.1557. [DOI] [PubMed] [Google Scholar]
- Kopera H.C., Larson P.A., Moldovan J.B., Richardson S.R., Liu Y., Moran J.V. LINE-1 Cultured Cell Retrotransposition Assay. Methods Mol. Biol. 2016;1400:139–156. doi: 10.1007/978-1-4939-3372-3_10. [DOI] [PMC free article] [PubMed] [Google Scholar]
- Kulpa D.A., Moran J.V. Ribonucleoprotein particle formation is necessary but not sufficient for LINE-1 retrotransposition. Hum. Mol. Genet. 2005;14:3237–3248. doi: 10.1093/hmg/ddi354. [DOI] [PubMed] [Google Scholar]
- Kulpa D.A., Moran J.V. Cis-preferential LINE-1 reverse transcriptase activity in ribonucleoprotein particles. Nat. Struct. Mol. Biol. 2006;13:655–660. doi: 10.1038/nsmb1107. [DOI] [PubMed] [Google Scholar]
- Łabno A., Tomecki R., Dziembowski A. Cytoplasmic RNA decay pathways - Enzymes and mechanisms. Biochim. Biophys. Acta. 2016;1863:3125–3147. doi: 10.1016/j.bbamcr.2016.09.023. [DOI] [PubMed] [Google Scholar]
- Łabno A., Warkocki Z., Kuliński T., Krawczyk P.S., Bijata K., Tomecki R., Dziembowski A. Perlman syndrome nuclease DIS3L2 controls cytoplasmic non-coding RNAs and provides surveillance pathway for maturing snRNAs. Nucleic Acids Res. 2016;44:10437–10453. doi: 10.1093/nar/gkw649. [DOI] [PMC free article] [PubMed] [Google Scholar]
- Langmead B., Salzberg S.L. Fast gapped-read alignment with Bowtie 2. Nat. Methods. 2012;9:357–359. doi: 10.1038/nmeth.1923. [DOI] [PMC free article] [PubMed] [Google Scholar]
- Li M.Z., Elledge S.J. SLIC: a method for sequence- and ligation-independent cloning. Methods Mol. Biol. 2012;852:51–59. doi: 10.1007/978-1-61779-564-0_5. [DOI] [PubMed] [Google Scholar]
- Li X., Zhang J., Jia R., Cheng V., Xu X., Qiao W., Guo F., Liang C., Cen S. The MOV10 helicase inhibits LINE-1 mobility. J. Biol. Chem. 2013;288:21148–21160. doi: 10.1074/jbc.M113.465856. [DOI] [PMC free article] [PubMed] [Google Scholar]
- Lim J., Ha M., Chang H., Kwon S.C., Simanshu D.K., Patel D.J., Kim V.N. Uridylation by TUT4 and TUT7 marks mRNA for degradation. Cell. 2014;159:1365–1376. doi: 10.1016/j.cell.2014.10.055. [DOI] [PMC free article] [PubMed] [Google Scholar]
- Livak K.J., Schmittgen T.D. Analysis of relative gene expression data using real-time quantitative PCR and the 2(-Delta Delta C(T)) method. Methods. 2001;25:402–408. doi: 10.1006/meth.2001.1262. [DOI] [PubMed] [Google Scholar]
- Lu C., Luo Z., Jäger S., Krogan N.J., Peterlin B.M. Moloney leukemia virus type 10 inhibits reverse transcription and retrotransposition of intracisternal a particles. J. Virol. 2012;86:10517–10523. doi: 10.1128/JVI.00868-12. [DOI] [PMC free article] [PubMed] [Google Scholar]
- Macia A., Widmann T.J., Heras S.R., Ayllon V., Sanchez L., Benkaddour-Boumzaouad M., Muñoz-Lopez M., Rubio A., Amador-Cubero S., Blanco-Jimenez E. Engineered LINE-1 retrotransposition in nondividing human neurons. Genome Res. 2017;27:335–348. doi: 10.1101/gr.206805.116. [DOI] [PMC free article] [PubMed] [Google Scholar]
- Mansour F.H., Pestov D.G. Separation of long RNA by agarose-formaldehyde gel electrophoresis. Anal. Biochem. 2013;441:18–20. doi: 10.1016/j.ab.2013.06.008. [DOI] [PMC free article] [PubMed] [Google Scholar]
- Martin S.L., Branciforte D., Keller D., Bain D.L. Trimeric structure for an essential protein in L1 retrotransposition. Proc. Natl. Acad. Sci. USA. 2003;100:13815–13820. doi: 10.1073/pnas.2336221100. [DOI] [PMC free article] [PubMed] [Google Scholar]
- Mathias S.L., Scott A.F., Kazazian H.H., Jr., Boeke J.D., Gabriel A. Reverse transcriptase encoded by a human transposable element. Science. 1991;254:1808–1810. doi: 10.1126/science.1722352. [DOI] [PubMed] [Google Scholar]
- Monot C., Kuciak M., Viollet S., Mir A.A., Gabus C., Darlix J.-L., Cristofari G. The specificity and flexibility of l1 reverse transcription priming at imperfect T-tracts. PLoS Genet. 2013;9:e1003499. doi: 10.1371/journal.pgen.1003499. [DOI] [PMC free article] [PubMed] [Google Scholar]
- Moran J.V., Holmes S.E., Naas T.P., DeBerardinis R.J., Boeke J.D., Kazazian H.H., Jr. High frequency retrotransposition in cultured mammalian cells. Cell. 1996;87:917–927. doi: 10.1016/s0092-8674(00)81998-4. [DOI] [PubMed] [Google Scholar]
- Morgan M., Much C., DiGiacomo M., Azzi C., Ivanova I., Vitsios D.M., Pistolic J., Collier P., Moreira P.N., Benes V. mRNA 3′ uridylation and poly(A) tail length sculpt the mammalian maternal transcriptome. Nature. 2017;548:347–351. doi: 10.1038/nature23318. [DOI] [PMC free article] [PubMed] [Google Scholar]
- Mroczek S., Dziembowski A. U6 RNA biogenesis and disease association. Wiley Interdiscip. Rev. RNA. 2013;4:581–592. doi: 10.1002/wrna.1181. [DOI] [PubMed] [Google Scholar]
- Mroczek S., Chlebowska J., Kuliński T.M., Gewartowska O., Gruchota J., Cysewski D., Liudkovska V., Borsuk E., Nowis D., Dziembowski A. The non-canonical poly(A) polymerase FAM46C acts as an onco-suppressor in multiple myeloma. Nat. Commun. 2017;8:619. doi: 10.1038/s41467-017-00578-5. [DOI] [PMC free article] [PubMed] [Google Scholar]
- Mullen T.E., Marzluff W.F. Degradation of histone mRNA requires oligouridylation followed by decapping and simultaneous degradation of the mRNA both 5′ to 3′ and 3′ to 5′. Genes Dev. 2008;22:50–65. doi: 10.1101/gad.1622708. [DOI] [PMC free article] [PubMed] [Google Scholar]
- Muotri A.R., Chu V.T., Marchetto M.C.N., Deng W., Moran J.V., Gage F.H. Somatic mosaicism in neuronal precursor cells mediated by L1 retrotransposition. Nature. 2005;435:903–910. doi: 10.1038/nature03663. [DOI] [PubMed] [Google Scholar]
- Naufer M.N., Callahan K.E., Cook P.R., Perez-Gonzalez C.E., Williams M.C., Furano A.V. L1 retrotransposition requires rapid ORF1p oligomerization, a novel coiled coil-dependent property conserved despite extensive remodeling. Nucleic Acids Res. 2016;44:281–293. doi: 10.1093/nar/gkv1342. [DOI] [PMC free article] [PubMed] [Google Scholar]
- Norbury C.J. Cytoplasmic RNA: a case of the tail wagging the dog. Nat. Rev. Mol. Cell Biol. 2013;14:643–653. doi: 10.1038/nrm3645. [DOI] [PubMed] [Google Scholar]
- Ostertag E.M., Prak E.T., DeBerardinis R.J., Moran J.V., Kazazian H.H., Jr. Determination of L1 retrotransposition kinetics in cultured cells. Nucleic Acids Res. 2000;28:1418–1423. doi: 10.1093/nar/28.6.1418. [DOI] [PMC free article] [PubMed] [Google Scholar]
- Pietras Z., Wojcik M.A., Borowski L.S., Szewczyk M., Kulinski T.M., Cysewski D., Stepien P.P., Dziembowski A., Szczesny R.J. Dedicated surveillance mechanism controls G-quadruplex forming non-coding RNAs in human mitochondria. Nat. Commun. 2018;9:2558. doi: 10.1038/s41467-018-05007-9. [DOI] [PMC free article] [PubMed] [Google Scholar]
- Pirouz M., Du P., Munafò M., Gregory R.I. Dis3l2-mediated decay is a quality control pathway for noncoding RNAs. Cell Rep. 2016;16:1861–1873. doi: 10.1016/j.celrep.2016.07.025. [DOI] [PMC free article] [PubMed] [Google Scholar]
- Pizarro J.G., Cristofari G. Post-transcriptional control of LINE-1 retrotransposition by cellular host factors in somatic cells. Front. Cell Dev. Biol. 2016;4:14. doi: 10.3389/fcell.2016.00014. [DOI] [PMC free article] [PubMed] [Google Scholar]
- Razew M., Warkocki Z., Taube M., Kolondra A., Czarnocki-Cieciura M., Nowak E., Labedzka-Dmoch K., Kawinska A., Piatkowski J., Golik P. Structural analysis of mtEXO mitochondrial RNA degradosome reveals tight coupling of nuclease and helicase components. Nat. Commun. 2018;9:97. doi: 10.1038/s41467-017-02570-5. [DOI] [PMC free article] [PubMed] [Google Scholar]
- Sassaman D.M., Dombroski B.A., Moran J.V., Kimberland M.L., Naas T.P., DeBerardinis R.J., Gabriel A., Swergold G.D., Kazazian H.H., Jr. Many human L1 elements are capable of retrotransposition. Nat. Genet. 1997;16:37–43. doi: 10.1038/ng0597-37. [DOI] [PubMed] [Google Scholar]
- Schmidt M.-J., West S., Norbury C.J. The human cytoplasmic RNA terminal U-transferase ZCCHC11 targets histone mRNAs for degradation. RNA. 2011;17:39–44. doi: 10.1261/rna.2252511. [DOI] [PMC free article] [PubMed] [Google Scholar]
- Schneider C.A., Rasband W.S., Eliceiri K.W. NIH Image to ImageJ: 25 years of image analysis. Nat. Methods. 2012;9:671–675. doi: 10.1038/nmeth.2089. [DOI] [PMC free article] [PubMed] [Google Scholar]
- Skariah G., Seimetz J., Norsworthy M., Lannom M.C., Kenny P.J., Elrakhawy M., Forsthoefel C., Drnevich J., Kalsotra A., Ceman S. Mov10 suppresses retroelements and regulates neuronal development and function in the developing brain. BMC Biol. 2017;15:54. doi: 10.1186/s12915-017-0387-1. [DOI] [PMC free article] [PubMed] [Google Scholar]
- Suzuki K., Bose P., Leong-Quong R.Y., Fujita D.J., Riabowol K. REAP: A two minute cell fractionation method. BMC Res. Notes. 2010;3:294. doi: 10.1186/1756-0500-3-294. [DOI] [PMC free article] [PubMed] [Google Scholar]
- Swergold G.D. Identification, characterization, and cell specificity of a human LINE-1 promoter. Mol. Cell. Biol. 1990;10:6718–6729. doi: 10.1128/mcb.10.12.6718. [DOI] [PMC free article] [PubMed] [Google Scholar]
- Szczesny R.J., Kowalska K., Klosowska-Kosicka K., Chlebowski A., Owczarek E.P., Warkocki Z., Kulinski T.M., Adamska D., Affek K., Jedroszkowiak A. Versatile approach for functional analysis of human proteins and efficient stable cell line generation using FLP-mediated recombination system. PLoS ONE. 2018;13:e0194887. doi: 10.1371/journal.pone.0194887. [DOI] [PMC free article] [PubMed] [Google Scholar]
- Thomas M.P., Liu X., Whangbo J., McCrossan G., Sanborn K.B., Basar E., Walch M., Lieberman J. Apoptosis triggers specific, rapid, and global mRNA decay with 3′ uridylated intermediates degraded by DIS3L2. Cell Rep. 2015;11:1079–1089. doi: 10.1016/j.celrep.2015.04.026. [DOI] [PMC free article] [PubMed] [Google Scholar]
- Thomson J.A., Itskovitz-Eldor J., Shapiro S.S., Waknitz M.A., Swiergiel J.J., Marshall V.S., Jones J.M. Embryonic stem cell lines derived from human blastocysts. Science. 1998;282:1145–1147. doi: 10.1126/science.282.5391.1145. [DOI] [PubMed] [Google Scholar]
- Thornton J.E., Du P., Jing L., Sjekloca L., Lin S., Grossi E., Sliz P., Zon L.I., Gregory R.I. Selective microRNA uridylation by Zcchc6 (TUT7) and Zcchc11 (TUT4) Nucleic Acids Res. 2014;42:11777–11791. doi: 10.1093/nar/gku805. [DOI] [PMC free article] [PubMed] [Google Scholar]
- Ustianenko D., Pasulka J., Feketova Z., Bednarik L., Zigackova D., Fortova A., Zavolan M., Vanacova S. TUT-DIS3L2 is a mammalian surveillance pathway for aberrant structured non-coding RNAs. EMBO J. 2016;35:2179–2191. doi: 10.15252/embj.201694857. [DOI] [PMC free article] [PubMed] [Google Scholar]
- Warkocki Z., Odenwälder P., Schmitzová J., Platzmann F., Stark H., Urlaub H., Ficner R., Fabrizio P., Lührmann R. Reconstitution of both steps of Saccharomyces cerevisiae splicing with purified spliceosomal components. Nat. Struct. Mol. Biol. 2009;16:1237–1243. doi: 10.1038/nsmb.1729. [DOI] [PubMed] [Google Scholar]
- Wei W., Gilbert N., Ooi S.L., Lawler J.F., Ostertag E.M., Kazazian H.H., Boeke J.D., Moran J.V. Human L1 retrotransposition: cis preference versus trans complementation. Mol. Cell. Biol. 2001;21:1429–1439. doi: 10.1128/MCB.21.4.1429-1439.2001. [DOI] [PMC free article] [PubMed] [Google Scholar]
- Yang F., Wang P.J. Multiple LINEs of retrotransposon silencing mechanisms in the mammalian germline. Semin. Cell Dev. Biol. 2016;59:118–125. doi: 10.1016/j.semcdb.2016.03.001. [DOI] [PMC free article] [PubMed] [Google Scholar]
Associated Data
This section collects any data citations, data availability statements, or supplementary materials included in this article.
Supplementary Materials
List of DNA oligonucleotides (adaptor, primers and spike-ins) used in preparation of 3′ RACE-seq libraries. Given are names of the oligonucleotides, their sequences and what they were used for.
3′ RACE-seq analysis of the 3′ ends of endogenous and reporter L1 and control mRNAs. Following data are provided: (i) internal reference number; (ii) experimental condition where: “proteinnameKD” denotes knock down of the protein; “protein name” denotes overexpression of the protein; “NT” denotes no transfection; (iii) number of the biological replicate; (iv) cell line; (v) name of the primer used in 3′ RACE-seq amplification; (vi) analyzed mRNA species; (vii) localization where: “total” denotes whole cell; “CYTO” denotes cytoplasmic fraction after cell fractionation; “NUC” denotes” nuclear fraction after cell fractionation; (viii) identifier of the sequencing run; (ix) status of uridylation where: “FALSE” denotes non-uridylated mRNAs and “TRUE” denotes uridylated mRNAs; (x) number of sequenced and analyzed reads, (xi) mean number of As in A-tails (nucleotides); (xii) mean number of As in AU-tails (nucleotides); (xiii) mean number of Us in AU-tails (nucleotides); (xiv) mean number of Us in U-tails (nucleotides).
Analysis of the mass spectrometry results of the L1-ORF1p-FLAG co-IP and its relevant control performed using MaxQuant software. Only proteins specifically enriched in the L1-ORF1p-FLAG co-IP and not identified in the control co-IP are included.
Analysis of the expression of L1s in cells overexpressing TUT4, TUT7 or MOV10. Sequencing reads were mapped against the human genome (ver. hg38) using STAR and counted using TEtranscripts for repetitive elements quantification. Differential expression analysis was done using DESeq2. Table shows Log2 Fold Change and adjusted p values (padj) of each of LINE class included in the analysis for each condition tested (in relation to control samples), calculated by DEseq2.
Analysis of the L1s expression in cells depleted of TUTases and MOV10. Sequencing reads were mapped against human genome (ver. hg38) using STAR and counted using TEtranscripts for repetitive elements quantification. Differential expression analysis was done using DESeq2. Table shows Log2 Fold Change and adjusted p values (padj) of each of LINE class included in the analysis for each condition tested (in relation to control samples), calculated by DEseq2.
Analysis of the mass spectrometry results of EGFP-TUT4 and EGFP-TUT7 co-IPs (with in vivo DSP protein-protein cross-linking and without any crosslinking) and their relevant controls performed using MaxQuant software. In aggregate, following number of co-IPs for the indicated proteins were analyzed: 6 for EGFP control with DSP crosslinking, 6 for EGFP-TUT4 with DSP cross-linking, 7 for EGFP-TUT7 with DSP cross-linking, 6 for control EGFP/HEK293 FLP-IN T-Rex, 7 for EGFP-TUT4, 3 for EGFP-TUT7. Color-coded columns show: (i) normalized mean intensities divided by the detected protein molecular mass, (ii) specificities (i.e., quotient of normalized mean intensities divided by the proteins’ molecular mass in test and control co-IPs). Further, columns show how many times a protein was detected in the indicated sets of co-IPs. The remaining columns are parameters returned by the MaxQuant software as described in its on-line manual and Cox and Mann, 2008. The header of each column is presented in the following manner X Y_(Z)_S_(W)_L where X specifies the MaxQuant parameter, and Y_(Z)_S_(W)_L specify the co-IP conditions in the following order: Y – protein, Z – “DSP” indicates DSP cross-linking, not indicated if not applicable, S – NaCl concentration in mM, W – “RN” indicates inclusion of RNase A in the co-IP, not indicated if not applicable, L – the biological replicate within a series.
Analysis of the mass spectrometry results of EGFP-MOV10 co-IPs (with in vivo DSP protein-protein cross-linking and without any crosslinking) and their relevant controls performed using MaxQuant software. In aggregate, following number of co-IPs for the indicated proteins were analyzed: 5 for EGFP control with DSP crosslinking, 7 for EGFP-MOV10 with DSP cross-linking. Color-coded columns show: (i) normalized mean intensities divided by the detected protein molecular mass, (ii) specificities (i.e., quotient of normalized mean intensities divided by the detected protein molecular mass in test and control co-IPs). Further, columns show how many times a protein was detected in the indicated sets of co-IPs. The remaining columns are parameters returned by the MaxQuant software as described in its on-line manual and Cox and Mann, 2008. The header of each column is presented in the following manner X Y_(Z)_S_(W)_L where X specifies the MaxQuant parameter, and Y_(Z)_L the co-IP conditions in the following order: Y – protein, Z – “DSP” indicates DSP cross-linking, not indicated if not applicable, L – the biological replicate within a series. All co-IPs were done with addition of RNase A, followed by washing with buffer containing 500 mM NaCl.