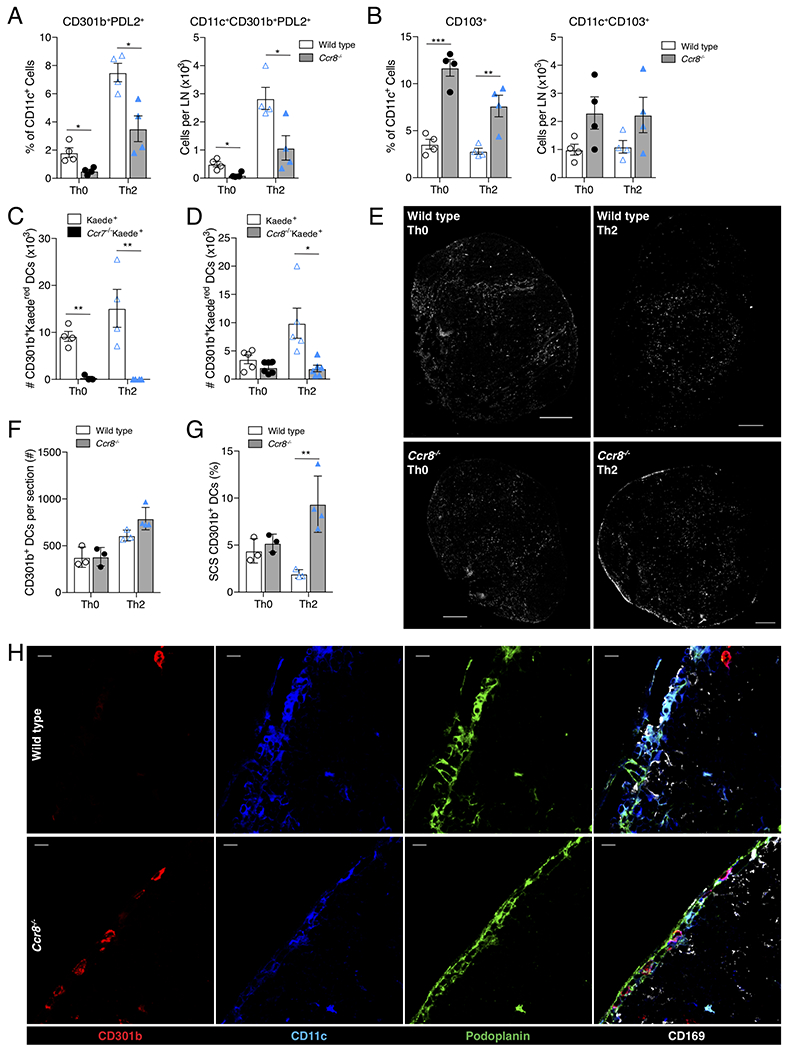
Figure 3: CCR8 is required for CD301b+ DC entry into the dLN.

(A) Quantification of CD301b+PDL2+ DCs and (B) CD103+ DCs in the dLN of Th0 or Th2 immunized WT (clear bars) or Ccr8−/− (gray bars) mice as determined by flow cytometry. Percentages reflect percent of CD301b+PDL2+ or CD103+ out of total CD11c+ cells, numbers reflect total cells per popliteal LN. (C & D) Flow cytometry of inguinal LNs was performed 24 hrs after immunization of photoconverted flank skin of Kaede+ transgenic mice. (C) Total CD11c+CD301b+Kaedered (i.e., photoconverted) cells per inguinal LN are shown in comparison to Ccr7−/−Kaede+ and (D) Ccr8−/−Kaede+ groups. (E) CD301b staining (white) of whole popliteal LNs of WT or Ccr8−/− mice 24 hrs after Th0 or Th2 immunization. Scale bar indicates 200μm. (F) Quantification of total number CD11c+CD301b+ cells per entire LN section or (G) percent of total CD11c+CD301b+ within the SCS (identified by podoplanin and CD169 immunohistochemical staining) 24 hrs after immunization. (H) CD301b+ DCs within the SCS space of Ccr8−/− mice, but not WT mice, 24 hrs after Th2 immunization. Panels show single stains of CD301b (red), CD11c (blue), podoplanin (green), and overlay of those stains and CD169 (white). Scale bars indicate 10μm. Images (E & H) are one representative of 2-3 mice per condition and 4 independent experiments. Bar graphs represent mean value of individual mouse data points (3-6 mice per condition per experiment) taken from a representative of 3 independent experiments (A, B, D, F, G, H), or 2 independent experiments (C). Error bars represent SEM. * p<0.05, ** p<0.01, *** p<0.001, Student’s T test. See also Figure S3.
