

Abstract
Tumour-associated macrophages (TAMs) are abundant in many cancers, and often display an immune-suppressive M2-like phenotype that fosters tumour growth and promotes resistance to therapy. Yet macrophages are highly plastic and can also acquire an anti-tumourigenic M1-like phenotype. Here, we show that R848, an agonist of the toll-like receptors (TLRs) TLR7 and TLR8 identified in a morphometric-based screen, is a potent driver of the M1 phenotype in vitro and that R848-loaded β-cyclodextrin nanoparticles (CDNPs) lead to efficient drug delivery to TAMs in vivo. As a monotherapy, the administration of CDNP-R848 in multiple tumour models in mice altered the functional orientation of the tumour immune microenvironment towards an M1 phenotype, leading to controlled tumour growth and protecting the animals against tumour rechallenge. When used in combination with the immune checkpoint inhibitor anti-PD-1, we observed improved immunotherapy response rates, also in a tumour model resistant to anti-PD-1 therapy. Our findings demonstrate the ability of rationally engineered drug–nanoparticle combinations to efficiently modulate TAMs for cancer immunotherapy.
Keywords: macrophages, drug delivery, nanoparticles, imaging, cancer immunotherapy
Tumour-associated macrophages (TAMs) have recently attracted much attention, as they play key roles in tumour metastasis and therapeutic resistance. TAMs often accelerate the progression of untreated tumours1–3, influence the efficacy of anticancer drugs4–6, including checkpoint blockade immunotherapies7–9 and increased counts are associated with worse outcomes10–12. TAMs are considerably plastic and assume opposing phenotypes and functions that can be either tumour-supportive (e.g., M2-like cells) or tumouricidal (e.g., M1-like cells)13–15. In most tumours, the tumour-supportive M2 phenotype prevails, and efforts have been underway to either deplete M2 cells or convert (i.e., re-educate) the phenotype into tumouricidal M1 cells. There has been intense interest in the latter strategy, exploiting the use of small molecules to inhibit receptors16,17, tyrosine kinases18, or other transduction pathways in TAMs. Despite early preclinical studies16 and ongoing clinical trials, hurdles remain for developing new therapeutics that can overcome some of the limitations of current immunotherapy. Specific limitations include i) a deficient understanding of which small molecules most efficiently impact M2→M1 phenotypic conversion, ii) inadequate ability to preferentially deliver small molecules to TAMs in vivo and iii) resulting sub-optimal therapeutic efficacy.
To address these challenges, we set out to develop a high throughput and low cost phenotypic screening assay to directly compare the efficiency with which different small molecules re-educate M2-like macrophages into M1-like cells. We furthermore hypothesized that the drugs emerging from this screen could be delivered to TAMs more efficiently in vivo when encapsulated in nanotherapeutic formulations, as nanoparticles are often rapidly internalized by macrophages19,20. Systemic therapy using such an approach would be particularly useful in treating surgically inaccessible tumours, where intratumoural injections are not feasible. The kinetics and TAM-associated distribution of many nanoformulations, including modified dextrans21, copolymers22, and liposomes23 have been demonstrated using intravital microscopy; however, we found many of these materials to have only modest capacity for incorporation of small molecule TAM modifying agents. Thus, we sought to capitalize on the use of β-cyclodextrin (CD) as a supramolecular drug reservoir. CD has an extensive history in industrial and pharmaceutical applications and an established safety profile24,25; importantly, cyclodextrins are able to form water-soluble inclusion complexes with many poorly soluble drugs, enabling drug solubilization by hydrophilic modified cyclodextrins as well as affinity-based drug delivery when formulated into nanoparticles, surface coatings, or bulk materials26–28. We therefore hypothesized that covalent crosslinking of CD would enable formation of cyclodextrin nanoparticles (CDNPs) with macrophage affinity and high drug-loading capacity. Using different mouse and tumour models that allowed direct visualization of TAM subsets in vivo, we demonstrate the ability to leverage macrophage affinity for drug-loaded nanoparticles to achieve efficient TAM delivery, preferentially alter myeloid phenotype, and subsequently improve immunotherapy response including through cooperation with checkpoint therapy, which resulted in remarkable anti-cancer efficacy.
RESULTS
Development of a morphometric polarization screen
The tumour microenvironment (TME, Fig. 1a) is home to diverse host cell types. Tumour-associated macrophages (TAMs) often represent a dominant proportion of the immune cell infiltrate21, and a continuum of macrophage phenotypes exist that can be challenging to fully recapitulate in vitro. TAMs predominantly assume a tumour supportive M2-like signature that includes the expression of mannose receptor-1 (MRC1) and the metabolic checkpoint enzyme arginase-1 (ARG1), which are induced by IL-4 treatment (Fig. 1b). In contrast, classically activated (M1-like, LPS and IFN-γ treated) cells are characterized by the expression of nitric oxide synthase (NOS2) and interleukin 12 (IL12) (Fig. 1b)29,30. This dichotomy provides a simplified, tractable model for in vitro examination of macrophage state. Consistent with previous observations in both murine31 and human macrophages32, we observed that macrophage polarization states demonstrate hallmark morphology (Fig. 1b), including elongated projections for M2-like cells as opposed to a round and flattened morphology for their M1-like counterparts. Despite these characterizations, macrophage populations exhibit significant heterogeneity, limiting population-based analysis33. We therefore set out to develop a single-cell analysis method for morphometric determination of polarization, enabling high-content screening (HCS) for macrophage polarizing agents. Murine, rather than human, macrophages were initially examined to provide a closed loop for follow-up in vitro and in vivo studies.
Figure 1. Proposed strategy for high-content screening the therapeutic re-education macrophages.
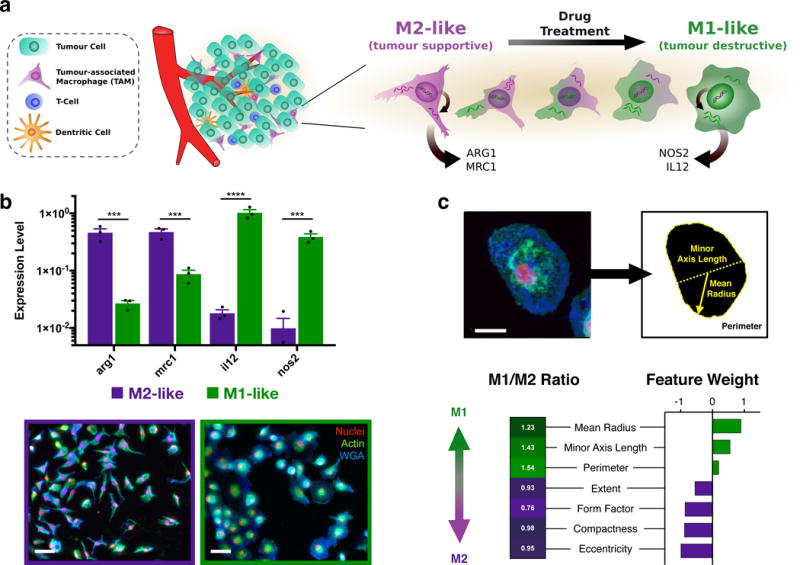
a, Schematic overview of the tumour microenvironment in which abundant tumour associated macrophages (TAMs) are canonically M2-like (tumour supportive), but exhibit a range of behavior which may be pharmacologically influenced. b, Gene expression of M2-like (IL-4 treated) and M1-like (LPS/INFγ treated) murine macrophages (top). Data represent mean ± s.e.m. of fold change relative to hprt, N=3 independent replicates from a single experiment. ***P<0.0005, ****P<0.00001 (two-way ANOVA, Fisher LSD). Gross observation of cell shape (bottom) for M2- and M1-like polarization states in murine macrophages. Scale bar: 50 μm. c, Raw images were processed by automated segmentation (top), allowing measurement of prominent features (indicated, yellow) useful in identification of M1-like polarization which include the mean radius (solid line), minor axis length (dotted line), and perimeter (dashed line). Cells are stained for nuclei (DAPI, red), actin (phalloidin, green), and cell membrane (WGA, blue). Scale bar: 25 μm. Morphological phenotyping was conducted by random forest assignment of cells to an M1- or M2-like state, where feature weights determined are reflective of the relative differences in M1-like and M2-like training sets. For the complete CellProfiler Pipeline and complete definition of cell shape features examined, please refer to Supplementary Table S1.
Cell morphology has recently been highlighted as a robust integrated biomarker of cell function,33,34. Our methodology leverages high-content image analysis via computational automated segmentation35 to extract features of single cells such as cellular radius, axis lengths, compactness, and eccentricity which are strongly associated with the polarization state (Fig. 1c, Supplementary Table S1). Subsequent analysis utilized unbiased classification of polarization phenotypes36, where computationally assigned shape-feature weights were determined from supervised training data sets (Supplementary Figure S1) and reflected the relative changes in cell-shape features between M1- and M2-like polarization states (Fig. 1c). The proportional increase in M1-like cells within the examined population is expressed simply as M1 enrichment.
Morphometric HCS identifies re-polarizing drugs
Having established a HCS for examination of cell state, we next sought to identify drugs capable of macrophage re-education. A panel of 38 drugs was curated from the literature, representing specific drugs or drug classes which have been implicated in macrophage polarization (Fig. 2a, Supplementary Table S2). Freshly isolated murine monocytes were differentiated into an M2-like phenotype, followed by drug treatment spanning six orders of magnitude in drug concentration.
Figure 2. In vitro assessment of macrophage phenotype.
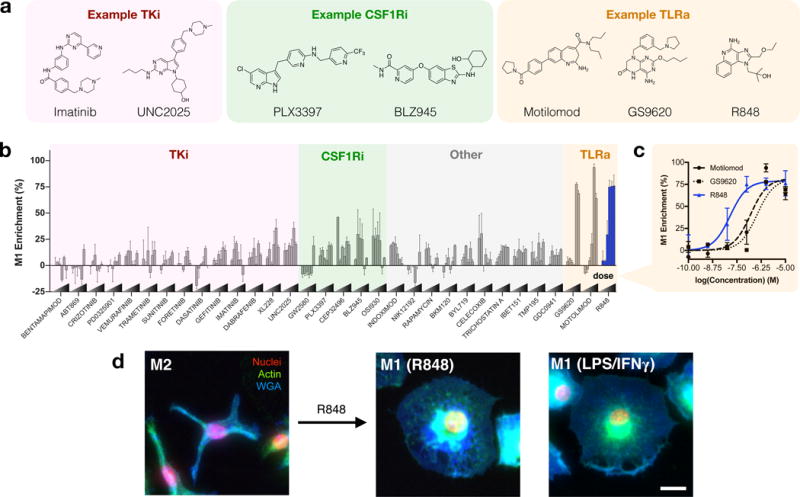
a, General classification and examples of drugs of interest, including tyrosine kinase inhibitors (TKi), colony-stimulating factor 1 receptor inhibitors (CSF1Ri), and toll-like receptor agonists (TLRa). b, Morphological determination of M1 enrichment of murine macrophages in response to drug treatment at variable concentrations. For a complete listing of compounds screened, drug targets, and concentration ranges, please refer to Supplementary Table S2. c, Dose response of M1 enrichment in response to TLR agonists. Data represent the mean ± range of N=2 independent experiments, each examining n>100 cells per condition. d, Representative images (N=4 independent experiments) of M2-like murine macrophages and subsequent re-education by R848 (48 hours, 100nM). Right: M1-like (LPS/IFN-γ treated) cell, provided for comparison. Cells are stained for nuclei (DAPI, red), actin (phalloidin, green), and cell membrane (WGA, blue). Scale bar: 25 μm.
Morphometric analysis readily stratified drug activity (Fig. 2b). Macrophage colony-stimulating factor 1 receptor (CSF1R) activation is a driving signal in M2-like polarization, and experimental CSF1R inhibition is known to bias macrophage polarization in addition to altering TAM recruitment and distribution in vivo7,16,17. With the exception of GW2580, inhibitors of CSF1R demonstrated enrichment of the M1 population in a dose dependent manner (Fig. 2b). We observed similar enrichment in the M1 population with a number of tyrosine kinase inhibitors, often to a lesser degree, including for imatinib (Bcr-Abl), dabrafenib (B-raf), gefitinib (EGFR), XL228 (IGF1R), and UNC2025 (MerTK). However, the largest polarization effects were observed for agonists of the pattern recognition receptors toll-like receptor 7 and 8 (TLR7/8). Agonists including motolimod (TLR7 agonist), GS9620 (TLR8 agonist), and the TLR7/8 agonist R848 (i.e., resiquimod) yielded M1 enrichments which were as pronounced as standard M1 induction by LPS and IFN-γ. In a direct comparison of the latter three TLR agonists, R848 emerged as the most potent driver of macrophage re-education, with an EC50 of 14.1 nM, an order of magnitude improvement relative to TLR7 and TLR8 specific agonists examined (Fig. 2c). In vitro, murine macrophages re-educated by R848 closely resembled M1 controls (Fig. 2d). Activity in the nanomolar range was likewise observed for R848 by qPCR analysis of il12b, and TLR7 expression was elevated in response to R848, perhaps mechanistically explaining its strong potency (Supplementary Figure S2). A subset of drugs having a range of M1 enrichment activities were further scrutinized by qPCR analysis of representative M1-like (nos2, il12b, and cd80) and M2-like (mrc1, arg1) transcripts (Supplementary Figure S3). Strong correlation (R2 > 0.92) between transcriptional and morphological phenotypes was observed, validating the ability of M1 enrichment to predict expression of an inflammatory transcriptome. Although differences between human and murine TLR7/8 may exist, including a reduced expression and activity of TLR837,38], we observed similar results in human cells (Supplementary Figure S4).
Design of nanoparticles with drug-binding affinity and TAM avidity
In prior work, we have shown that certain dextran nanoparticles have native macrophage avidity which results in rapid, preferential distribution to TAMs relative to other cells present in the TME19,21. β-cyclodextrin (CD) shares similar chemical composition with linear dextran, suggesting potential for macrophage avidity. Moreover, host-guest inclusion by macrocycles, such as CD, is an established mechanism for drug solubilization and nanoparticle-mediated drug delivery that forgoes chemical modification of established drug compounds39,40. We therefore sought to leverage the interaction of CD with R848 to enable formation of drug-loaded nanoparticles.
Cyclodextrin nanoparticles (CDNPs) were formed through amide bond formation between succinyl-β-cyclodextrin and L-lysine under aqueous conditions (Fig. 3a). Concentration dependent studies showed that nanoparticles with a diameter of approximately 30 nm, preferable for phagocytic uptake41, were reliably synthesized overnight starting with a 3.3 %wt/vol solution of succinyl-β-cyclodextrin (Fig. 3b,c). A molar ratio of 1:2 L-lysine per succinyl group resulted in a zeta potential of −9.87 ± 0.59 mV, as compared to 1:1 molar ratio which yielded near-neutral (0.90 ± 1.90 mV) charge which is known to negatively impact macrophage phagocytosis and enhance undesirable hepatic uptake42. Thus, CDNP formed at 3.3 %wt/v with a 1:2 lysine to succinyl ratio were employed in subsequent studies. Importantly, the use of CD as a base material did not negatively impact nanoparticle phagocytosis relative to dextran-formulated controls (Supplementary Figure S5), and CD enabled drug-nanoparticle complexation (Supplementary Figure S6). Further assessment of the equilibrium binding constant (KD = 6.32 ± 0.77 mM) indicated a strong drug-nanoparticle interaction which potentiated high drug loading within the nanoparticle (10.39 ± 0.20%wt/wt at a 1.1:1 ratio of CD to R848; Fig. 3d).
Figure 3. Development and characterization of cyclodextrin nanoparticles (CDNPs).
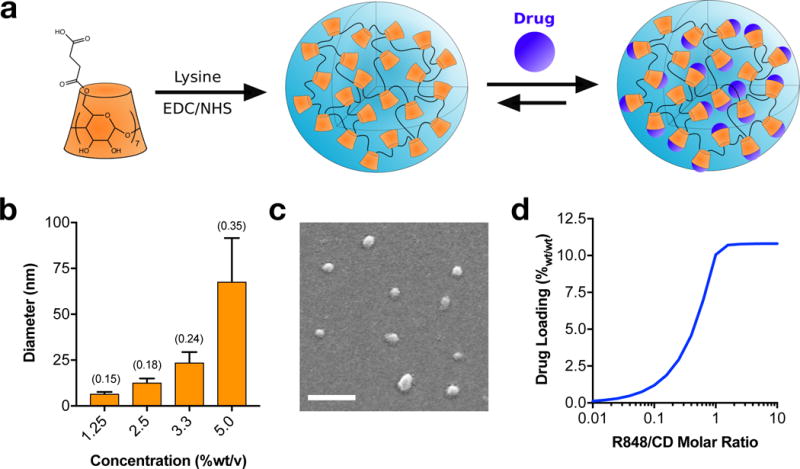
a, Schematic of cyclodextrin nanoparticle (CDNP) preparation by lysine crosslinking of succinyl-β-cyclodextrin (orange) and subsequent drug loading by guest-host complexation of R848 (blue). b, Dynamic light scattering measurement of hydrodynamic diameter, dependent on the concentration of CD in solution during crosslinking. Data represent the mean ± s.d. of a single sample (N>1000 reads); polydispersity index (PDI) is indicated in parentheses. c, Representative scanning electron microscopy images (N=3 independent samples) of CDNPs. Average diameter: 29.3 ± 1.70 nm. Scale bar: 200 nm. d, Drug loading (%wt/wt R848 relative to CDNP-R848) as a function of the molar ratio of guest-to-host. Results represent analytical estimation of the mean loading, calculated at reaction equilibrium.
Nanoparticle biodistribution and accumulation in TAM
To examine the pharmacokinetics and biodistribution of the developed CDNP, we first developed a fluorescent derivative (CDNP-VT680), where the covalently bound fluorochrome readily allows for examination in vivo by fluorescence microscopy. Systemic circulation and biodistribution were examined in an immunocompetent mouse model of colorectal cancer (MC38) in C57BL/6 mice. First, we employed time-lapse confocal fluorescence microscopy of vessels within the ear for assessment of systemic circulation, demonstrating a vascular half-life (t1/2) of 62.5 ± 4.75 min (Fig. 4a). Subsequently, organ biodistribution was examined by fluorescence reflectance imaging at 24 hours post-injection (Fig. 4b). Interestingly, CDNP accumulation was highest in tumours (94.9 ± 1.9 %ID/g tissue, 4.1 ± 1.15%ID) followed by draining lymph node (93.0 ± 6.6 %ID/g tissue). Retention in other reticuloendothelial system organs was lower than within the tumour, including in liver (78.4 ± 3.3 %ID/g tissue) and spleen (35.6 ± 3.5 %ID/g tissue; Fig. 4c). Temporal analysis (Supplementary Figure S7) demonstrated the nanoparticle accumulated in macrophage rich tissues over time.
Figure 4. In vivo biodistribution and pharmacokinetics of CDNP.
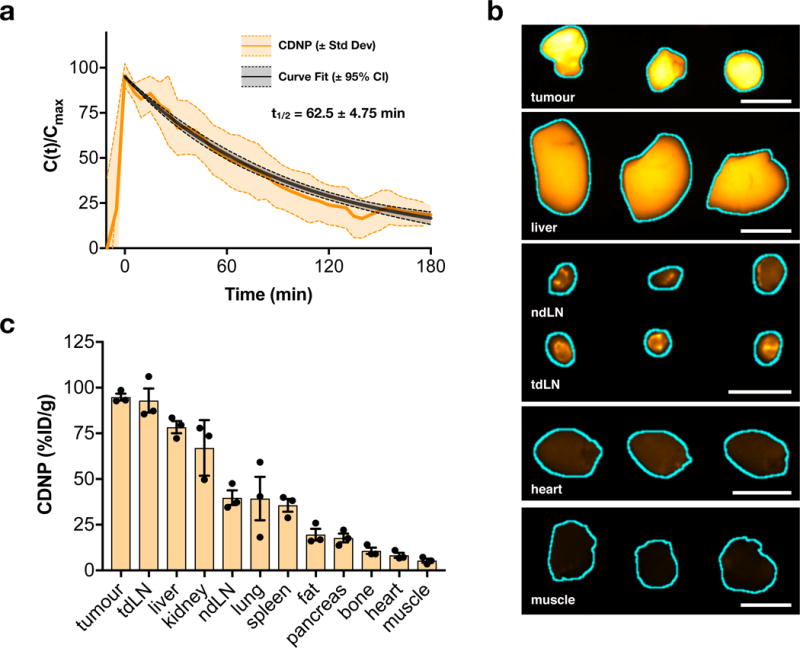
a, Nanoparticle blood half-life in MC38 tumour-bearing C57BL/6 mice, quantified by time-lapse confocal fluorescence microscopy of CDNP-VT680. Data represent mean ± s.d. (shaded), N=3 animals. b, Fluorescence reflectance imaging of CDNP-VT680 accumulation in the tumour and representative organs at 24 hours following administration (λex = 620-650 nm, λem = 680-710 nm; N=3 animals from a single experiment). Tissues are outlined (cyan) for clarity. Scale bars: 5.0 mm. c, Corresponding quantified biodistribution of CDNP-VT680. Data are presented as mean ± s.e.m., N=3 animals.
To further interrogate the intratumoural kinetics and cellular distribution of the CDNP, we employed a dorsal window chamber setup for intravital imaging43,44. Tumours were generated by inoculation with 1×10⁶ MC38-H2B-mApple cells, allowing identification of tumour cells. To enable identification of TAMs, we utilized a recently described reporter mouse wherein TAMs are readily detectable through MerTKGFP/+ expression45. In following intravenous administration of CDNP-VT680 by time lapse microscopy, we observed its rapid vascular distribution adjacent to and throughout the tumour (Fig. 5a) and accumulation within GFP+ perivascular macrophages within 60 minutes (Fig. 5b, Supplementary Movie S1), demonstrating nanoparticle accumulation in TAMs to be the primary mode of uptake as opposed to intratumoural migration of CDNP loaded monocytes from the vasculature. At 24 hours following administration, CDNPs were cleared from the vasculature and had accumulated within TAMs throughout the tumour (Fig. 5c,d). When macrophage uptake was compared across tissues, it was highest in tumours on a per cell basis (Supplementary Figure S8). Moreover, CDNP accumulation was dominated by macrophages in the TME, relative to other immune cell types, and accumulation in tumour cells was not observed (Supplementary Figure S9).
Figure 5. Uptake of CDNPs by tumour associated macrophages.
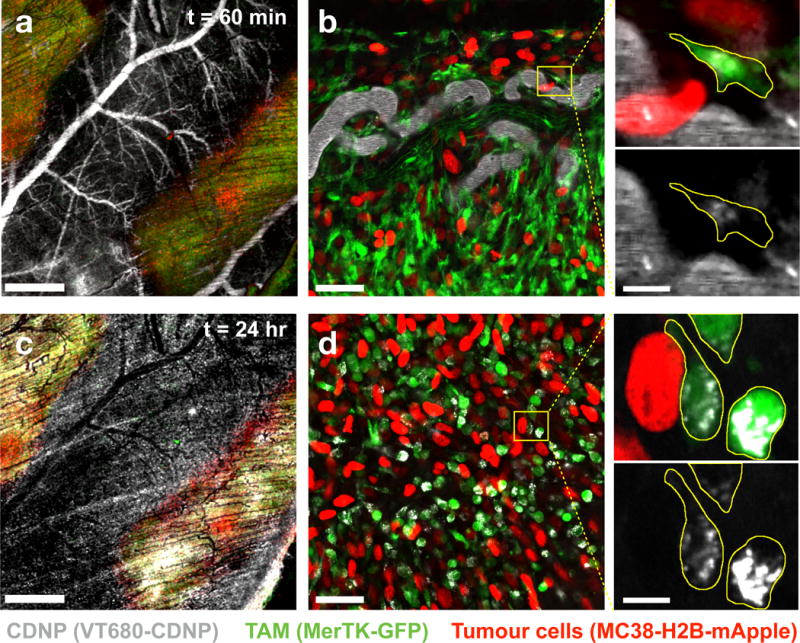
a–b, The distribution of CDNP-VT680 was examined by confocal fluorescence microscopy in MerTKGFP/+ mice bearing an MC38-H2B-mApple tumour in a dorsal window chamber model 60 min following administration. High magnification images (b, expanded) demonstrate rapid CDNP accumulation in perivascular macrophages, outlined (yellow) for clarity. c-d, 24 hours post-injection, vascular clearance is observed (c), and CDNP is well distributed to TAMs throughout the tumour site (d). Scale bars: 1.0 mm (a, c), 50 μm (b, d), and 10 μm (b,d expanded). Results are representative of observations across N=3 independent experiments.
We also examined R848 delivery to TAMs in an orthotopic lung adenocarcinoma model (eGFP expressing KrasG12D p53−/− mutant (KP) lung adenocarcinoma17,46) by concurrent imaging of CDNP-VT680 and a newly developed fluorescent drug conjugate, R848-BODIPY TMR (Supplementary Figure S10). R848 and the CDNP carrier co-localized at the subcellular level within TAMs in vivo, and a near threefold increase in local drug concentration was achieved relative to solubilized R848 alone. These results were consistent with those shown in Fig. 6 (vide infra) where we observed IL12 production from targeted macrophages.
Figure 6. Intravital re-education of tumour associated macrophages.
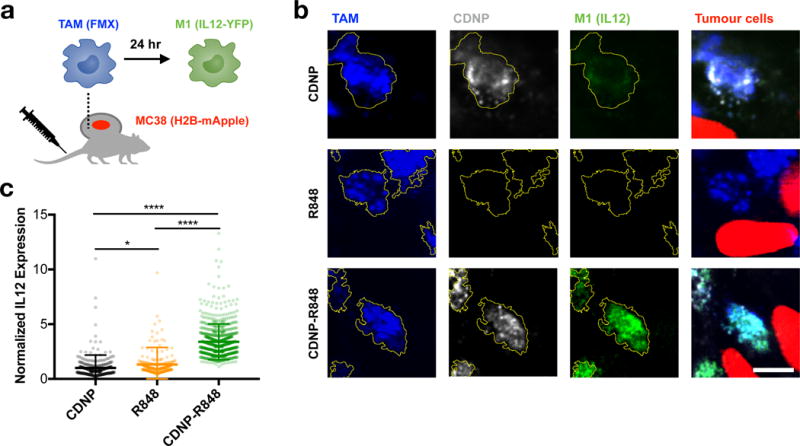
a, Diagram depicting intravital imaging of PacificBlue-ferumoxytol (FMX, blue) labeled TAMs, CDNP-VT680 (white), MC38-H2B-mApple tumour cells (red), and IL12-eYFP expression by M1 macrophages (green) performed in p40-IRES-eYFP IL12 reporter mice. b, Representative high magnification confocal fluorescence microscopy of TAMs within tumours 24 hours following administration of CDNP (top row), R848 (middle row), or CDNP-R848 (bottom row) to a single mouse for each treatment group. TAMs are outlined (yellow) for clarity. Scale bar: 10 μm. c, Quantified IL12 expression. Data represent mean ± s.d., N > 250 cells across 3 fields of view per condition. *P<0.05, ****P<0.0001 (ANOVA, Tukey HSD).
Having demonstrated the TAM uptake of CDNP and improved distribution of R848 to TAMs through nanoformulation, we sought to explore the ability of CDNP-R848 to enhance TAM re-education. In vitro, qPCR analysis demonstrated enhanced M1-like transcription in murine and human M2 macrophages re-educated by R848, which was further enhanced by CDNP-R848, while the CDNP alone elicited no response (Supplementary Figure S11). Though, in vitro models of murine or human macrophage polarization do not fully represent the immunosuppressive TAM phenotype which may only be accurately achieved within the in vivo tumour environment. We therefore explored the pharmacodynamics of M1 induction in vivo by employing an IL12-eYFP reporter mouse in which TAMs co-express YFP with the prototypical M1 marker IL12-p40 (Fig. 6a). CDNP alone (without R848) accumulated in TAMs but did not elicit an IL12 response, and R848 itself also failed to elicit a robust IL12 response in vivo. In contrast, CDNP-R848, which showed potent accumulation in TAMs, induced a robust IL12 response (Fig. 6b,c). Flow cytometry of tumour tissue independently confirmed IL12 induction by CDNP-R848, and this response was correlated with nanoparticle uptake by TAMs (Supplementary Figure S12). R848 and similar TLR agonists have demonstrated some degree of efficacy as vaccine adjuvants and cancer therapeutics47,48; though, as of recent review, these approaches have been clinically hindered by poor bioavailability49. The unique distribution of CDNP-R848 to TAMs is a promising methodology to overcome the challenge to clinical translation, as we have directly observed that TAM targeted CDNPs increase the delivery of R848 to TAMs and this is correlated with improved re-education of macrophages within the tumour microenvironment.
Therapeutic efficacy
Having shown that CDNP-R848 elicited TAM re-education in vivo, we set out to determine the agent’s therapeutic efficacy. CDNP by itself did not have an effect on MC38 tumour growth relative to control animals (Fig. 7a), which was independently confirmed by proliferation assays in cell culture (Supplementary Figure S13). When given repeatedly in the free drug form, the small molecule R848 provided marginal benefits in terms of tumour control (Fig. 7a), not attributable to direct effects on tumour cell proliferation (Supplementary Figure S13). CDNP-R848 treated mice showed noticeably smaller tumours than in any other repeated treatment group, reduced tumour growth rates, and improved survival (Fig. 7a-c). As a single dosage of CDNP-R848 was observed to re-educate TAM phenotype in vivo (Fig. 6), resulting in observation of tumour regression for CDNP-R848 treatment (Supplementary Figure S14), we repeated the tumour growth experiments using single dosage of free or nano-encapsulated R848 and found CDNP assisted delivery of R848 to significantly improve therapeutic response (Fig. 7d, Supplementary Figure S15). However, CD8+ T cell depletion (Supplementary Figure S16) mitigated the effects of CDNP-R848 on tumour growth. Given the productive diversion of TAMs from immune-suppressive to immune-supportive phenotypes and the demonstrated involvement of adaptive immunity through T cell involvement, we reasoned that CDNP-R848 monotherapy could potentiate checkpoint blockade. Combination of CDNP-R848 with anti-PD-1 was synergistic and resulted in tumour shrinkage, stabilization and homogenization of response (Fig. 7e, Supplementary Figures S17, S18). Complete tumour regression was observed in 2/7 tumors, and animals cured in the course of treatment resisted secondary tumour challenge, further indicating that the treatment had triggered anti-tumour memory.
Figure 7. Therapeutic efficacy.
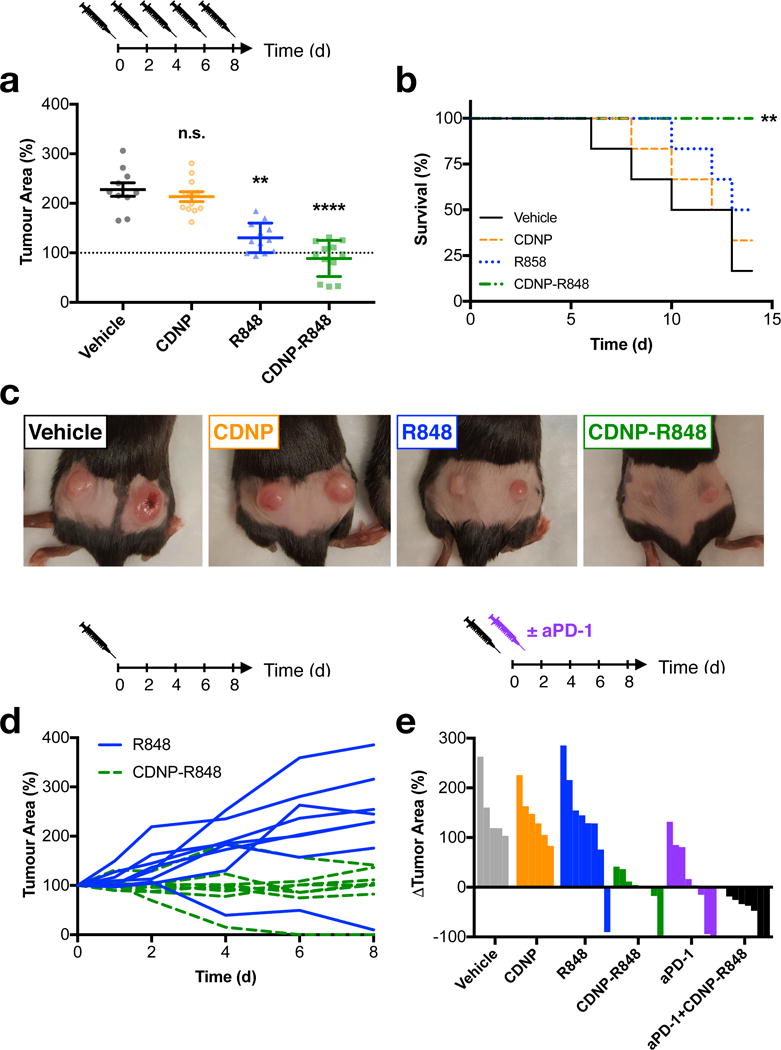
a-c, Efficacy of repeated dosing regimen. a, Tumour area at day 8 following the start of treatment. Data are expressed as mean ± s.e.m; N=12 tumours; **P=0.0017, ****P<0.0001 (Dunn’s multiple comparison) relative to vehicle control. b, Survival following start of treatment. **P=0.005 (Log-rank test, two-sided) relative to vehicle controls; N=6 animals. c, Macroscopic images of tumours at day 8 following initiation of treatment, representative of N= 6 mice per group. d, Individual tumour growth curves for mice treated with a single dose of R848 or CDNP-R848. e, Change in individual tumour area at day 8 following treatment with a single dose of CDNP, CDNP-R848, aPD-1 or the combination therapy. All studies were executed in C57BL/6 mice, and treatment was initiated when tumours reached an area of 25 mm2 (approximately 100 mm3).
Similar combinatorial efficacy was observed in B16.F10 melanoma (Supplementary Figure S19), which is otherwise unresponsive to anti-PD-1 treatment, indicating the nanotherapeutic treatment can sensitize the tumour environment toward effective combination therapy, which is a major focus of ongoing clinical trials50. These results support the combination of immunotherapies that rationally target both innate and adaptive immune components to improve therapeutic efficacy.
DISCUSSION
Immune cells play a critical role in regulating tumour growth and can potentially be harnessed for therapy. For example, immunotherapies targeting T cell immune functions are beginning to show impressive survival benefits51. Furthermore, considering that the TME is home to diverse host cell types and that current immunotherapies only benefit a minority of patients, it is critical to consider other cell types as additional therapeutic targets. TAMs have recently attracted much attention as they frequently emerge as abundant immune cells in the tumour stroma in a broad range of cancers, and high abundance of these cells is often associated with poor clinical outcome10–12.
TAM targeted therapies have primarily sought to deplete TAM populations. For example, several small molecule and antibody drugs have been developed to antagonize C-C chemokine receptor-type 2 (CCR2) or colony-stimulating factor-1 receptor (CSF1R, also called MCSF-R) signaling6, as these pathways are involved in local recruitment and maintenance of the TAM population52,53. These and other strategies have shown promise in that they can delay tumour progression in animal studies, and are currently being evaluated in the clinic.
However, experimental studies have also shown that TAM depletion may not suffice to trigger durable anti-cancer response. An alternative therapeutic approach consists of re-educating these cells5,6,54. Re-education strategies offer the possibility to not only abolish phagocytes’ tumour-supportive functions but also to actively promote their anti-tumour immune actions and could thus be more efficacious when combined with immune checkpoint blocking therapies. Several approaches have been proposed to re-educate TAM populations. For example, it was found in a mouse model of glioblastoma that a CSF1R small molecule inhibitor did not ablate TAMs but instead altered their polarization and substantially controlled tumour progression16. Similar observations have recently been made for the class IIa HDAC inhibitor TMP195, among others55,56. Despite these observations, significant challenges remain in the development of TAM re-education therapies; these challenges are two-fold and include the ability to preferentially deliver therapeutics to TAMs as well as the identification of therapeutics which drive re-education with high potency.
Here, we leveraged sugar polymers for systemic TAM targeting given the extensive research into these materials, which has demonstrated their general safety19,57, biocompatibility, and biodegradation58. We initially considered dextrans for TAM targeting based on our own work19,21,23 and that of others59 but low loading efficiencies led us to explore alternatives. Here, we demonstrated that engineered β-cyclodextrin nanoparticles similarly display high TAM affinity in vivo while perpetuating a considerable loading efficiency of small molecule payloads. These features are due to the unique composition of the nanoparticles developed herein, where base components (e.g., L-lysine and cyclodextrin) are recognized by the FDA as safe for medical use. Moreover, the facile nanoparticle formulation yielded optimal properties for systemic delivery (e.g., hydrodynamic radius and zeta potential) resulting in 4.1 ± 1.2% of the injected dose being delivered to a solitary tumour, as compared to a modest 0.7% median for conventional nanoparticle preparations60. We also attained a higher cyclodextrin content (78%wt/wt) than conventional approaches to cyclodextrin-mediated drug delivery, such as post-modification of existing nanoparticles39. These properties, in conjunction with the demonstrated ability to alter biodistribution of encapsulated therapeutics through preferential delivery in tumour tissue, make the described nanoparticles a useful system for the in vivo delivery of TAM-targeted therapeutics.
We found that the drugs most efficient at re-educating TAM in vitro were TLR7/8 agonists. We examined GS9620 (TLR7 agonist), motolimod (TLR8 agonist), and R848 (dual TLR7/8 agonist) based on their approval or prior use in a clinical setting. These drugs and related analogues have been used for topical treatment of cutaneous cancers (e.g. resiquimod, Aldara)37 or for intratumoural injections61 and can trigger tumour infiltration by T cells62–64. These studies indicate the effectiveness of TLR7/8 agonists in humans. Accordingly, we observed anti-tumour effects in mice that are consistent with involvement of adaptive immunity, such as i) a change in myeloid phenotype, including IL-12 production that can drive Th1 responses, ii) an anti-tumour response that was blunted by CD8+ T cell depletion, and iii) long-term anti-tumour memory that resisted re-challenge. These data indicate profound anti-tumour immune effects following TAM targeting by CDNP-R848. It is also possible that the drug affects myeloid cells other than TAM, including dendritic cells. Indeed, other myeloid-targeted therapeutics have demonstrated modulation of dendritic cell homeostasis65.
Repetitive systemic administration of small molecule TLR agonists has not been pursued yet, owing to dose limiting adverse events (fever, headache) which limit clinical efficacy47,66. Instead, CDNP-R848 favors TLR agonist delivery to TAMs and alters the tumour immune microenvironment in ways that were not observed with systemic administration of the free drug. We expect that increasing target payload with nanoparticle delivery may further decrease systemic side effects, as has been seen with encapsulation of chemotherapeutic agents67,68. Furthermore, systemic TAM targeting, rather than image guided intratumoural injection, would allow applications in the metastatic setting.
In summary, we believe that the described approach of targeting the myeloid cell compartment with small molecules will be an exciting addition to cancer immunotherapy. Beyond TLR agonists, we envision the encapsulation of a variety of small molecules with effects on myeloid effector function, especially as a strategy that would be synergistic with checkpoint inhibitors.
METHODS
Materials
Unless otherwise indicated, solvents and reagents were purchased from Sigma-Aldrich and used without further purification. Water used for all experiments was purified using a MilliQ filtration system (Waters). All pharmacological drugs were purchased from reputable suppliers (Selleckchem, MedchemExpress, InvivoGen, or LC Laboratories). The Rat IgG2a kappa anti-mouse PD1 29F.1A12 clone was kindly provided by Gordon Freeman (DFCI). Ferumoxytol (AMAG Pharmaceuticals) and amino-dextran (500kDa, Thermo Fisher Scientific) used for intravital imaging, fluorescently labeled by Pacific Blue (label concentration: 40.1±2.6 nM mg−1 Dextran, 0.6 mg injected) as previously described21.
Cell models
Cells were maintained in the indicated medium at 37°C and 5% CO2 and screened regularly for mycoplasma. RAW 264.7 cells used in nanoparticle uptake assays were sourced from ATCC and maintained in Dulbecco’s Modified Eagles Medium (DMEM, Invitrogen) supplemented with 10% heat inactivated fetal calf serum (Atlanta Biologicals), 100 IU penicillin (Invitrogen), and 100 μg mL−1 streptomycin (Invitrogen), and 200 mM L-glutamine (Invitrogen). The MC38 mouse colon adenocarcinoma cell lines were kindly provided by Mark Smyth (QIMR Berghofer Medical Research Institute) with stable transfection of the H2B-Apple reporter as previously described to yield a MC38-H2B-mApple cell line employed in intravital microscopy studies9. KP1.9 cells were provided by Dr. A. Zippelius (University Hospital Basel, Switzerland) and transfected by eGFP as previously reported17. MC38, MC38-H2B-mApple, B16.F10, and eGFP expressing KP1.9 cells were cultured in Iscove’s DMEM supplemented with 10% FBS, 1% penicillin/streptomycin, and 1% L-glutamine. Murine bone marrow-derived macrophages (BMDMs) used in morphological and transcriptional assays for polarization were isolated and derived by adaptation of published procedures69. Briefly, bone marrow was extracted from the surgically resected femur and tibia of naive C57BL/6 mice, dissociated and passed through a 40 μm strainer, and red blood cells lysed by ammonium chloride (StemCell Tech). Resultant bone marrow cells were plated in either 24-well (Corning 3527, for PCR analysis) or optical-bottom 384-well plates (Thermo Fisher 142761, for image analysis) at 1×10⁶ cells mL−1 in Iscove’s Modified Dulbecco’s Medium supplemented with 10% heat inactivated fetal calf serum, 100 IU penicillin, 100 μg ml−1 streptomycin (Invitrogen) and 10 ng mL−1 recombinant murine M-CSF (PeproTech, 315-02); media was replenished every two days. Human macrophages used for transcriptional examination of macrophage polarization were derived from peripheral blood mononuclear cells isolated using Ficoll-Paque PLUS (GE Healthcare) gradient separation. Monocytes were enriched using the EasySep™ Human CD14 Positive Selection Kit (StemCell Technologies) and then derived in the presence of 50 ng mL−1 recombinant human M-CSF (PeproTech, 300-25). Human PBMCs were collected from healthy volunteers in compliance with the Institutional Review Board at Dana Farber Cancer Institute. Cell proliferation was assessed by PrestoBlue (Fisher) following manufacturer’s protocols.
Animal models
Animal research was conducted in compliance with the Institutional Animal Care and Use Committees at Massachusetts General Hospital (MGH). Unless otherwise stated, experiments were performed using female C57BL/6 that were 6- to 8-weeks old at the start of the experiment, and animals were sourced from The Jackson Laboratory. Intravital examination of CDNP-VT680 distribution into macrophages was examined in recently developed NOD MerTKGFP/+ mice45, crossed into NOD SCID mice (NOD.CB17-Prkdcscid/J; #001303, Jackson). Intravital examination of IL12 expression was performed using p40-IRES-eYFP IL12 reporter mice (#015864, Jackson) described previously70.
In vitro phenotyping
For morphological analysis of murine macrophages, media was replenished with M-CSF-free media on day 7 followed by drug dosing (Supplementary Table S1). After 48 hours, cells were fixed with formaldehyde (30 min, 37 °C) and stained for actin (5.0 μg mL−1 DyLight 554 Phalloidin, Cell Signaling Technology), cell membrane (5.0 μg mL−1 Alexa Fluor 647 wheat germ agglutinin, Thermo Fisher) and nuclei (DAPI, Invitrogen) for 25 min at room temperature. Plates were washed by PBS prior to imaging on a custom Olympus-based automated high-content screening microscope. Four images were acquired per well in a 2×2 grid, imported into CellProfiler (Broad Institute) for pre-processing and segmentation (Supplementary Table S2). Computational cell classification was performed in CellProfiler Analyst (Broad Institute) by random forest assignment. Training data (examples provided, Supplementary Figure S1) consisted of approximately 50 healthy cells each representing undifferentiated (M0), M1-like, or M2-like phenotypes. The fast gentle algorithm was trained on the selected cells for unsupervised determination of weights and thresholds for cell shape features. The resulting set of parameters was used to score all other images. The enrichment score71 for M1 cells was output back into the database and imported into KNIME to generate per-well and per-treatment averages.
For transcriptional analysis, derived murine macrophages were treated with 10 ng mL−1 recombinant mouse IL-4 (PeproTech 214-14) for 24 hours to induce an M2-like polarization state and subsequently dosed with fresh media supplemented by pharmacologic drugs at the prescribed concentrations. Murine macrophages treated only with IL-4 (10 ng mL−1) or LPS (100 ng mL−1) and IFN-γ (50 ng mL−1) served as internal controls for M2-like and M1-like transcription profiles, respectively. After 24 hours, RNA was isolated by standard protocols (QIAGEN 74106) and subject to reverse transcription (Thermo Fisher 4368814) and qPCR (Thermo Fisher 44-445-57) for analysis of hrpt (Mm01545399_m1), arg1 (Mm00475988_m1), mrc1 (Mm01329362_m1), cd80 (Mm00711660_m1), il12b (Mm01288989_m1), and nos2 (Mm00440502_m1). For analysis of human macrophages, cells were similarly treated and processed prior to analysis for expression of β-actin (Hs01060665_g1) and il12b (Hs01011518_m1). Data are presented as the gene expression (fold change relative to hprt or β-actin, as indicated) or M1-likeness, calculated as described in Supplementary Figure S3.
Nanoparticle synthesis and characterization
Polyglucose (succinyl-β-cyclodextrin (CD) or 10 kDa carboxymethyl dextran (5% carboxylated, TdB), 1.0 eq. carboxylate), N-(3-Dimethylaminopropyl)-N′-ethlycarbodiimide hydrochloride (EDC, Sigma; 10.0 eq. to carboxylate), and N-hydroxysuccinimide (Sigma, 5.0 eq. to carboxylate) were combined and dissolved in MES buffer (50 mM, pH 6.0) at the desired glucose concentration (1.25 to 20.0 %wt/v). The reaction was stirred for 30 min at room temperature prior to the addition of L-lysine (0.5 eq. to carboxylate, unless otherwise noted) and overnight crosslinking. The product was recovered by addition of brine (0.05 volumetric equivalents) and precipitation from a 10-fold excess of iced ethanol. Upon re-dissolution in water, the product was concentrated by centrifugal filtration (10 kDa MWCO, Amicon), washed repeatedly by water, passed through a 0.22 μM spin filter (Costar, Spin-x), and lyophilized. The final products were re-dissolved at a concentration of 20 mg mL−1 prior to use. Particle size was calculated by dynamic light scattering (Malvern, Zetasizer APS) at a typical concentration of 5 mg mL−1 in 100 mM PBS. Zeta potential was determined at 100 μg mL−1 in 10 mM PBS (Malvern, Zetasizer ZS) following calibration measurements on manufacturer standards. For scanning electron microscopy, samples were prepared at 1.0 μg mL−1 in water, spotted on silica wafers, freeze-dried and sputter coated prior to imaging. Analysis of R848 affinity for CD was performed by a standard colorimetric competitive binding assay72. Briefly, phenolphthalein (200 mM) was freshly prepared in 125 mM carbonate buffer (pH 10.5). Decrease in absorbance at 550 nm due to nanoparticle-phenolphthalein complexation and absorbance recovery due to R848 competitive binding were measured (Tecan, Spark), and results are presented as absorbance relative to nanoparticle-free controls. The dissociation constant, KD, was determined by treatment of β-cyclodextrin by increasing concentrations of R848 and fit to a one-site competitive inhibition model in GraphPad Prism 6 (GraphPad Software, Inc.). Drug loading in CDNP-R848 was analytically determined as a function of the molar ratio of R848 to CD in the nanoparticle, assuming the appropriate reaction equilibrium for one-to-one association: KD = (R848)*(CD)/(CD-R848), where (R848) is the concentration of unbound R848, (CD) is the concentration of unbound cyclodextrin in the nanoparticle, and (CD-R848) is the concentration of R848 bound by the nanoparticle. A molar ratio of guest-to-host ranging from 0.01 to 100 was examined, and drug loading (%wt/wt) was defined as 100*(MR848/(MR848+MCDNP)), where MCDNP is the mass of nanoparticle, and MR848 is is the mass of R848 bound by cyclodextrin.
Fluorescence derivatization
For intravital imaging and assessment of biodistribution, cyclodextrin nanoparticles were fluorescently labeled. The CDNP nanoparticle was dissolved at 20 mg mL−1 in carbonate buffer (0.1 M, pH 8.5) prior to addition of VivoTag 680 XL (PerkinElmer, 1.0 mg mL−1 in anhydrous DMSO) at a final concentration of 50 μM. The reaction was allowed to proceed for 3 hours at room temperature prior to product recovery by centrifugal filtration (10 kDa MWCO, Amicon), repeated washing by water to remove unbound dye, and lyophilization. Resultant CDNP-VT680 was re-dissolved at a concentration of 10 mg mL−1. Absorption at 668 nm (Nanodrop) was used to determine the label concentration (1.79 ± 0.03 nM mg−1) by the Beer-Lambert equation, (A = εbc, where A is the absorbance, ε is the molar absorptivity 210,000 M−1cm−1, and c is the concentration).
For assessment of drug biodistribution, R848 was fluorescently labeled. R848 (7.7 mg, 25 μmol), EDC (4.7 mg, 25 μmol), N,N-diisopropylethylamine (3.2 mg, 25 μmol) and hydroxybenzotriazole (3.8 mg, 25 μmol) were dissolved in DMF (2 mL) and added to BODIPY TMR-X SE (5.0 mg, 8.2 μmol, Fisher Scientific) in a 5 mL amber tinted vial with a magnetic stir bar. The reaction was allowed to proceed for 16 hr at 50 °C with protection from light. After which, the reaction was concentrated under reduced pressure to produced a dark purple solid. The solid was suspended in the minimal amount of methanol and purified via high-performance liquid chromatography equipped with an Atlantis Prep T3 OBD 5 μm, 19 mm × 50 mm using a gradient of water (0.5% formic acid) and acetonitrile (0.5% formic acid) and collected via Waters Fraction Collector III. The fractions of similar purity were combined and concentrated to produce a dark purple solid, R848-BODIPY TMR-X (1.3 mg, 20 %), which was protected from light and stored at 4 °C. Purity of the product was determined with a high-performance liquid chromatography with a gradate of water (0.5% formic acid) and acetonitrile (0.5% formic acid) and separated with an Atlantis T3 5 μm, 4.8 mm × 50 mm and mass ions were detected on a Waters 3100 Mass Detector in positive mode. The product eluted at approximately 1.12 mins (m/z = 808.59 Da, expected 810.50 Da; Supplementary Figure S20). The purified product was dissolved in DMSO-d6 and 1H and 13C NMR spectra were recorded on a Bruker AC-400 MHz spectrometer, which were consistent with reported spectra for the parent compounds, R848 and BODIPY TMR-X.
Pharmacokinetic and biodistribution analysis
The blood half-life of CDNP-VT680 was determined in C57BL/6 mice by time-lapse confocal fluorescence microscopy of vessels in the ear during and immediately following tail vein injection of Pacific Blue Dextran and CDNP-VT680 (0.5 mg, 50 μL saline). Time-lapse images were acquired continually over the first 3 hours after CDNP-VT680 injection, after which the mice were allowed to recover before subsequent imaging at 24 hours. Across three separate animals, multiple fields of view were analyzed by identification of regions of interest within the labeled vasculature. Mean fluorescence intensity was determined as a function of time, background subtracted, and normalized to the to peak fluorescence intensity. Resulting data was fit to a mono-exponential decay in GraphPad Prism 6.
At 1, 4, and 24 hours following injection, examination of CDNP biodistribution was performed in C57BL/6 mice. Surgically resected tissues of interest were thoroughly washed in PBS, weighed, and placed in an OV110 (Olympus) for brightfield imaging to identify regions of interest and fluorescence reflectance imaging (1000 ms exposure time; λex = 620-650 nm, λem = 680-710 nm). Integrated fluorescence density was determined for ROIs representing each tissue (ImageJ, NIH). Values were background-subtracted for tissue autofluorescence by imaging of corresponding tissues from a vehicle treated control. Percentage of injected dose was determined relative to standards of CDNP-VT680 prepared in 1.0% intralipid (McKesson, 988248), to account for optical scattering of tissue73, and values are presented following normalization to tissue mass.
Intravital microscopy
Images were acquired on a FV1000MPE confocal imaging system (Olympus). Pacific Blue, GFP/YFP, mApple/BODIPY TMR X, and VT680 were excited sequentially using 405-, 473-, 559-, and 635-nm diode lasers and BA430-455, BA490-540, BA575-620, and BA655-755 emission filters with SDM473, SDM560, and SDM640 beam splitters.
Intravital examination CDNP-VT680 distribution into macrophages and tumour cells was examined using dorsal skinfold window chambers installed on recently developed NOD SCID MerTKGFP/+ mice45 inoculated with MC38–H2B-mApple tumours by methods similar to those previously described9,44. Mice received CDNP-VT680 i.v. (0.5 mg, 50 μL saline) 24 hours prior to imaging. Intravital examination of IL12 expression was similarly performed using p40-IRES-eYFP IL12 reporter mice (#015864, Jackson) described previously70. Prior to imaging, mice received intravenous administration of R848 (2.0 mg kg−1), CDNP-VT680 (16.5 mg kg−1 CDNP), or CDNP-VT680 + R848 (16.5 mg kg−1 CDNP-VT680 + 2.0 mg kg−1 R848; 1/1.1 R848/CD molar ratio) each prepared in 50 μL sterile saline. IL12 expression was examined at 24 hours following treatment. In both cases, macrophages and vasculature were labeled by Pacific Blue–ferumoxytol and Pacific Blue–dextran, respectively.
Intravital examination CDNP-VT680 and R848-BODIPY TMR-X distribution to macrophages was further carried out in B57/Bl6 mice inoculated by tail vein injection of 2.5 × 10⁵ eGFP expressing KRAS/p53 mutant lung adenocarcinoma (KP1.9) cells in 100 μL PBS, similar to previous reports17. At 30 days following tumour inoculation, mice received intravenous administration of R848-BODIPY TMR X (5.0 mg kg−1) or CDNP-VT680 + R848-BODIPY TMR X (41.25 mg kg−1 CDNP-VT680 + 5.0 mg kg−1 R848-BODIPY TMR X). Macrophages were labeled by Pacific Blue–dextran, administered 24 hours prior to imaging. To harvest the lungs for the examination of bio-distribution, the mice were first anesthetized with isofluorane. A incision was made in the left ventricle of the heart. The lungs were subsequently perfused slowly (~1 mL min−1) with 10 mL of ice-cold PBS through the right ventricle17. The lungs were then harvested and mounted immediately on a confocal microscope for image acquisition.
Images were pseudo-colored and processed in FIJI (ImageJ, NIH) by adjusting brightness/contrast, creating z-projections of image stacks, and performing a rolling ball background subtraction. For quantification of IL12 expression, the sum of YFP, Pacific Blue, and VT680 channels were segmented by automated thresholding using the RenyEntropy method to generate a mask and corresponding ROIs for individual macrophages. The fluorescence intensity was determined for YFP within each ROI, and data are presented following normalization to the average intensity for CDNP control treatment. For quantification of R848-BODIPY distribution, the macrophages were identified and masked by automated thresholding of the Gaussian filtered Pacific Blue channel using the RenyEntropy method. The fluorescence intensity was determined for BODIPY within each ROI, and data are presented following background normalization.
Flow cytometry
For examination of CDNP-VT680 biodistribution in MerTKGFP/+ mice, MC38 tumours and tissues of interest were excised 10 days after tumour implantation, 24 hours after intravenous injection of CDNP-VT680 (0.5 mg). For examination of IL12 expression, MC38 tumours were harvested 9 days after intradermal implantation into IL12-eYFP mice, 24 hours following intravenous administration of R848 (2.0 mg kg−1), CDNP-VT680 (16.5 mg kg−1 CDNP), or CDNP-VT680 + R848 (16.5 mg kg−1 CDNP-VT680 + 2.0 mg kg−1 R848; 1/1.1 R848/CD molar ratio) in 50 μL saline. Tissues were minced, incubated in RPMI containing 0.2 mg mL−1 collagenase I (Worthington Biochemical) for 30 min at 37°C and then passed through a 40 μm filter. Red blood cells were lysed using ACK lysis buffer (Thermo Fisher Scientific) prior to pre-treatment with low affinity Fc receptor blocking reagent (TruStain FcX anti-CD16/32 clone 93, BioLegend) and staining in phosphate buffered saline containing 0.5% BSA and 2 mM EDTA with fluorochrome labeled antibodies against CD45 (30-F11, eBioscience), CD11c (N418, BioLegend), Ly6G (1A8, Biolegend), F4/80 (BM8, BioLegend), and 7-AAD. Samples were run on a LSR II flow cytometer (BD) and analyzed in FlowJo v.8.8.7 (Tree Star, Inc.) to identify macrophages (CD45+Ly6G-F4/80+) in IL12-eYFP mice as well as macrophages (CD45+MerTK+Ly6G-), neutrophils (CD45+MerTK-Ly6G+), and other immune cells (CD45+) in MerTKGFP/+ mice. Identically treated tissue from MC38 tumours grown in wild type C57BL/6 mice served as a control for thresholding cutoffs for IL12+ and CDNP-VT680+ cells in analysis of IL12-eYFP induction.
Tumour growth models
Tumour growth studies were initiated in C57BL/6 mice by intradermal injection of 2×10⁶ MC38 cells or 0.5×10⁶ B16.F10 cells suspended in 50 μL of PBS. Tumours were allowed to grow to an established size of 25 mm2 (100 mm3) at which time treatment cohorts were assigned such that tumour size and body weight were normalized across groups at baseline. For repeated dosing experiments, animals were treated 3 times weekly by i.v. administration of R848 (2.0 mg kg−1), CDNP (16.5 mg kg−1), or CDNP (16.5 mg kg−1) with R848 (2.0 mg kg−1) in 50 μL saline. For single dosing experiments, animals were treated by i.v. administration of R848 (3.0 mg kg−1), CDNP (24.6 mg kg−1), or equivalent dosing of CDNP (24.6 mg kg−1) with R848 (3.0 mg kg−1) in saline. For aPD-1 treatment, the 29F.1.A12 aPD-1 clone was administered at a dose of 200 μg by intraperitoneal injection. In the case of CD8+ T cell depletion, 200 μg of anti-mouse CD8 antibody (BioXcell, clone 53-6.72) was administered every 3 days. At set time points, tumour growth was assessed by caliper measurement (A = length × width) and values are reported following normalization to area at the time treatment was initiated.
Statistical analysis
Data are presented as mean ± standard error unless otherwise indicated. Statistical analyses were performed using GraphPad Prism 6 (GraphPad Software Inc.). Statistical significance was determined by analysis of variance, using repeated measures where appropriate, in conjunction with post hoc Tukeys HSD. For in vivo studies of tumour growth, temporal comparisons were made by Friedmans test and comparison at set time points were performed by Kruskal-Wallis, each using post hoc Dunn’s test for multiple comparisons. Survival analysis was performed by log-rank test. Significance was determined at P < 0.05.
Data availability
The data supporting the findings of this study are available within the paper and its Supplementary Information. Data acquired in the course of this study are available from the corresponding author upon reasonable request.
Supplementary Material
Acknowledgments
Part of this work was supported in part by grants from the US National Institutes of Health (NIH T32CA079443; R01CA206890; U01CA206997; R01HL131495). We thank Drs. Hyungsoon Im, Angela Magnuson and Miles Miller for assistance with some of the experiments and Greg Wojtkiewicz and Mark Prytyskach for technical help. Our special thanks go to Drs. Christophe Benoist and Diane Mathis for critical review of the data, helpful suggestions and general discussions. The anti-PD1 antibody was a kind gift from Gordon J. Freeman, DFCI.
Footnotes
Author contributions. RW and CBR conceived and designed the CDNP-drug conjugate. CBR, SPA, MFC, CSG, RL, MSA, and RHK performed the experiments and data analysis. CBR, SPA, MJP and RW wrote the manuscript. All authors contributed feedback on the final manuscript.
Competing interests. CBR and RW are listed on a patent filed by Partners Healthcare. The remaining authors declare no competing financial and non-financial interests.
References
- 1.Wynn TA, Chawla A, Pollard JW. Macrophage biology in development, homeostasis and disease. Nature. 2013;496:445–455. doi: 10.1038/nature12034. [DOI] [PMC free article] [PubMed] [Google Scholar]
- 2.Gabrilovich DI, Ostrand-Rosenberg S, Bronte V. Coordinated regulation of myeloid cells by tumours. Nat Rev Immunol. 2012;12:253–268. doi: 10.1038/nri3175. [DOI] [PMC free article] [PubMed] [Google Scholar]
- 3.Pittet MJ, Nahrendorf M, Swirski FK. The journey from stem cell to macrophage. Ann N Y Acad Sci. 2014;1319:1–18. doi: 10.1111/nyas.12393. [DOI] [PMC free article] [PubMed] [Google Scholar]
- 4.De Palma M, Lewis CE. Macrophage regulation of tumor responses to anticancer therapies. Cancer Cell. 2013;23:277–286. doi: 10.1016/j.ccr.2013.02.013. [DOI] [PubMed] [Google Scholar]
- 5.Mantovani A, Allavena P. The interaction of anticancer therapies with tumor-associated macrophages. J Exp Med. 2015;212:435–445. doi: 10.1084/jem.20150295. [DOI] [PMC free article] [PubMed] [Google Scholar]
- 6.Ruffell B, Coussens LM. Macrophages and therapeutic resistance in cancer. Cancer Cell. 2015;27:462–472. doi: 10.1016/j.ccell.2015.02.015. [DOI] [PMC free article] [PubMed] [Google Scholar]
- 7.Zhu Y, et al. CSF1/CSF1R blockade reprograms tumor-infiltrating macrophages and improves response to T-cell checkpoint immunotherapy in pancreatic cancer models. Cancer research. 2014;74:5057–5069. doi: 10.1158/0008-5472.CAN-13-3723. [DOI] [PMC free article] [PubMed] [Google Scholar]
- 8.Romano E, et al. Ipilimumab-dependent cell-mediated cytotoxicity of regulatory T cells ex vivo by nonclassical monocytes in melanoma patients. Proceedings of the National Academy of Sciences. 2015;112:6140–6145. doi: 10.1073/pnas.1417320112. [DOI] [PMC free article] [PubMed] [Google Scholar]
- 9.Arlauckas SP, et al. In vivo imaging reveals a tumor-associated macrophage-mediated resistance pathway in anti-PD-1 therapy. Sci Transl Med. 2017;9 doi: 10.1126/scitranslmed.aal3604. [DOI] [PMC free article] [PubMed] [Google Scholar]
- 10.Steidl C, et al. Tumor-associated macrophages and survival in classic Hodgkin’s lymphoma. N Engl J Med. 2010;362:875–885. doi: 10.1056/NEJMoa0905680. [DOI] [PMC free article] [PubMed] [Google Scholar]
- 11.Mantovani A, Allavena P, Sica A, Balkwill F. Cancer-related inflammation. Nature. 2008;454:436–444. doi: 10.1038/nature07205. [DOI] [PubMed] [Google Scholar]
- 12.Joyce JA, Pollard JW. Microenvironmental regulation of metastasis. Nat Rev Cancer. 2009;9:239–252. doi: 10.1038/nrc2618. [DOI] [PMC free article] [PubMed] [Google Scholar]
- 13.Bronte V, Murray PJ. Understanding local macrophage phenotypes in disease: modulating macrophage function to treat cancer. Nat Med. 2015;21:117–119. doi: 10.1038/nm.3794. [DOI] [PubMed] [Google Scholar]
- 14.Gordon S, Martinez FO. Alternative activation of macrophages: mechanism and functions. Immunity. 2010;32:593–604. doi: 10.1016/j.immuni.2010.05.007. [DOI] [PubMed] [Google Scholar]
- 15.Sica A, Mantovani A. Macrophage plasticity and polarization: in vivo veritas. J Clin Invest. 2012;122:787–795. doi: 10.1172/JCI59643. [DOI] [PMC free article] [PubMed] [Google Scholar]
- 16.Pyonteck SM, et al. CSF-1R inhibition alters macrophage polarization and blocks glioma progression. Nat Med. 2013;19:1264–1272. doi: 10.1038/nm.3337. [DOI] [PMC free article] [PubMed] [Google Scholar]
- 17.Cuccarese MF, et al. Heterogeneity of macrophage infiltration and therapeutic response in lung carcinoma revealed by 3D organ imaging. Nat Commun. 2017;8:14293. doi: 10.1038/ncomms14293. [DOI] [PMC free article] [PubMed] [Google Scholar]
- 18.Cook RS, et al. MerTK inhibition in tumor leukocytes decreases tumor growth and metastasis. J Clin Invest. 2013;123:3231–3242. doi: 10.1172/JCI67655. [DOI] [PMC free article] [PubMed] [Google Scholar]
- 19.Weissleder R, Nahrendorf M, Pittet MJ. Imaging macrophages with nanoparticles. Nat Mater. 2014;13:125–138. doi: 10.1038/nmat3780. [DOI] [PubMed] [Google Scholar]
- 20.Miller MA, Arlauckas SP, Weissleder R. Prediction of Anti-cancer Nanotherapy Efficacy by Imaging. Nanotheranostics. 2017;1:296–312. doi: 10.7150/ntno.20564. [DOI] [PMC free article] [PubMed] [Google Scholar]
- 21.Miller MA, et al. Predicting therapeutic nanomedicine efficacy using a companion magnetic resonance imaging nanoparticle. Sci Transl Med. 2015;7:314ra183. doi: 10.1126/scitranslmed.aac6522. [DOI] [PMC free article] [PubMed] [Google Scholar]
- 22.Miller MA, et al. Tumour-associated macrophages act as a slow-release reservoir of nano-therapeutic Pt(IV) pro-drug. Nat Commun. 2015;6:8692. doi: 10.1038/ncomms9692. [DOI] [PMC free article] [PubMed] [Google Scholar]
- 23.Miller MA, et al. Radiation therapy primes tumors for nanotherapeutic delivery via macrophage-mediated vascular bursts. Sci Transl Med. 2017;9 doi: 10.1126/scitranslmed.aal0225. [DOI] [PMC free article] [PubMed] [Google Scholar]
- 24.Szejtli J. Introduction and General Overview of Cyclodextrin Chemistry. Chem Rev. 1998;98:1743–1754. doi: 10.1021/cr970022c. [DOI] [PubMed] [Google Scholar]
- 25.Davis ME, Brewster ME. Cyclodextrin-based pharmaceutics: past, present and future. Nat Rev Drug Discov. 2004;3:1023–1035. doi: 10.1038/nrd1576. [DOI] [PubMed] [Google Scholar]
- 26.Wang NX, Recum HAV. Affinity-Based Drug Delivery. Macromolecular bioscience. 2011 doi: 10.1002/mabi.201000206. [DOI] [PubMed] [Google Scholar]
- 27.Webber MJ, Langer R. Drug delivery by supramolecular design. Chemical Society Reviews. 2017 doi: 10.1039/c7cs00391a. [DOI] [PubMed] [Google Scholar]
- 28.Mealy JE, Rodell CB, Burdick JA. Sustained small molecule delivery from injectable hyaluronic acid hydrogels through host–guest mediated retention. Journal of Materials Chemistry B. 2015;3:8010–8019. doi: 10.1039/C5TB00981B. [DOI] [PMC free article] [PubMed] [Google Scholar]
- 29.Lawrence T, Natoli G. Transcriptional regulation of macrophage polarization: enabling diversity with identity. Nat Rev Immunol. 2011;11:750–761. doi: 10.1038/nri3088. [DOI] [PubMed] [Google Scholar]
- 30.Jablonski KA, et al. Novel Markers to Delineate Murine M1 and M2 Macrophages. PLoS One. 2015;10:e0145342. doi: 10.1371/journal.pone.0145342. [DOI] [PMC free article] [PubMed] [Google Scholar]
- 31.McWhorter FY, Wang T, Nguyen P, Chung T, Liu WF. Modulation of macrophage phenotype by cell shape. Proc Natl Acad Sci U S A. 2013;110:17253–17258. doi: 10.1073/pnas.1308887110. [DOI] [PMC free article] [PubMed] [Google Scholar]
- 32.Rostam HM, Reynolds PM, Alexander MR, Gadegaard N, Ghaemmaghami AM. Image based Machine Learning for identification of macrophage subsets. Scientific reports. 2017;7:3521. doi: 10.1038/s41598-017-03780-z. [DOI] [PMC free article] [PubMed] [Google Scholar]
- 33.Marklein RA, Lam J, Guvendiren M, Sung KE, Bauer SR. Functionally-Relevant Morphological Profiling: A Tool to Assess Cellular Heterogeneity. Trends in biotechnology. 2017 doi: 10.1016/j.tibtech.2017.10.007. [DOI] [PubMed] [Google Scholar]
- 34.Phillip JM, Wu PH, Gilkes DM, Williams W, McGovern S, Daya J, Chen J, Aifuwa I, Lee JSH, Fan R, Walston J, Wirtz D. Biophysical and biomolecular determination of cellular age in humans. Nature Biomedical Engineering. 2017;1:s41551–017. doi: 10.1038/s41551-017-0093. [DOI] [PMC free article] [PubMed] [Google Scholar]
- 35.Caicedo JC, et al. Data-analysis strategies for image-based cell profiling. Nat Methods. 2017;14:849–863. doi: 10.1038/nmeth.4397. [DOI] [PMC free article] [PubMed] [Google Scholar]
- 36.Bray MA, et al. Cell Painting, a high-content image-based assay for morphological profiling using multiplexed fluorescent dyes. Nature protocols. 2016;11:1757. doi: 10.1038/nprot.2016.105. [DOI] [PMC free article] [PubMed] [Google Scholar]
- 37.Chi H, et al. Anti-tumor activity of toll-like receptor 7 agonists. Frontiers in pharmacology. 2017;8:304. doi: 10.3389/fphar.2017.00304. [DOI] [PMC free article] [PubMed] [Google Scholar]
- 38.Liu J, et al. A five-amino-acid motif in the undefined region of the TLR8 ectodomain is required for species-specific ligand recognition. Molecular immunology. 2010;47:1083–1090. doi: 10.1016/j.molimm.2009.11.003. [DOI] [PMC free article] [PubMed] [Google Scholar]
- 39.Zhang J, Ma PX. Cyclodextrin-based supramolecular systems for drug delivery: recent progress and future perspective. Advanced drug delivery reviews. 2013;65:1215–1233. doi: 10.1016/j.addr.2013.05.001. [DOI] [PMC free article] [PubMed] [Google Scholar]
- 40.Rodell CB, Mealy JE, Burdick JA. Supramolecular Guest-Host Interactions for the Preparation of Biomedical Materials. Bioconjug Chem. 2015;26:2279–2289. doi: 10.1021/acs.bioconjchem.5b00483. [DOI] [PubMed] [Google Scholar]
- 41.Behzadi S, et al. Cellular uptake of nanoparticles: journey inside the cell. Chemical Society Reviews. 2017 doi: 10.1039/c6cs00636a. [DOI] [PMC free article] [PubMed] [Google Scholar]
- 42.He C, Hu Y, Yin L, Tang C, Yin C. Effects of particle size and surface charge on cellular uptake and biodistribution of polymeric nanoparticles. Biomaterials. 2010;31:3657–3666. doi: 10.1016/j.biomaterials.2010.01.065. [DOI] [PubMed] [Google Scholar]
- 43.Dondossola E, Holzapfel BM, Alexander S. Examination of the foreign body response to biomaterials by nonlinear intravital microscopy. Nature Biomedical. 2016 doi: 10.1038/s41551-016-0007. [DOI] [PMC free article] [PubMed] [Google Scholar]
- 44.Thurber GM, et al. Single-cell and subcellular pharmacokinetic imaging allows insight into drug action in vivo. Nat Commun. 2013;4:1504. doi: 10.1038/ncomms2506. [DOI] [PMC free article] [PubMed] [Google Scholar]
- 45.Mohan JF, et al. Imaging the emergence and natural progression of spontaneous autoimmune diabetes. Proc Natl Acad Sci U S A. 2017 doi: 10.1073/pnas.1707381114. [DOI] [PMC free article] [PubMed] [Google Scholar]
- 46.Ventura A, et al. Restoration of p53 function leads to tumour regression in vivo. Nature. 2007;445:661. doi: 10.1038/nature05541. [DOI] [PubMed] [Google Scholar]
- 47.Pockros PJ, et al. Oral resiquimod in chronic HCV infection: safety and efficacy in 2 placebo-controlled, double-blind phase IIa studies. J Hepatol. 2007;47:174–182. doi: 10.1016/j.jhep.2007.02.025. [DOI] [PubMed] [Google Scholar]
- 48.Lynn GM, et al. In vivo characterization of the physicochemical properties of polymer-linked TLR agonists that enhance vaccine immunogenicity. Nature biotechnology. 2015;33:1201. doi: 10.1038/nbt.3371. [DOI] [PMC free article] [PubMed] [Google Scholar]
- 49.Engel AL, Holt GE, Lu H. The pharmacokinetics of Toll-like receptor agonists and the impact on the immune system. Expert Rev Clin Pharmacol. 2011;4:275–289. doi: 10.1586/ecp.11.5. [DOI] [PMC free article] [PubMed] [Google Scholar]
- 50.Tang J, Shalabi A, Hubbard-Lucey VM. Comprehensive analysis of the clinical immuno-oncology landscape. Annals of Oncology. 2017;29:84–91. doi: 10.1093/annonc/mdx755. [DOI] [PubMed] [Google Scholar]
- 51.Sharma P, Allison JP. The future of immune checkpoint therapy. Science. 2015;348:56–61. doi: 10.1126/science.aaa8172. [DOI] [PubMed] [Google Scholar]
- 52.Movahedi K, et al. Different tumor microenvironments contain functionally distinct subsets of macrophages derived from Ly6C(high) monocytes. Cancer Res. 2010;70:5728–5739. doi: 10.1158/0008-5472.CAN-09-4672. [DOI] [PubMed] [Google Scholar]
- 53.Lin EY, Nguyen AV, Russell RG, Pollard JW. Colony-stimulating factor 1 promotes progression of mammary tumors to malignancy. J Exp Med. 2001;193:727–740. doi: 10.1084/jem.193.6.727. [DOI] [PMC free article] [PubMed] [Google Scholar]
- 54.Engblom C, Pfirschke C, Pittet MJ. The role of myeloid cells in cancer therapies. Nat Rev Cancer. 2016;16:447–462. doi: 10.1038/nrc.2016.54. [DOI] [PubMed] [Google Scholar]
- 55.Guerriero JL, et al. Class IIa HDAC inhibition reduces breast tumours and metastases through anti-tumour macrophages. Nature. 2017;543:428–432. doi: 10.1038/nature21409. [DOI] [PMC free article] [PubMed] [Google Scholar]
- 56.Andón FT, et al. Targeting tumor associated macrophages: The new challenge for nanomedicine. Semin Immunol. 2017 doi: 10.1016/j.smim.2017.09.004. [DOI] [PubMed] [Google Scholar]
- 57.Gaglia JL, et al. Noninvasive mapping of pancreatic inflammation in recent-onset type-1 diabetes patients. Proc Natl Acad Sci U S A. 2015;112:2139–2144. doi: 10.1073/pnas.1424993112. [DOI] [PMC free article] [PubMed] [Google Scholar]
- 58.Zhang Y, Chan JW, Moretti A, Uhrich KE. Designing polymers with sugar-based advantages for bioactive delivery applications. J Control Release. 2015;219:355–368. doi: 10.1016/j.jconrel.2015.09.053. [DOI] [PMC free article] [PubMed] [Google Scholar]
- 59.Kaittanis C, et al. Environment-responsive nanophores for therapy and treatment monitoring via molecular MRI quenching. Nat Commun. 2014;5:3384. doi: 10.1038/ncomms4384. [DOI] [PMC free article] [PubMed] [Google Scholar]
- 60.Wilhelm S, et al. Analysis of nanoparticle delivery to tumours. Nature Reviews Materials. 2016;1:16014. [Google Scholar]
- 61.Singh M, et al. Effective innate and adaptive antimelanoma immunity through localized TLR7/8 activation. J Immunol. 2014;193:4722–4731. doi: 10.4049/jimmunol.1401160. [DOI] [PMC free article] [PubMed] [Google Scholar]
- 62.Mauldin IS, et al. Topical treatment of melanoma metastases with imiquimod, plus administration of a cancer vaccine, promotes immune signatures in the metastases. Cancer Immunology, Immunotherapy. 2016;65:1201–1212. doi: 10.1007/s00262-016-1880-z. [DOI] [PMC free article] [PubMed] [Google Scholar]
- 63.Huang SJ, et al. Imiquimod enhances IFN-γ production and effector function of T cells infiltrating human squamous cell carcinomas of the skin. Journal of Investigative Dermatology. 2009;129:2676–2685. doi: 10.1038/jid.2009.151. [DOI] [PMC free article] [PubMed] [Google Scholar]
- 64.Sabado RL, et al. Resiquimod as an Immunologic Adjuvant for NY-ESO-1 Protein Vaccination in Patients with High Risk Melanoma. Cancer immunology research canimm. 2015 doi: 10.1158/2326-6066.CIR-14-0202. 0202.2014. [DOI] [PMC free article] [PubMed] [Google Scholar]
- 65.Cubillos-Ruiz JR, et al. ER stress sensor XBP1 controls anti-tumor immunity by disrupting dendritic cell homeostasis. Cell. 2015;161:1527–1538. doi: 10.1016/j.cell.2015.05.025. [DOI] [PMC free article] [PubMed] [Google Scholar]
- 66.Savage P, et al. A phase I clinical trial of imiquimod, an oral interferon inducer, administered daily. British journal of cancer. 1996;74:1482. doi: 10.1038/bjc.1996.569. [DOI] [PMC free article] [PubMed] [Google Scholar]
- 67.Shi J, Kantoff PW, Wooster R, Farokhzad OC. Cancer nanomedicine: progress, challenges and opportunities. Nat Rev Cancer. 2017;17:20–37. doi: 10.1038/nrc.2016.108. [DOI] [PMC free article] [PubMed] [Google Scholar]
- 68.Kamaly N, Yameen B, Wu J, Farokhzad OC. Degradable Controlled-Release Polymers and Polymeric Nanoparticles: Mechanisms of Controlling Drug Release. Chem Rev. 2016;116:2602–2663. doi: 10.1021/acs.chemrev.5b00346. [DOI] [PMC free article] [PubMed] [Google Scholar]
- 69.Ying W, Cheruku PS, Bazer FW, Safe SH, Zhou B. Investigation of macrophage polarization using bone marrow derived macrophages. Journal of visualized experiments: JoVE. 2013 doi: 10.3791/50323. [DOI] [PMC free article] [PubMed] [Google Scholar]
- 70.Reinhardt RL, Hong S, Kang SJ, Wang ZE, Locksley RM. Visualization of IL-12/23p40 in vivo reveals immunostimulatory dendritic cell migrants that promote Th1 differentiation. J Immunol. 2006;177:1618–1627. doi: 10.4049/jimmunol.177.3.1618. [DOI] [PubMed] [Google Scholar]
- 71.Jones TR, et al. Scoring diverse cellular morphologies in image-based screens with iterative feedback and machine learning. Proceedings of the National Academy of Sciences. 2009;106:1826–1831. doi: 10.1073/pnas.0808843106. [DOI] [PMC free article] [PubMed] [Google Scholar]
- 72.Higuti IH, et al. Colorimetric determination of alpha and beta-cyclodextrins and studies on optimization of CGTase production from B. firmus using factorial designs. Brazilian Archives of Biology and Technology. 2004;47:837–841. [Google Scholar]
- 73.Lai P, Xu X, Wang LV. Dependence of optical scattering from Intralipid in gelatin-gel based tissue-mimicking phantoms on mixing temperature and time. Journal of biomedical optics. 2014;19:035002–035002. doi: 10.1117/1.JBO.19.3.035002. [DOI] [PMC free article] [PubMed] [Google Scholar]
Associated Data
This section collects any data citations, data availability statements, or supplementary materials included in this article.
Supplementary Materials
Data Availability Statement
The data supporting the findings of this study are available within the paper and its Supplementary Information. Data acquired in the course of this study are available from the corresponding author upon reasonable request.