Abstract
Living cells dynamically modulate the local morphologies of their actin cytoskeletons to perform biological functions, including force transduction, intracellular transport, and cell division. A major challenge is to understand how diverse structures of the actin cytoskeleton are assembled from a limited set of molecular building blocks. Here we study the spontaneous self-assembly of a minimal model of cytoskeletal materials, consisting of semiflexible actin filaments, crosslinkers, and molecular motors. Using coarse-grained simulations, we demonstrate that by changing concentrations and kinetics of crosslinkers and motors, as well as filament lengths, we can generate three distinct structural phases of actomyosin assemblies: bundled, polarity-sorted, and contracted. We introduce new metrics to distinguish these structural phases and demonstrate their functional roles. We find that the binding kinetics of motors and crosslinkers can be tuned to optimize contractile force generation, motor transport, and mechanical response. By quantitatively characterizing the relationships between the modes of cytoskeletal self-assembly, the resulting structures, and their functional consequences, our work suggests new principles for the design of active materials.
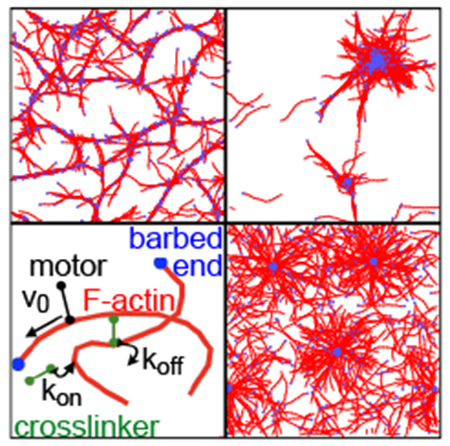
Using simulation to explore the diverse structural and functional phases of the actin cytoskeleton.
1. Introduction
Mechanical functions of living cells are determined by dynamic restructuring of the actin cytoskeleton, a highly conserved cellular machinery composed of filamentous actin (F-actin), myosin molecular motors, and crosslinking proteins1. An enormous variety of F-actin binding proteins with diverse physicochemical properties2 can combine with F-actin to assemble function-specific cellular structures. Spatiotemporal control over these structures is essential for coordinated force generation during cell migration3,4, cell adhesion5, cytokinesis6, and intracellular transport7,8. A quantitative understanding of how diverse cytoskeletal structures are assembled from a limited set of molecular building blocks presents an outstanding challenge at the interface of soft matter physics and cell biology.
Much effort has been devoted to understanding how contracted states arise in actomyosin networks that lack sarcomeric organization. One mechanism that has emerged is that actin filaments rectify randomly directed forces to select for contractile ones because they can buckle readily but cannot stretch significantly9–14. Alternatively, crosslinking can arrest relative sliding of filaments as they increase their overlap15,16 (see also17 in the context of microtubules). The prevalence of these mechanisms and, in turn, contractile dynamics, depends on motor density and activity12,15,18–20, network connectivity18,21–23, actin filament turnover24, and filament stiffness16.
Sufficient variation of system parameters leads to other states. Networks with low densities of motors exhibit bundled morphologies18,25–27; lattice-like (lamellar) and clustered morphologies have been seen in simulations as well26. Consistent with experiments and simulations of microtubules28,29 as well as theories of active gels30, polarity-sorted asters of crosslinked actin bundles have also been observed16. Understanding how these diverse structures relate and can be elicited requires systematically mapping phase diagrams for networks of filaments, motors, and crosslinkers in terms of both molecular parameters (e.g., association and dissociation kinetics, molecular sizes, binding geometries, and microscopic mechanical properties) and system parameters (e.g., molecular composition, turnover, system geometries, external forces).
In this paper, we take a step towards this goal. We investigate the structures accessible to a coarse-grained model that has been parameterized to represent actomyosin networks involving only a single crosslinking protein that binds without geometric restrictions. We consider the interplay of motor and crosslinker density, their binding kinetics, and filament length. We observe homogeneous, contracted, bundled, and polarity sorted structures and introduce order parameters that quantify their prevalence. We then explore the materials properties of these structures. Specifically, we examine the viscoelastic response to shear strain and the motor transport properties. Our study thus unifies previously observed structures in a single model, reveals the dependence of these structures on molecular parameters, and links the structures to functional consequences.
2. Results and Discussion
2.1. Model
To study the spontaneous self-assembly of cytoskeletal structures at experimentally relevant length and time scales (microns and minutes), we use AFINES, a simulation framework we recently developed 31. In brief, actin filaments are modeled as polar worm-like chains (represented by beads connected by springs) with defined barbed and pointed ends (Fig. 1); crosslinkers are modeled as linear springs with ends (heads) that can stochastically bind and unbind from F-actin via a kinetic Monte Carlo procedure that preserves detailed balance; molecular motors are modeled as active crosslinkers such that once bound, they walk toward the barbed ends of filaments at load-dependent speeds. While competing simulation frameworks are available and have their advantages32,33, a unique feature of AFINES is its preservation of detailed balance in the absence of motors31. Treating the physics of passive systems correctly facilitates their comparison with active systems and, in turn, interpretation of the simulations.
Fig. 1.
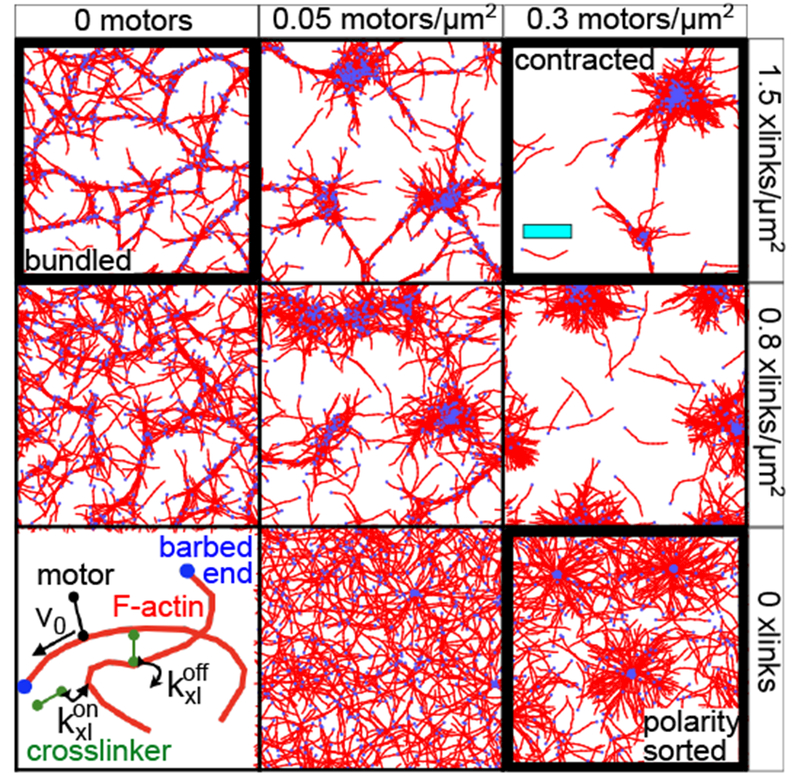
Network structures, (lower left) Schematic of the model31 with F-actin (red), crosslinkers (green), and motors (black). Bound motors walk towards F-actin barbed ends (blue), (remaining panels) Network structures at 400 s for indicated motor and crosslinker densities. These include a bundled network (upper left) formed by filaments and crosslinkers, a polarity-sorted network (lower right) formed by filaments and motors, and a contracted network (upper right) formed from filaments, crosslinkers, and motors. For clarity, only the actin filaments are shown; the motors and crosslinkers are shown in Fig. S1. Cyan scale bar represents 10 μm.
We use Brownian dynamics to evolve the positions of constituents in 2D. The choice of dimension is consistent with the fact that actomyosin networks reconstituted in vitro are typically restricted to a region close to a supporting substrate12,16,25. At the same time, to reflect the finite thickness of the experimental systems and enable rearrangement in 2D, we neglect excluded volume. For this reason, we restrict our attention to actin concentrations at which we expect the network connectivity to dominate the dynamics. This precludes modeling active nematic systems34,35, previously studied by others 36–38; it may also lead to quantitative artifacts in the rates of structure formation (owing to a lack of entanglement39) and in density-dependent statistics of states with features such as contracted clusters or bundles. Overall, however, the model yields results in good agreement with observations for many cases of experimental interest16,31. The model is described in detail in Section S1, and Table S1 lists all simulation parameters.
2.2. Network structures
We observe three distinct network architectures formed from initially disordered mixtures of F-actin, motors, and crosslinkers: bundled, polarity-sorted, and contracted. Examples are shown for simulations of 500 10-μm-long filaments in Fig. 1. When F-actin is mixed with crosslinkers, thick bundles form and intersect to yield a well-connected mesh. When F-actin is mixed with motors, barbed ends aggregate to form a polarity-sorted network. Combining F-actin with both motors and crosslinkers results in macroscopic contraction of the filaments into dense and disconnected aggregates. These structures are qualitatively consistent with recent experimental observations16,40.
2.3. Order parameters for characterization of network structures
To systematically explore how varying the properties of the network constituents affects structure formation, we introduce order parameters that characterize each of the observed structures. We compute the spatial extent of F-actin aggregation using the radial distribution function,
| (1) |
where P(r) is the probability that two actin beads are separated by a distance in the range [r,r+δr] (here, δr = 0.05 μm), and A is the area of the simulation cell (Section S2, ESI). For a homogeneous network, g(r) ≈ 1 at all distances (Fig. 2A; the small peaks at integer r arise from the spacing of beads within actin filaments). In contrast, for contracted networks, g(r) ⪢ 1 for r < 10 μm, indicating F-actin exceeds the bulk density, as observed experimentally12.
Fig. 2.
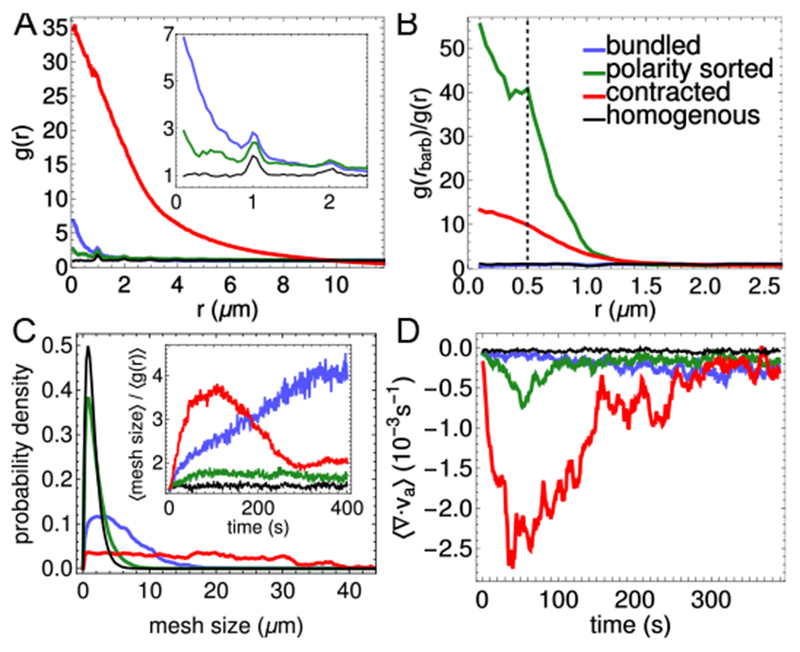
Order parameters. Bundled, polarity-sorted, and contracted cases correspond to the conditions highlighted in Fig. 1; the homogeneous case has no motors or crosslinkers. (A) Radial distribution function of actin, g(r). (B) Radial distribution function of F-actin barbed ends, normalized by g(r); the dashed line marks the motor rest length, 0.5 μm. (C) Mesh size distribution. Inset: Evolution of the average mesh size, normalized by (g(r)). (D) Spatially averaged divergence (Section S2). All averages are over the final 50 s of 5 simulations of 400 s.
While Fig. 2A shows that actin filaments are nearly uniformly distributed in polarity-sorted networks, Fig. 1 indicates that their barbed ends are concentrated. To quantify their aggregation specifically, we compute the ratio g(rbarb)/g(r), where rbarb is the distance between barbed ends. Fig. 2B shows that in polarity-sorted networks F-actin barbed ends aggregate (and have a secondary peak at 0.5 μm, the rest length of motors). In contracted networks, barbed ends also aggregate to a higher degree than in bundled networks, indicating a degree of polarity sorting. This is consistent with recent experiments that indeed show that contracted F-actin forms polarity sorted asters16.
The inset to Fig. 2A indicates that bundled networks aggregate at length scales comparable to the crosslinker rest length, lxl = 0.15 μm. To quantify the degree of bundling, and to distinguish it from contractility, we measure the distribution of network pore sizes by a procedure that is similar in spirit but simpler than that in Ref. 41. Namely, we grid the simulation box into (0.25 μm)2 bins and compute how many filaments pass through each. For each empty bin, we determine the lengths of the contiguous vertical and horizontal stretches of empty bins that intersect it (Fig. 3). We average these lengths over all empty bins to obtain an average mesh size for each structure. This procedure can be used for analysis of experimental images, in addition to the simulation structures in the present study.
Fig. 3.
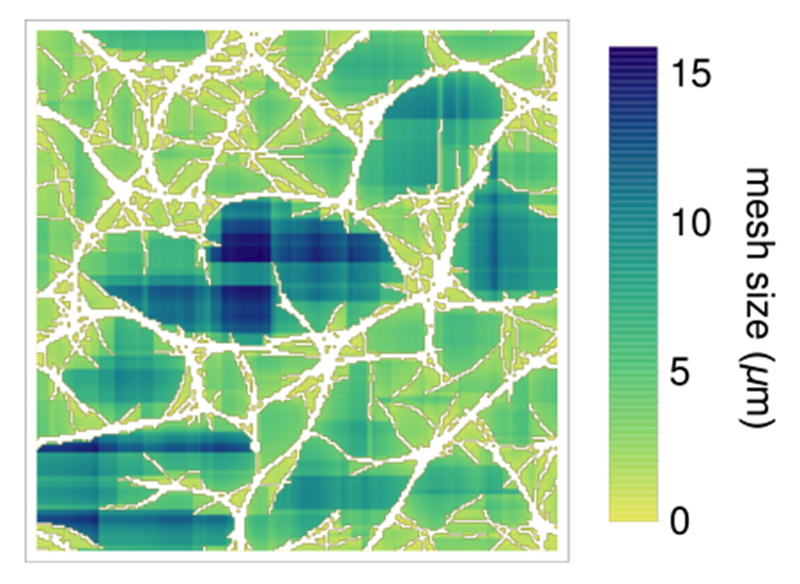
Example of mesh size calculation described in the text. Actin is shown in white (compare with bundled structure in Fig. 1) and the size of the local mesh corresponds to the depth of color, as indicated by the scale.
In Fig. 2C, the distributions of mesh sizes for polarity-sorted and homogeneous networks are similar, indicating that the former does not coarsen significantly. The bundled and contracted networks exhibit larger pore sizes; indeed, contracted networks exhibit pore sizes spanning the simulation region, indicating that the network has ripped apart. We can distinguish these cases by normalizing the mesh size by , (here, R = 10 μm is the approximate size of a contracted aggregate under our maximally contractile conditions, as shown in Fig. 2A; see Fig. S2 for further details) which quantifies the extent of aggregation. The inset shows that, while the contracted networks initially bundle, at long times this effect is small compared to aggregation. In contrast, bundled networks have a steadily increasing normalized mesh size (Fig. 2C, inset), consistent with continuous coarsening of filamin crosslinked networks of long actin filament bundles40. We thus have a metric for the degree of bundling.
To examine the relationship between actin network structure and contractility, we use the divergence of actin’s velocity field, ⟨∇ ∙ v⟩, where ⟨…⟩ indicates spatial averaging (Section S2)31. As shown in Fig. 2D, ⟨∇ ∙ v⟩ becomes significantly more negative for aggregating networks than for bundling or polarity-sorted networks. Comparison with Fig. 2A shows that extensive contraction is associated with large g(r).
2.4. Phase diagram for molecular composition
Using these order parameters, we map the structural phase diagram of actomyosin networks as functions of motor and crosslinker densities (Fig. 4). Consistent with Fig. 1, networks are contracted when motor and crosslinker densities are high (Fig. 4A), polarity-sorted when only motor density is high (Fig. 4B), and bundled when crosslinker density is high (Fig. 4C). These results echo observations in experiments and simulations that at low motor density, crosslinkers can bundle actin into meshes18,27, and at high motor density, crosslinkers promote contractility by increasing network connectivity9,18,27,42. While polarity sorting is not usually observed independent of contractility in actomyosin networks, our result that increasing motor density promotes this effect is consistent with previous experimental observations and simulations of microtubules interacting with plus-end oriented motors29. Furthermore recent experiments on reconsituted actomyosin networks show that rigid F-actin bundles can form polarity-sorted structures without undergoing bulk contraction16.
Fig. 4.
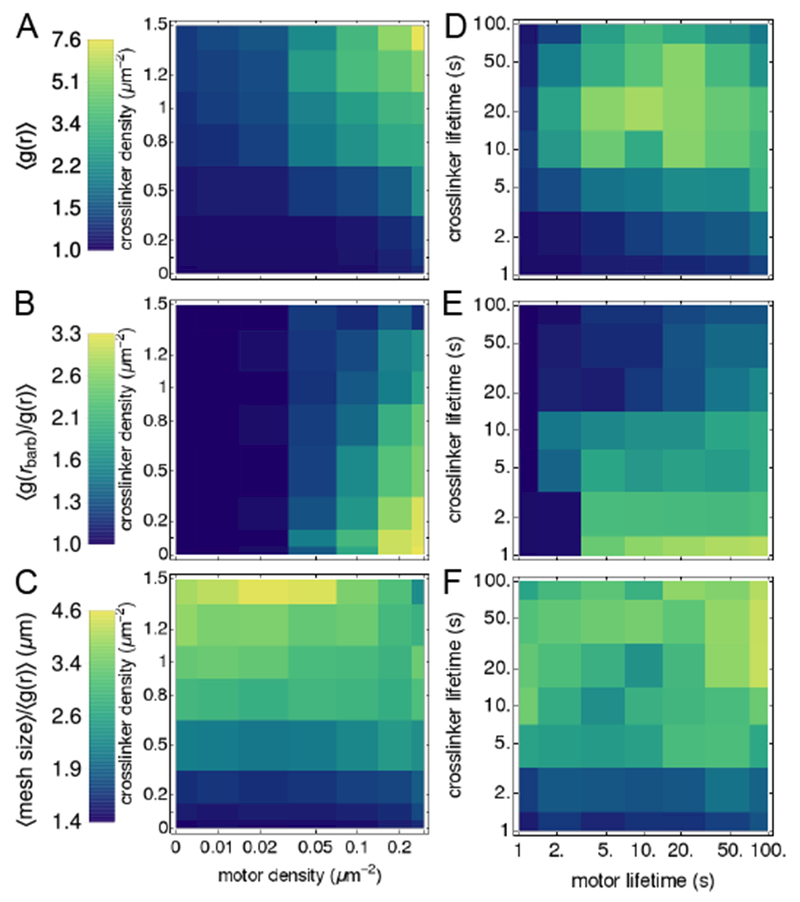
Maps of network properties. Colors indicate the values of order parameters characterizing network contractility (A,D), polarity sorting (B,E), and bundling (C,F), at constant filament length, L = 10 μm, binding affinity (left), and densities ρm = 0.2 μm−2, ρxl = 1 μm−2 (right, plotted as a function of lifetime, ; structures shown in Fig. S5). Averages are over the last 50 s of five simulations of 400 s; order parameters that are functions of distance, e.g., g(r), are integrated over 0 < r ≤ 10 μm. Error bars for representative curves are shown in Fig. S3.
Interestingly, we also observe one non-monotonic trend in this phase diagram: while high motor densities inhibit bundling, a small population of motors (ρm ≈ 0.02 μm−2) enhances bundling. Other non-monotonic trends have been reported, including that high crosslinker densities18,22, and more surprisingly, high motor force21 can inhibit contractility and yield bundled or critically connected networks. We did not observe these effects in the ranges of densities that we considered. This may be because our crosslinker-to-filament ratios (up to 7.5:1) are lower than observed thresholds for crosslinker inhibition (ranging from 15:122 to >90:118); we expect this threshold to depend on the kinetics of association, as we now discuss.
2.5. Phase diagram for binding kinetics
We also modulate molecular-level interaction parameters between F-actin and its binding partners (crosslinkers, motors), and dissect their relative roles in building different structures. These parameters are hard to control in experiment because they require modifying protein-protein interactions. At fixed motor and crosslinker densities, we find that cytoskeletal structures can be tuned by varying the dissociation constants, (Fig. 4D-F). The trends are non-monotonic, in contrast to those in Fig. 4A-B. In particular, contraction is highest for intermediate values of (Fig. 4D), similar to observations that increasing motor and crosslinker densities beyond a threshold inhibits contraction 18,21,22. Bundling is highest for low values of with low or high (Fig. 4F). Notably, this non-monotonic trend only arises for a fixed simulation time, tF. For a fixed value of changing modulates structure formation in a monotonic manner (dashed lines in Fig. 5). The non-monotonic trends are important, however, for understanding how structures form in the presence of competing kinetic processes, such as turnover of different network elements 7,43.
Fig. 5.
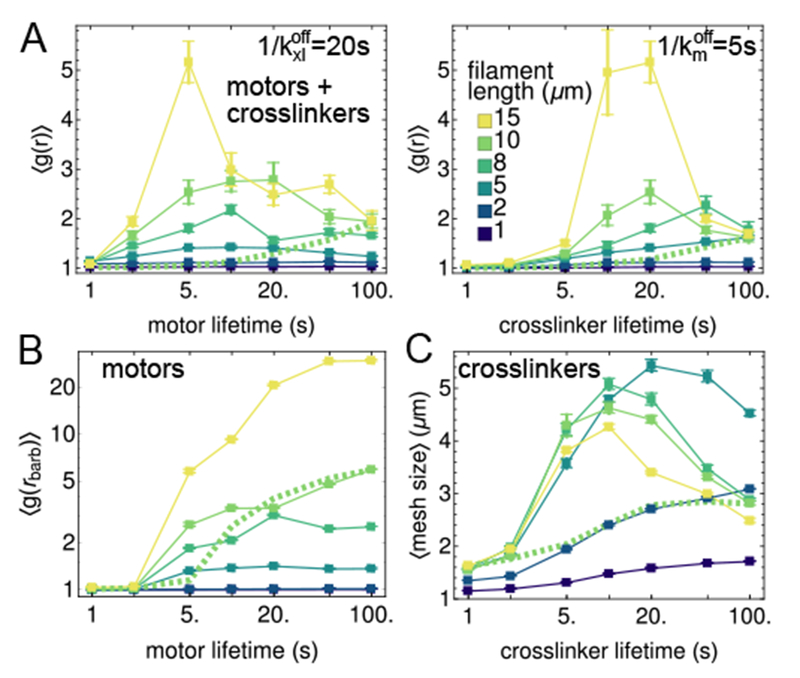
Effects of varying motor and crosslinker lifetimes, , for filaments of different lengths, L, at tf = 400 s (filled squares). (A) Contractility order parameter, radial distribution function, for mixtures of filaments, motors, and crosslinkers with ρm = 0.2 μm−2 and ρxl = 1 μm−2. (B) Polarity sorting order parameter, radial distribution function of barbed ends, for mixtures of filaments and motors, without crosslinkers. (C) Bundling order parameter, mesh size, for mixtures of filaments and crosslinkers, without motors. Normalizing quantities in (B) and (C) with respect to ⟨g(r)⟩ does not change the qualitative behaviors (Fig. S4). Error bars indicate standard error of the mean. The green dashed lines show how order parameters vary for one length, L = 10 μm, if the corresponding green squares are rescaled such that .
2.6. Effect of filament length
As the length (L) of F-actin varies considerably within cells44, we tested how modulating L and ) in tandem affects structure formation. In Fig. 5A, we show that increasing L favors aggregation by increasing network connectivity; short filaments (L < 5 μm) do not organize. As in Fig. 4D, the dependence of aggregation on binding affinity is non-monotonic whenever there is significant aggregation (i.e., L ≥ 5 μm). In Fig. 5B, we show that for networks with only motors, at low , increasing filament length promotes polarity sorting. By contrast, at high , short lifetimes of motor attachment suppress polarity sorting. As evident from the representative network structures in Fig. S6, shortening the filaments also suppresses polarity sorting.
For networks with only crosslinkers, the mesh size (Fig. 5C) is non-monotonic with respect to both filament length and crosslinker affinity. Low crosslinker affinity and short filament lengths prevent forming stably crosslinked networks (Fig. S7). Conversely, assemblies with high crosslinker affinity or long filament lengths form crosslinked networks, but they rearrange slowly, so further coarsening is impeded, and the mesh size remains small. As these non-monotonic trends only occur for L > 5 μm, they are more likely to impact structures with longer actin filaments found in budding yeast45, stereocilia46, filopodia, or reconstituted in vitro16,40 (though we note that long microtubules have been obseved to form different structures in the presence and absence of a membrane47). Structures with shorter filaments, as found in lamellipodia or the actin cortex (< 2 μm)23,48, are less likely to have a finite binding affinity that maximizes contractility. We discuss the effects of length further in conjunction with the mechanical response of networks, below.
2.7. Network structure tunes molecular transport
While the structures of contracted, polarity-sorted, and bundled networks clearly differ, their consequences for biophysical functions are not immediately apparent. To determine how these structures influence motor transport49,50, we follow the dynamics of small numbers of motors introduced after the structures form (Fig. 6A). In Fig. 6B, we plot their mean-squared displacement,
| (2) |
where tf is the length of the trajectory and is the displacement of a motor with center of mass position at time t after a lag of Δ. While the scaling of the mean-squared displacement is consistent with simple diffusion (Fig. 6B), sample trajectories (Fig. 6A) indicate that motors in contracted and polarity-sorted structures spend significant amounts of time trapped in aggregates of barbed ends.
Fig. 6.
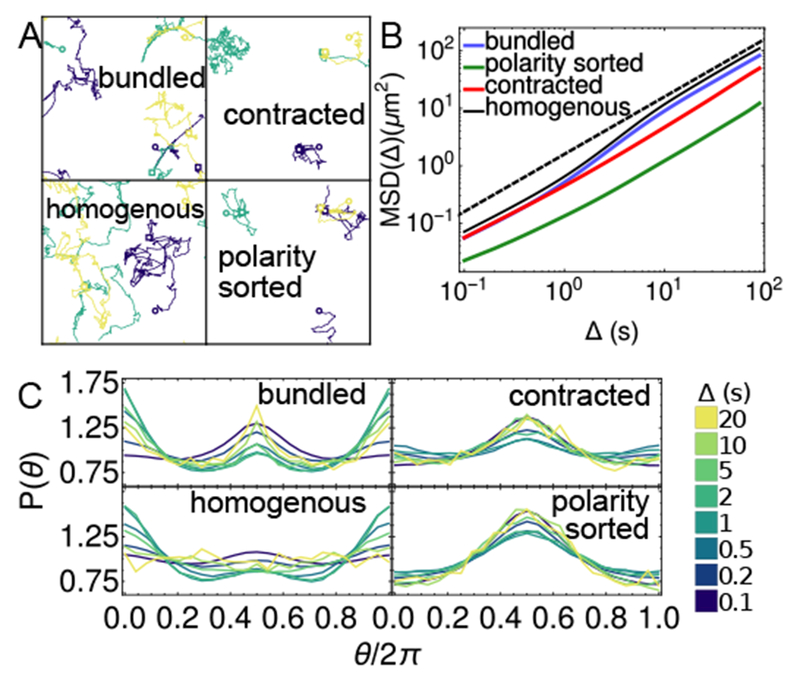
Transport properties of motors on actin structures. (A) Example trajectories of three motors (each a different color) on actin networks (filaments shown in Fig. 1 and Fig. S1). Open circles show initial position of each motor, and open squares show their final position after 500 timesteps. (B) Mean squared displacement for motors on structures. Black dashed line shows diffusive behavior, MSD(tf, Δ) ∝ Δ. (C) Distributions of angles between subsequent motor displacements for different lag times, Δ51. Averages in (B-C) are over 770 motors over the last 100 s of 5 independent trajectories of 200 s, at each condition.
We quantify caging using a previously defined metric that can distinguish different kinds of motion51: we compute the distribution of angles, θ, between consecutive displacement vectors and , at different values of Δ. We find that for all structures, there is at least one time scale in which the distribution has a broad peak at θ = π (Fig. 6C), indicating that motors are reversing direction, consistent with confinement51. For polarity-sorted networks, barbed ends are tightly aggregated, and the motors exhibit caging at all time scales measured. Contracted networks are partially polarity-sorted, so filaments can direct motors both in and out of aggregates, making the caging more spatially extended. Because it takes longer to explore the extended length scale, the peak has is smaller than in the polarity sorted network. Bundled networks exhibit peaks at both Θ = 0 and θ = π depending on the time scale. The former corresponds to moving steadily along a filament, while the latter corresponds to switching between oppositely oriented filaments.
Consistent with our results, it was recently shown that actin networks with different structures result in different angle distributions52. As in our results for bundled networks, reconstituted networks of actin and filamin supported simultaneous peaks at θ = 0 and θ = π at short times (0.1 s)52. Interestingly, in our simulations, the peak at θ = π diminishes at intermediate times. A key feature of the experiments that is not represented in the present model is that the myosin minifilaments in the experiments have many heads 51–53, and this was previously shown to be important for observed glassy dynamics 53.
2.8. Network structure tunes mechanical response
Next, we evaluated how structural rearrangements in actin networks affect their ability to propagate mechanical forces over long length scales. To this end, we subjected the final network configuration to a shear strain of magnitude γ = 0.5 (Fig. 7A, algorithm described in Section S3) and measured the resulting strain energy. In Fig. 7B, we show the strain dependence of the strain energy density, w(γ) − w(0), where
| (3) |
Uf, Um, and Uxl are the potential energies of the F-actin, motors, and crosslinkers, respectively, (Section S1) and V = 250 μm3 is the simulation volume, assuming a thickness of 0.1 μm. To determine the viscoelastic response of the material, we fit the computed strain energy density to the function where G is the shear modulus, η is the dynamic viscosity, and is the strain rate (see Section S3 for details)54.
Fig. 7.
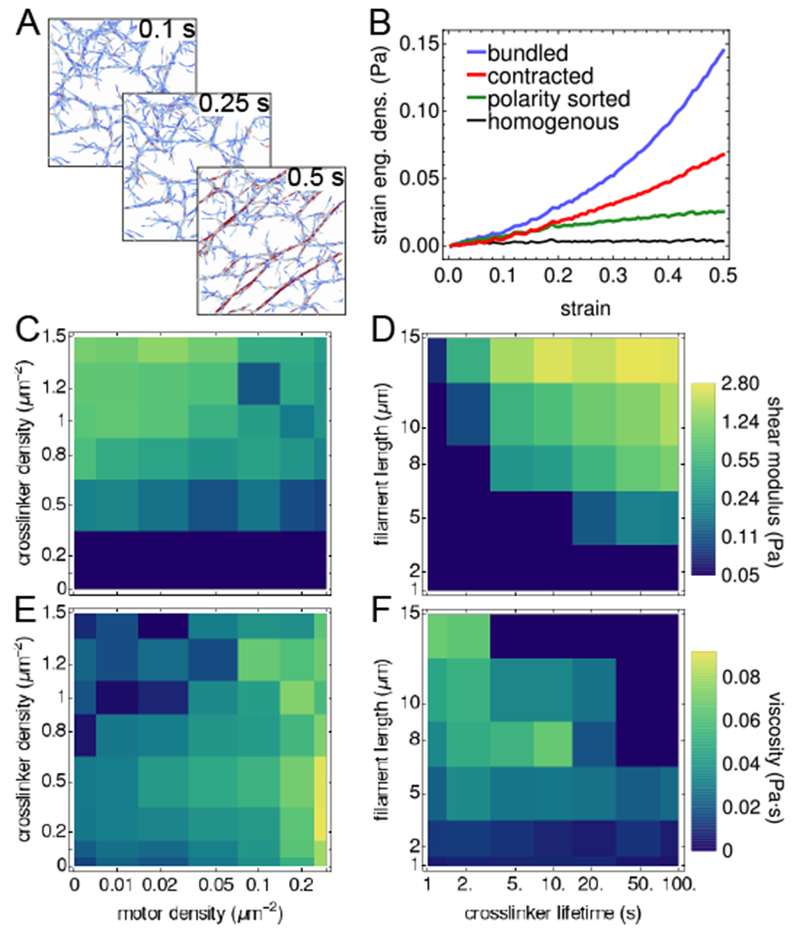
Elasticity of network structures. (A) Shearing a bundled network for 0.5 s at a strain rate of . Depth of color indicates stretch of filament. (B) Viscoelastic response of the network to a simple shear, as measured by the dependence of the strain energy density on the strain. (C-D) Shear modulus of structures (shown in Fig. 1) formed with constant filament length (L = 10 μm) and lifetimes (), but different motor and crosslinker densities (C), and for structures (shown in Fig. S7) formed without motors and constant crosslinker density (ρxl = 1.2 μm−2), with different filament lengths and crosslinker lifetimes (D). (E-F) Viscosity of these networks. Strain calculations in (B-F) are averaged over 5 independent trajectories.
We found that bundled networks exhibited the most solid-like material response (G = 1.07 Pa, within range of experimentally measured values for actin-filamin networks25, and η = 0.007 Pa ∙ s), while polarity-sorted and homogenous networks exhibited fluid-like responses (G ≈ 0, η = 0.080, 0.014 Pa ∙ s respectively). Contracted networks exhibited a viscoelastic response (G = 0.30 Pa, η = 0.063 Pa ∙ s), consistent with theoretical predictions from active gel models55,56.
We used this method to measure the material response of the broad spectrum of structures that resulted from varying motor and crosslinker densities, and the various bundled networks that resulted from varying filament length and crosslinker lifetime. We find that these structures can be elastic (η ≈ 0), viscous (G ≈ 0), or viscoelastic (nonzero G and η). The viscous systems exhibit no quadratic response to strain because they are not well-connected (indicating there exists a percolation threshold). For a given crosslinker lifetime () and filament length (10 μm), we find that all networks below ρxl = 0.05 μm−2 have G ≈ 0 and high viscosity (Fig. 7C,E). Therefore, ρxl = 0.05 μm−2 defines the percolation threshold of the gel, which is independent of motor density. Above the percolation threshold, networks have a range of viscoleastic behavior, with low motor density yielding more elastic behavior, and high motor density yielding more viscous behavior. For networks without motors, increasing the crosslinker concentration yielded higher shear elastic moduli, consistent with theoretical predictions57, experiments25,58, and previous simulations59.
In Fig. 7D,F we show that even at high crosslinker density (1.2 μm−2), the network can respond as a fluid if the crosslinker lifetime or filament length is sufficiently low ( or L ≤ 5 μm). At intermediate lifetimes, such as for the crosslinker filamin (), our results agree with experiments: below a critical length, networks respond as fluids40, and increases in filament length lead to increases in the elastic modulus60. At the longest filament lengths (15 μm) and crosslinker lifetimes (≥ 50 s), crosslinked networks are nearly solid with η ≈ 0. A viscoelastic regime occurs at intermediate values of filament length and crosslinker lifetime, corresponding to the networks with the largest mesh sizes (Fig. 5C).
3. Conclusion and Outlook
We have shown how modulating the abundance and physicochemical properties of cytoskeletal constituents can tune emergent network structures and in turn their materials properties. We also introduced order parameters that should facilitate analysis of other models and images from experiments. We find that motor and crosslinker binding affinities, as well as filament lengths, have optimal values for maximizing contractility, bundling, and polarity sorting at finite times. From the perspective of materials design, our work demonstrates how a limited set of molecular building blocks can self-assemble diverse active materials.
In the present study, we consider only a single type of crosslinker (as defined by its stiffness and size), which binds without geometric restrictions. It would be straightforward to modify the energy function of the model to introduce geometric restrictions, and studies of passive systems indicate that such terms can introduce additional structural phases26. The model can also be extended to include actin polymerization and turnover, which have been shown to modulate contractility42,61 and bundling39. Finally, the model can be parameterized for other polymer assemblies, such as microtubules, kinesin, and dynein, which form vortices and polarity sorted asters29,62,63.
Our framework can thus be built on to treat diverse types of crosslinkers, filaments, and motors. We expect that rich behavior can be achieved by simulating mixtures with four or more constituents. Because it is straightforward to vary the abundance and properties of the constituents computationally, they could be automatically optimized to achieve desired properties64, and the results could inform the design and synthesis of new active materials.
Supplementary Material
5. Acknowledgments
We thank Margaret Gardel, Jonathan Weare, Samantha Stam, and Kim Weirich for helpful conversations. This work was primarily supported by the University of Chicago Materials Research Science and Engineering Center, which is funded by National Science Foundation under award number DMR-1420709. Additional support was provided by the DoD through the NDSEG Program (to S.L.F.), a NIH Ruth L. Kirschstein NRSA award (1F32GM113415-01) (to G.M.H.), and a UCL Strategic Fellowship (to S.B.). Simulations resources were provided by the Research Computing Center at the University of Chicago and National Institutes of Health (NIH) Grant No. 5 R01 GM109455-02.
Footnotes
4 Conflicts of Interest
There are no conflicts of interest to declare.
References
- 1.Murrell M, Oakes PW, Lenz M and Gardel ML, Nat. Rev. Mol. Cell Biol, 2015, 16, 486. [DOI] [PMC free article] [PubMed] [Google Scholar]
- 2.Michelot A and Drubin DG, Curr. Biol, 2011, 21, R560–R569. [DOI] [PMC free article] [PubMed] [Google Scholar]
- 3.Pollard TD and Borisy GG, Cell, 2003, 112, 453–465. [DOI] [PubMed] [Google Scholar]
- 4.Lomakin AJ, Lee K-C, Han SJ, Bui DA, Davidson M, Mogilner A and Danuser G, Nat. Cell Biol, 2015, 17, 1435. [DOI] [PMC free article] [PubMed] [Google Scholar]
- 5.Parsons JT, Horwitz AR and Schwartz MA, Nat. Rev. Mol. Cell Biol, 2010, 11, 633–643. [DOI] [PMC free article] [PubMed] [Google Scholar]
- 6.Sedzinski J, Biro M, Oswald A, Tinevez J-Y, Salbreux G and Paluch E, Nature, 2011, 476, 462. [DOI] [PubMed] [Google Scholar]
- 7.Munro E, Nance J and Priess JR, Dev. Cell, 2004, 7, 413–424. [DOI] [PubMed] [Google Scholar]
- 8.Tabei SMA, Burov S, Kim HY, Kuznetsov A, Huynh T, Jureller J, Philipson LH, Dinner AR and Scherer NF, Proc. Natl. Acad. Sci. USA, 2013, 110, 4911–4916. [DOI] [PMC free article] [PubMed] [Google Scholar]
- 9.e Silva MS, Depken M, Stuhrmann B, Korsten M, MacKintosh FC and Koenderink GH, Proc. Natl. Acad. Sci. USA, 2011, 108, 9408–9413. [DOI] [PMC free article] [PubMed] [Google Scholar]
- 10.Lenz M, Thoresen T, Gardel ML and Dinner AR, Phys. Rev. Lett, 2012, 108, 238107. [DOI] [PMC free article] [PubMed] [Google Scholar]
- 11.Lenz M, Gardel ML and Dinner AR, New J. Phys, 2012, 14, 033037. [DOI] [PMC free article] [PubMed] [Google Scholar]
- 12.Murrell MP and Gardel ML, Proc. Natl. Acad. Sci. USA, 2012, 109, 20820–20825. [DOI] [PMC free article] [PubMed] [Google Scholar]
- 13.Lenz M, Phys. Rev. X, 2014, 4, 041002. [Google Scholar]
- 14.Ronceray P, Broedersz CP and Lenz M, Proc. Natl. Acad. Sci. USA, 2016, 113, 2827–2832. [DOI] [PMC free article] [PubMed] [Google Scholar]
- 15.Murrell M and Gardel ML, Mol. Biol. Cell, 2014, 25, 1845–1853. [DOI] [PMC free article] [PubMed] [Google Scholar]
- 16.Stam S, Freedman SL, Banerjee S, Weirich KL, Dinner AR and Gardel ML, Proc. Natl. Acad. Sci. USA, 2017, 114, E10037–10045. [DOI] [PMC free article] [PubMed] [Google Scholar]
- 17.Stanhope KT, Yadav V, Santangelo CD and Ross JL, Soft Matter, 2017, 13, 4268–4277. [DOI] [PubMed] [Google Scholar]
- 18.Bendix PM, Koenderink GH, Cuvelier D, Dogic Z, Koeleman BN, Brieher WM, Field CM, Mahadevan L and Weitz DA, Biophys. J, 2008, 94, 3126–3136. [DOI] [PMC free article] [PubMed] [Google Scholar]
- 19.Linsmeier I, Banerjee S, Oakes PW, Jung W, Kim T and Murrell M, Nat. Commun, 2016, 7, 12615. [DOI] [PMC free article] [PubMed] [Google Scholar]
- 20.Belmonte JM, Leptin M and Nédélec F, Mol. Syst. Biol, 2017, 13, 941. [DOI] [PMC free article] [PubMed] [Google Scholar]
- 21.Alvarado J, Sheinman M, Sharma A, MacKintosh FC and Koenderink GH, Nat. Phys, 2013, 9, 591–597. [Google Scholar]
- 22.Ennomani H, Letort G, Guérin C, Martiel J-L, Cao W, Nédélec F, Enrique M, Théry M and Blanchoin L, Curr. Biol, 2016, 26, 616–626. [DOI] [PMC free article] [PubMed] [Google Scholar]
- 23.Chugh P, Clark AG, Smith MB, Cassani DA, Dierkes K, Ragab A, Roux PP, Charras G, Salbreux G and Paluch EK, Nat. Cell Biol, 2017, 19, 689–697. [DOI] [PMC free article] [PubMed] [Google Scholar]
- 24.Hiraiwa T and Salbreux G, Phys. Rev. Lett, 2016, 116, 188101. [DOI] [PMC free article] [PubMed] [Google Scholar]
- 25.Schmoller K, Lieleg O and Bausch A, Biophys. J, 2009, 97, 83–89. [DOI] [PMC free article] [PubMed] [Google Scholar]
- 26.Cyron C, Müller K, Schmoller K, Bausch A, Wall W and Bruinsma R, Europhys. Lett, 2013, 102, 38003. [Google Scholar]
- 27.Bidone TC, Jung W, Maruri D, Borau C, Kamm RD and Kim T, PLoS Comput. Biol, 2017, 13, e1005277. [DOI] [PMC free article] [PubMed] [Google Scholar]
- 28.Nédélec F, Surrey T, Maggs AC and Leibler S, Nature, 1997, 389, 305. [DOI] [PubMed] [Google Scholar]
- 29.Surrey T, Nédélec F, Leibler S and Karsenti E, Science, 2001, 292, 1167–1171. [DOI] [PubMed] [Google Scholar]
- 30.Kruse K, Joanny J-F, Jülicher F, Prost J and Sekimoto K, Phys. Rev. Lett, 2004, 92, 078101. [DOI] [PubMed] [Google Scholar]
- 31.Freedman SL, Banerjee S, Hocky GM and Dinner AR, Biophys. J, 2017, 113, 448–460. [DOI] [PMC free article] [PubMed] [Google Scholar]
- 32.Nedelec F and Foethke D, New J. Phys, 2007, 9, 427. [Google Scholar]
- 33.Popov K, Komianos J and Papoian GA, PLoS Comput. Biol, 2016, 12, e1004877. [DOI] [PMC free article] [PubMed] [Google Scholar]
- 34.Sanchez T, Chen DT, DeCamp SJ, Heymann M and Dogic Z, Nature, 2012, 491, 431. [DOI] [PMC free article] [PubMed] [Google Scholar]
- 35.Zhang R, Kumar N, Ross JL, Gardel ML and de Pablo JJ, Proc. Natl. Acad. Sci. USA, 2017, 201713832. [Google Scholar]
- 36.Letort G, Politi AZ, Ennomani H, Théry M, Nedelec F and Blanchoin L, PLoS Comput. Biol, 2015, 11, e1004245. [DOI] [PMC free article] [PubMed] [Google Scholar]
- 37.Blackwell R, Sweezy-Schindler O, Baldwin C, Hough LE, Glaser MA and Betterton M, Soft Matter, 2016, 12, 2676–2687. [DOI] [PMC free article] [PubMed] [Google Scholar]
- 38.DeCamp SJ, Redner GS, Baskaran A, Hagan MF and Dogic Z, Nat. Mater, 2015, 14, 1110. [DOI] [PMC free article] [PubMed] [Google Scholar]
- 39.Foffano G, Levernier N and Lenz M, Nat. Commun, 2016, 7, 13827. [DOI] [PMC free article] [PubMed] [Google Scholar]
- 40.Weirich KL, Banerjee S, Dasbiswas K, Witten TA, Vaikuntanathan S and Gardel ML, Proc. Natl. Acad. Sci. USA, 2017, 114, 2131–2136. [DOI] [PMC free article] [PubMed] [Google Scholar]
- 41.Mickel W, Münster S, Jawerth LM, Vader DA, Weitz DA, Sheppard AP, Mecke K, Fabry B and Schroder-Turk GE, Biophys. J, 2008, 95, 6072–6080. [DOI] [PMC free article] [PubMed] [Google Scholar]
- 42.Mak M, Zaman MH, Kamm RD and Kim T, Nat. Commun, 2016, 7, 10323. [DOI] [PMC free article] [PubMed] [Google Scholar]
- 43.Fritzsche M, Erlenkämper C, Moeendarbary E, Charras G and Kruse K, Sci. Adv, 2016, 2, e1501337. [DOI] [PMC free article] [PubMed] [Google Scholar]
- 44.Mohapatra L, Goode BL, Jelenkovic P, Phillips R and Kondev J, Annu. Rev. Biophys, 2016, 45, 85–116. [DOI] [PMC free article] [PubMed] [Google Scholar]
- 45.Chesarone-Cataldo M, Guérin C, Jerry HY, Wedlich-Soldner R, Blanchoin L and Goode BL, Dev. Cell, 2011, 21, 217–230. [DOI] [PMC free article] [PubMed] [Google Scholar]
- 46.Lin HW, Schneider ME and Kachar B, Curr. Opin. Cell Biol, 2005, 17, 55–61. [DOI] [PubMed] [Google Scholar]
- 47.Pinot M, Chesnel F, Kubiak J, Arnal I, Nédélec F and Gueroui Z, Curr. Biol, 2009, 19, 954–960. [DOI] [PubMed] [Google Scholar]
- 48.Salbreux G, Charras G and Paluch E, Trends Cell Biol, 2012, 22, 536–545. [DOI] [PubMed] [Google Scholar]
- 49.Brawley CM and Rock RS, Proc. Natl. Acad. Sci. USA, 2009, 106, 9685–9690. [DOI] [PMC free article] [PubMed] [Google Scholar]
- 50.Kohler S, Schaller V, Bausch A et al. , Nat. Mater, 2011, 10, 462–468. [DOI] [PubMed] [Google Scholar]
- 51.Burov S, Tabei SMA, Huynh T, Murrell MP, Philipson LH, Rice SA, Gardel ML, Scherer NF and Dinner AR, Proc. Natl. Acad. Sci. USA, 2013, 110, 19689–19694. [DOI] [PMC free article] [PubMed] [Google Scholar]
- 52.Scholz M, Weirich KL, Gardel ML and Dinner AR, bioRxiv, 2018, 277947. [Google Scholar]
- 53.Scholz M, Burov S, Weirich KL, Scholz BJ, Tabei SMA, Gardel ML and Dinner AR, Phys. Rev. X, 2016, 6, 011037. [Google Scholar]
- 54.Boal DH, Mechanics of the Cell, Cambridge University Press, 2012. [Google Scholar]
- 55.Liverpool TB, Marchetti MC, Joanny J-F and Prost J, EPL (Europhys. Lett.), 2009, 85, 18007. [Google Scholar]
- 56.Banerjee S and Marchetti MC, Soft Matter, 2011, 7, 463–473. [Google Scholar]
- 57.Head DA, Levine AJ and MacKintosh FC, Phys. Rev. E, 2003, 68, 061907. [DOI] [PubMed] [Google Scholar]
- 58.Gardel M, Shin J, MacKintosh F, Mahadevan L, Matsudaira P and Weitz D, Science, 2004, 304, 1301–1305. [DOI] [PubMed] [Google Scholar]
- 59.Kim T, Hwang W, Lee H and Kamm RD, PLoS Comput. Biol, 2009, 5, e1000439. [DOI] [PMC free article] [PubMed] [Google Scholar]
- 60.Kasza KE, Koenderink GH, Lin YC, Broedersz CP, Messner W, Nakamura F, Stossel TP, MacKintosh FC and Weitz DA, Phys. Rev. E, 2009, 79, 041928. [DOI] [PubMed] [Google Scholar]
- 61.McFadden WM, McCall PM, Gardel ML and Munro EM, PLoS Comput. Biol, 2017, 13, e1005811. [DOI] [PMC free article] [PubMed] [Google Scholar]
- 62.Nédélec F, Surrey T and Maggs A, Phys. Rev. Lett, 2001, 86, 3192. [DOI] [PubMed] [Google Scholar]
- 63.Nédélec F, J. Cell Biol, 2002, 158, 1005–1015. [DOI] [PMC free article] [PubMed] [Google Scholar]
- 64.Miskin MZ, Khaira G, de Pablo JJ and Jaeger HM, Proc. Natl. Acad. Sci. USA, 2016, 113, 34–39. [DOI] [PMC free article] [PubMed] [Google Scholar]
Associated Data
This section collects any data citations, data availability statements, or supplementary materials included in this article.


