. 2018 Oct 4;7:e38874. doi: 10.7554/eLife.38874

Figure 4. The symbiotic impairment of chit5 mutants can be overcome by an M.loti R7A mutant affected in the regulation of Nod factor biosynthesis.

(A) Representative images of Gifu and chit5-1 plants inoculated with the indicated M. loti R7A strains 7 wpi. Scale bars are 1 cm. (B) Average number of pink and white nodules formed on Gifu and chit5-1 by the indicated M. loti R7A strains over 3 weeks. Error bars represent SEM and statistical comparisons of the number of pink nodules formed between strains on each genotype at each time point are shown using ANOVA and Tukey post hoc testing with p values < 0.05 as indicated by different letters. (C) Light microscopy of whole nodules 3 wpi and confocal images of nodule sections from Gifu and chit5-1 plants inoculated with the indicated strains tagged with DsRed. Scale bars are 0.5 cm. (D) Proposed model of CHIT5 activity and representative nodule images of wild-type and chit5 mutant illustrating the observed phenotype. (1) Bacteria maintain a low level of Nod factors within root hair-traversing ITs by preferential activity of NodD1. (2) and (3) Bacterial amplification inside ITs, coupled with the switch for preferential activity of NodD2 leads to higher levels of fully decorated pentameric Nod factors (LCO-V). Chit5 expression (green filled cells in wild-type) is crucial for maintaining a balanced Nod factor level enabling IT extension inside primordia, efficient bacterial endocytosis and, ultimately, development of the nitrogen-fixing organ (3). (4) In the chit5 mutants (light grey filled cells) higher levels of Nod factors (LCO-V) impede IT elongation and branching inside primordia leading to bacteria accumulation in between the cells (dotted brown line) and scattered infection.

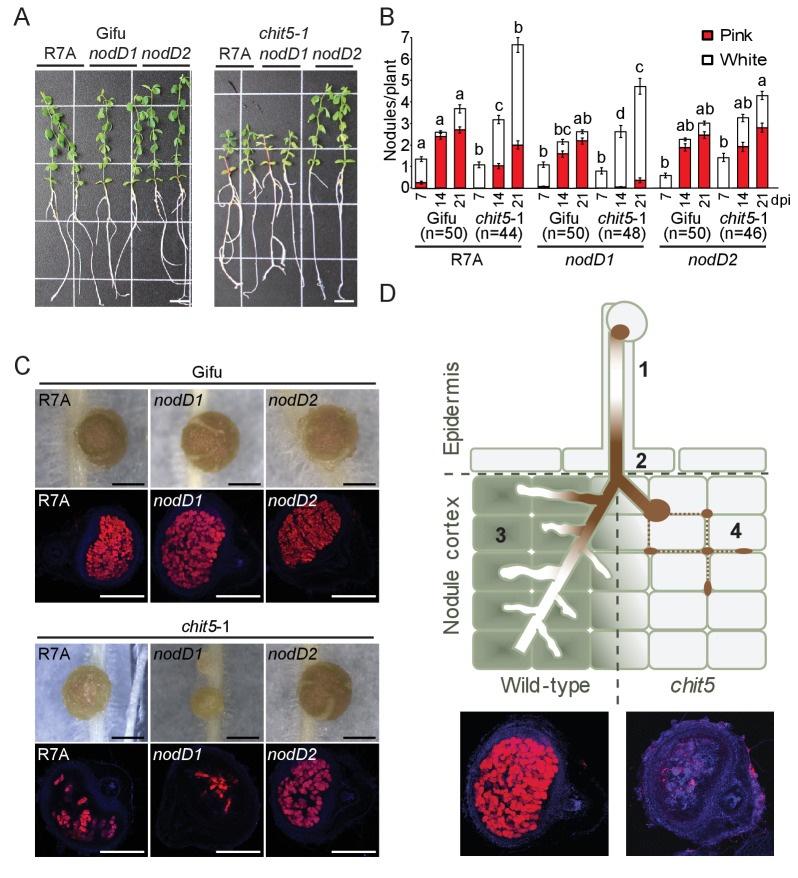
Figure 4.

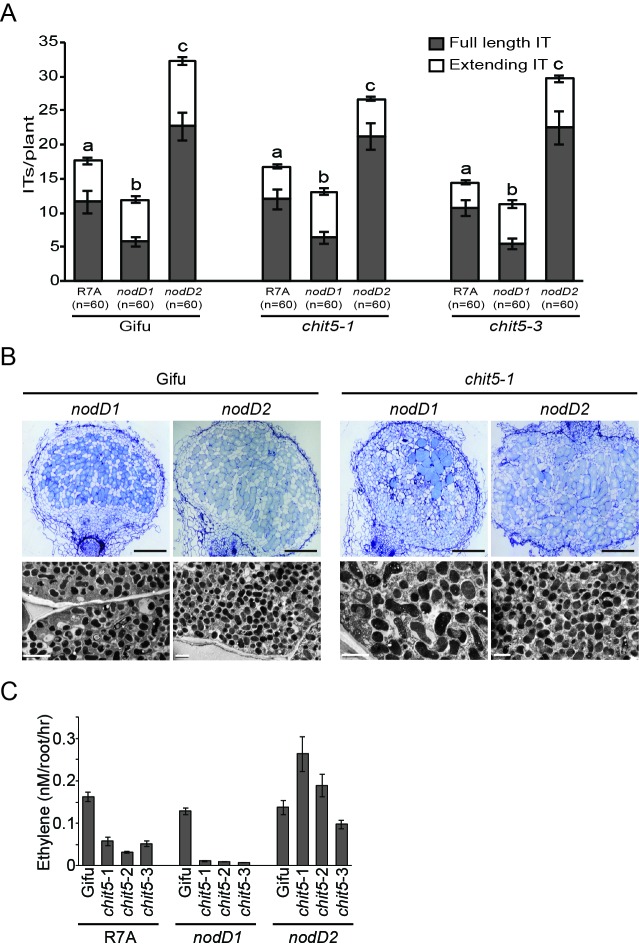
Figure 4—figure supplement 1. chit5 mutant phenotypes with M.loti R7A mutants affected in the regulation of Nod factor biosynthesis.

Figure 4—figure supplement 1.

(A) Root hair infection thread formation on the indicated genotypes with M. loti R7A strains. 20 plant roots were cut into 1 cm pieces and 60 of these were analysed per condition. Error bars represent SEM and statistical comparisons of the number of full length infection threads formed across genotypes by the different M. loti R7A strains are shown using ANOVA and Tukey post hoc testing with p values < 0.01 as indicated by different letters. (B) Light microscopy and transmission electron microscopy of nodule sections from Gifu and chit5-1 inoculated with the indicated strains. Scale bars are 200 μm for light microscopy images and 2 μm for TEM. (C) Nitrogenase activity measured as the amount of ethylene production from acetylene incubated nodules of Gifu and chit5 mutant alleles inoculated with the indicated M. loti R7A strains.

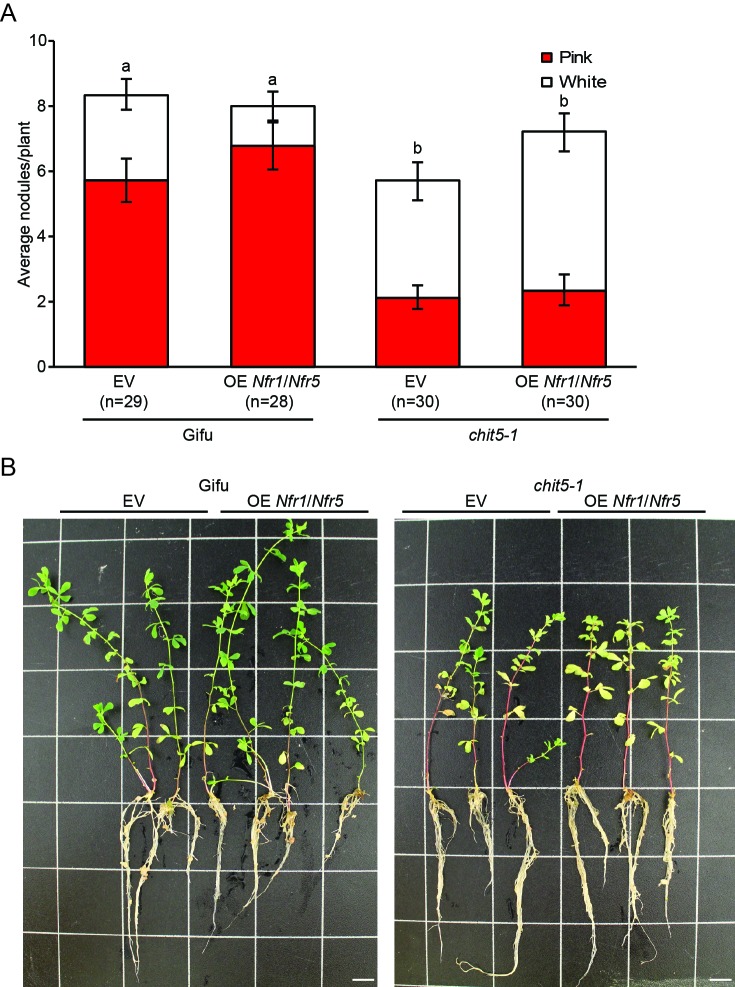
Figure 4—figure supplement 2. Overexpression of Nfr1 and Nfr5 does not rescue the symbiotic impairment of chit5-1.

Figure 4—figure supplement 2.

(A) Nodule counts on Gifu and chit5-1 plants transformed with an empty vector control or the Nfr1/Nfr5 over-expression construct 6 weeks post-inoculation with M. loti R7A. Error bars represent SEM and statistical comparisons of pink nodules formed are shown using ANOVA and Tukey post hoc testing with p values < 0.01 as indicated by different letters. (B) Representative images of Gifu and chit5-1 plants transformed with an empty vector control or the Nfr1/Nfr5 over-expression construct 6 weeks post-inoculation with M. loti R7A. Scale bars are 1 cm.

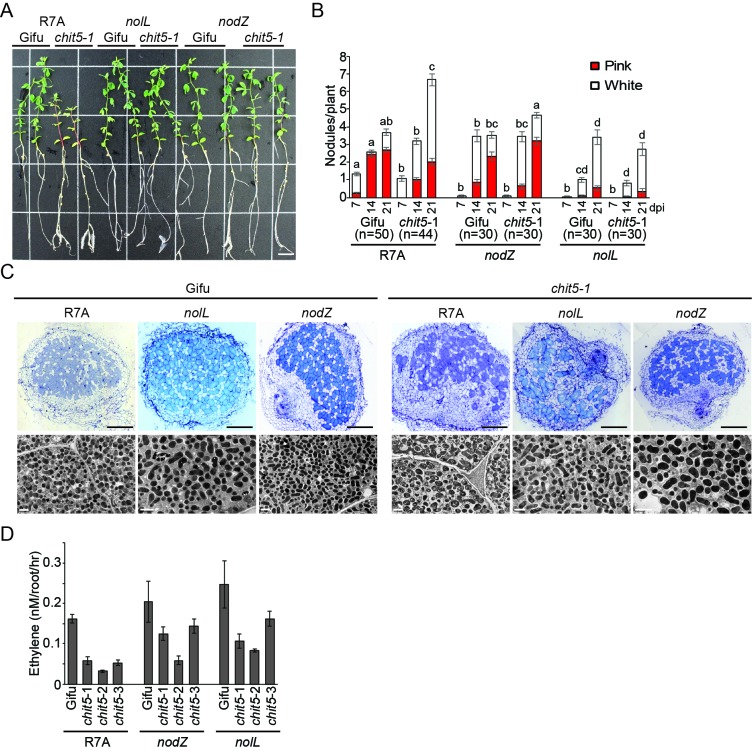
Figure 4—figure supplement 3. chit5 mutant phenotypes with M.loti R7A mutants affected in the biosynthesis of fully decorated Nod factor.

Figure 4—figure supplement 3.

(A) Representative images of Gifu and chit5-1 plants inoculated with the indicated strains 7 wpi. Scale bars are 1 cm. (B) Average number of pink and white nodules formed on Gifu and chit5-1 by the indicated M. loti R7A strains over 3 weeks. Error bars represent SEM and statistical comparisons of the number of pink nodules formed between strains on each genotype at each time point are shown using ANOVA and Tukey post hoc testing with p values < 0.05 as indicated by different letters. (C) Light microscopy and transmission electron microscopy of nodule sections from Gifu and chit5-1 inoculated with the indicated strains. Scale bars are 200 μm for light microscopy images and 2 μm for TEM. (D) Nitrogenase activity measured as the amount of ethylene production from acetylene incubated nodules of Gifu and chit5 mutant alleles inoculated with the indicated M. loti R7A strains.

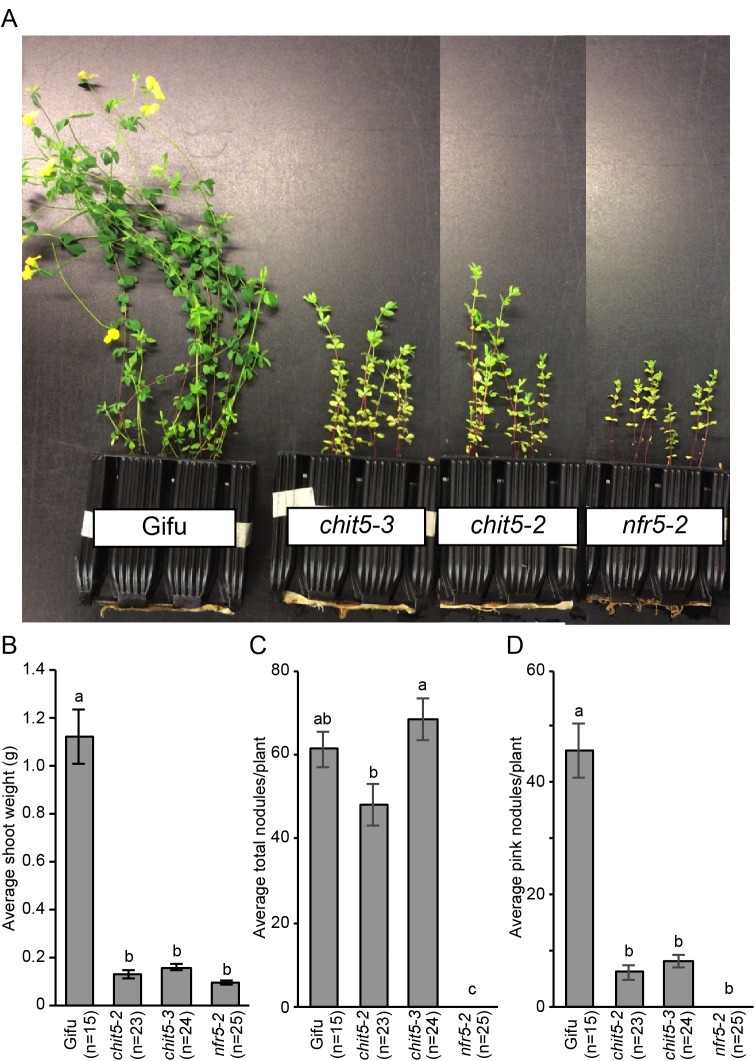
Figure 4—figure supplement 4. chit5 mutants show a nitrogen-deficient phenotype when grown in soil.

Figure 4—figure supplement 4.

(A) Plant growth of the indicated genotypes when grown in soil containing its native microbiota for 9 weeks. (B) Shoot weight of plants after 7 weeks growth in soil. (C) Counts of total nodules formed on the soil grown plants. (D) Number of pink nodules formed on the soil-grown plants. For (B), (C) and (D) error bars represent SEM and statistical comparisons between the genotypes are shown using ANOVA and Tukey post hoc testing with p values < 0.01 as indicated by different letters.

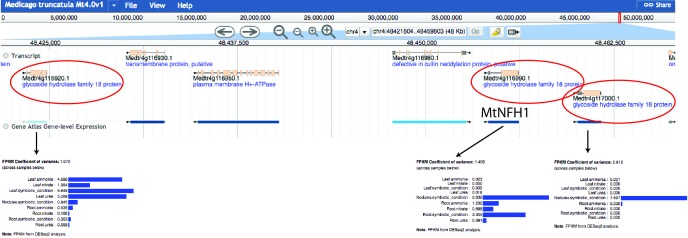
Figure 4—figure supplement 5. Genomic location and expression pattern of MtNfh1 and the two close-located paralogs.

Figure 4—figure supplement 5.

The genomic information available on Phytozome 12 (https://phytozome.jgi.doe.gov) is given according to Medicago truncatula Mt4.0v1 version of the genome, and their expression level according to Gene Atlas expression tool. The three GH18 coding genes are marked (red circle) and their expression pattern is shown.

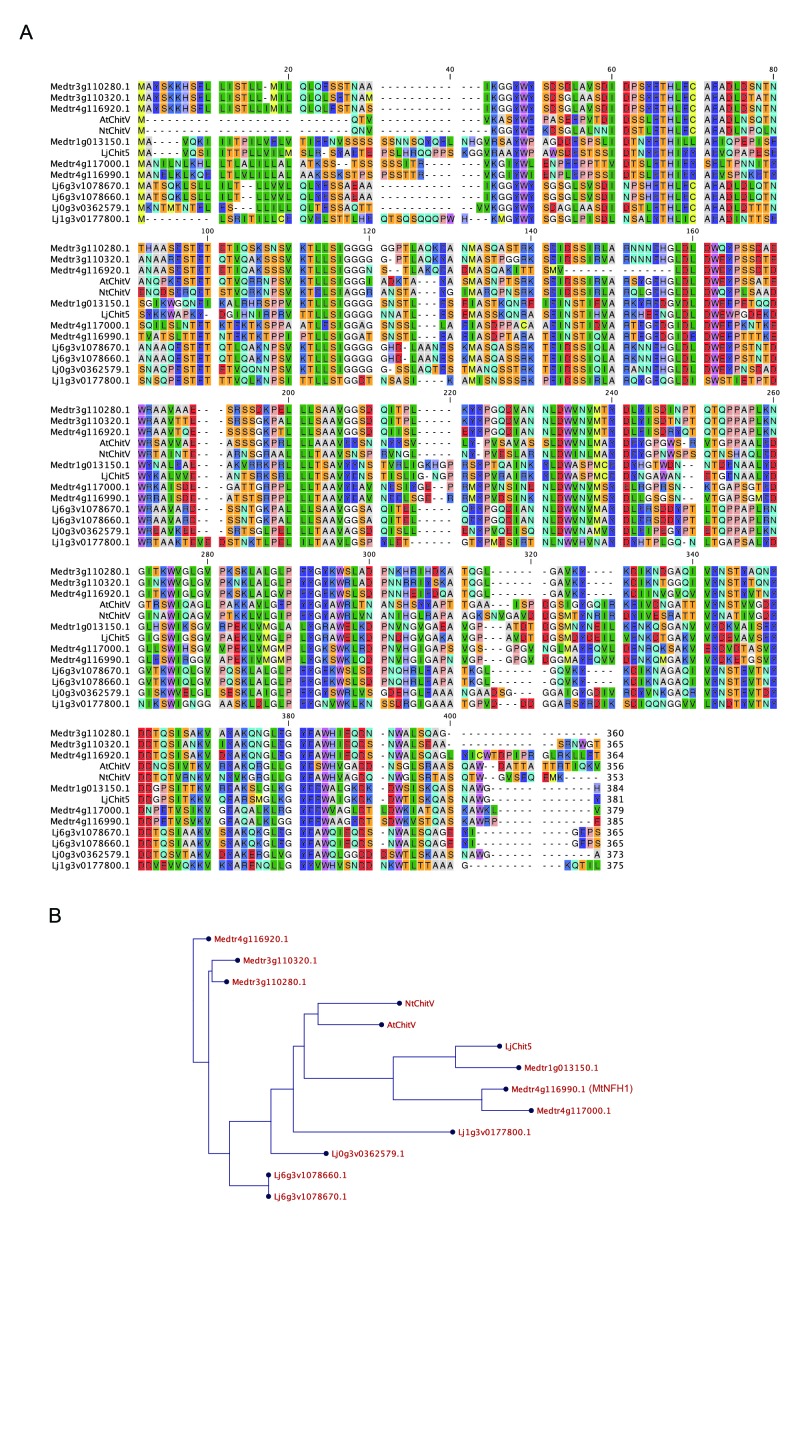
Figure 4—figure supplement 6. GH18 proteins from M.truncatula and L.japonicus.

Figure 4—figure supplement 6.

Alignment (A) and phylogenetic tree (B) of Lotus and Medicago proteins along with CHIT5 from Arabidopsis (AT4G19810.1) and Nicotiana tabaccum (XP_016468204.1). Protein sequences were obtained from https://phytozome.jgi.doe.gov, and https://lotus.au.dk/.

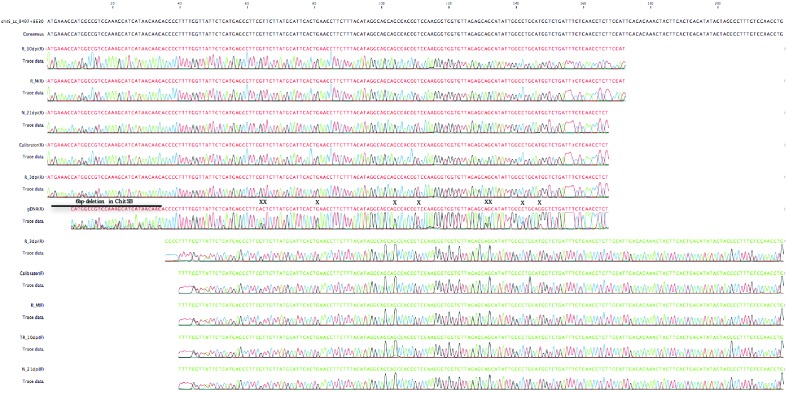
Figure 4—figure supplement 7. Sequencing traces from PCR products using genomic DNA (gDNA), cDNA from water treated roots (R_M), M.loti inoculated roots-3dpi (R_3dpi),−10dpi (R_10dpi) and nodules-21 dpi (N_21dpi) as template.

Figure 4—figure supplement 7.

Calibrator template contains a mixture of L. japonicus cDNAs from various organs and M.loti infected roots and nodules. The PCR products were sequenced with forward (F) or reverse primer (R). Note that sequences from gDNA have double peaks in the regions with nucleotide polymorphisms between chitinase paralogs (X and line), while the cDNA sequences have only one variant corresponding to Chit5.