

SUMMARY
Regulatory T cell (Treg cell) responses and apoptotic cell clearance (efferocytosis) represent critical arms of the inflammation resolution response. We sought to determine whether these processes may be linked through Treg cell-mediated enhancement of efferocytosis. In zymosan-induced peritonitis and LPS-induced lung injury, Treg cells increased early in resolution, and Treg cell depletion decreased efferocytosis. In advanced atherosclerosis, where defective efferocytosis drives disease progression, Treg cell expansion improved efferocytosis. Mechanistic studies revealed the following sequence: (i) Treg cells secreted interleukin (IL)-13, which stimulated IL-10 production in macrophages; (ii) autocrine signaling by IL-10 induced Vav1 in macrophages; and (iii) Vav1 activated Rac1 to promote apoptotic cell engulfment. In summary, Treg cells promote macrophage efferocytosis during inflammation resolution via a transcellular signaling pathway that enhances apoptotic cell internalization. These findings suggest an expanded role of Treg cells in inflammation resolution and provide a mechanistic basis for Treg cell-enhancement strategies for non-resolving inflammatory diseases.
eTOC Blurb

Regulatory T cells cells suppress inflammation and promote tissue repair in multiple contexts. Proto, Doran and colleagues show that Treg cells enhance the ability of macrophages to engulf apoptotic cells (efferocytosis) and thereby promote resolution of inflammation.
INTRODUCTION
A program known as inflammation resolution dampens inflammation and promotes tissue repair during and following the host response to pathogens and tissue injury (Buckley et al., 2014). Resolution is mediated by protein and lipid mediators secreted by inflammatory cells. These mediators bind specific receptors on effector cells, notably leukocytes and myofibroblasts, leading to the activation of various resolution and repair pathways. A key process in the resolution response is the phagocytosis of apoptotic cells, known as efferocytosis, which prevents apoptotic cells from becoming necrotic and pro-inflammatory (Godson et al., 2000; Buckley et al., 2014; Arandjelovic and Ravichandran, 2015). Proresolving mediators have been shown to promote efferocytosis in cultured macrophages and in a variety of disease models in vivo, including acute peritonitis, lung injury, and atherosclerosis (Serhan et al., 2015). Moreover, signaling through certain efferocytosis receptors can inhibit inflammatory signaling pathways and promote the secretion of resolution mediators (Fadok et al., 1998; Freire-de-Lima et al., 2006; Cai et al., 2016). Thus, efferocytosis plays a critical, amplifying role in the resolution response, acting as both an effector and a source of resolution mediators.
The role of T cells in resolution is emerging as a critically important topic, with most studies focused on how resolving mediators affect T cell biology. For example, lipoxins and T helper-2 (Th2) cell-derived protectin D1 suppresses T cell pro-inflammatory cytokines and infiltration into inflammatory sites (Buckley et al., 2014). Conversely, pro-inflammatory leukotriene B4 (LTB4) has been shown to dose-dependently decrease the differentiation of naïve T cells into Treg cells, favoring instead the generation of Th17 cells (Chen et al., 2009). The topic of Treg cells is highly relevant, because they secrete proteins, such as interleukin-10 (IL-10) and amphiregulin, that promote tissue repair (D’Alessio et al., 2009; Weirather et al., 2014; Arpaia et al., 2015). However, remarkably little is known about how specific resolution processes are affected by Treg cells. In this context, we sought to identify whether Treg cells can promote efferocytosis and, if so, to elucidate key mechanisms. We now show both in vitro and in vivo that Treg cells can indeed boost the ability of macrophages to carry out efferocytosis during resolution responses. A key mechanistic component involved induction of IL-10 in macrophages by Treg cell-derived interleukin-13 (IL-13). IL-10, via an autocrine-paracrine pathway that affected the guanine nucleotide exchange factor (GEF) Vav1 and the GTPase Rac1, enabled macrophages to optimally internalize apoptotic cells. Enhancement of macrophage efferocytosis by Treg cells was evident in three models of inflammation, including atherosclerosis, a critically important disease process characterized by defects in Treg cells, efferocytosis, and resolution. These findings reveal a specific role for Treg cells in inflammation resolution and tissue repair and thereby add to the mechanistic basis for the development of Treg-enhancing therapy for chronic inflammatory diseases.
RESULTS
Treg cell depletion reduces the efferocytic capacity of peritoneal macrophages during resolution of inflammation
To test the hypothesis that Treg cells promote efferocytosis during inflammation resolution, we began with a well-established model of acute inflammation and its resolution, zymosan-induced peritonitis. Low dose zymosan (0.1 mg) elicits a neutrophil-mediated inflammatory response, followed by a decrease in neutrophil numbers and a sharp increase in Treg cells (Newson et al., 2014). We reasoned that this two-phase response might involve Treg cell-mediated enhancement of efferocytosis of dying neutrophils by macrophages during the resolution phase. Accordingly, we asked whether Treg cell depletion at the onset of resolution would reduce macrophage efferocytic capacity in this model. To accomplish this goal, we depleted Treg cells by injecting diphtheria toxin (DT) into mice expressing the human DT receptor driven by the Foxp3 promoter (Foxp3-hDTR mice) (Saito et al., 2001). DT or PBS was given on days 4, 6, and 8 post-zymosan. On day 11, when Treg cell numbers typically peak (Newson et al., 2014), we found that peritoneal fluid Treg cells were markedly depleted in DT-treated mice (Figure 1A). In contrast, macrophage numbers were not statistically different between the two groups of mice (Figure 1B). In order to evaluate the efferocytic capacity of peritoneal macrophages in vivo, we injected the peritoneum with fluorescently labeled apoptotic neutrophils. Forty-five minutes later, the peritoneal cells were collected by lavage and analyzed by flow cytometry. Uptake of the injected apoptotic neutrophils by peritoneal F4/80+ macrophages in the Treg cell-depleted mice was reduced by ~50% compared with PBS-treated control mice (Figure 1C). These data suggest that Treg cells play an important role in the clearance of apoptotic cells during the resolution phase of zymosan-induced peritonitis.
Figure 1. Treg cell depletion following zymosan-induced peritonitis reduces the efferocytic capacity of peritoneal macrophages.
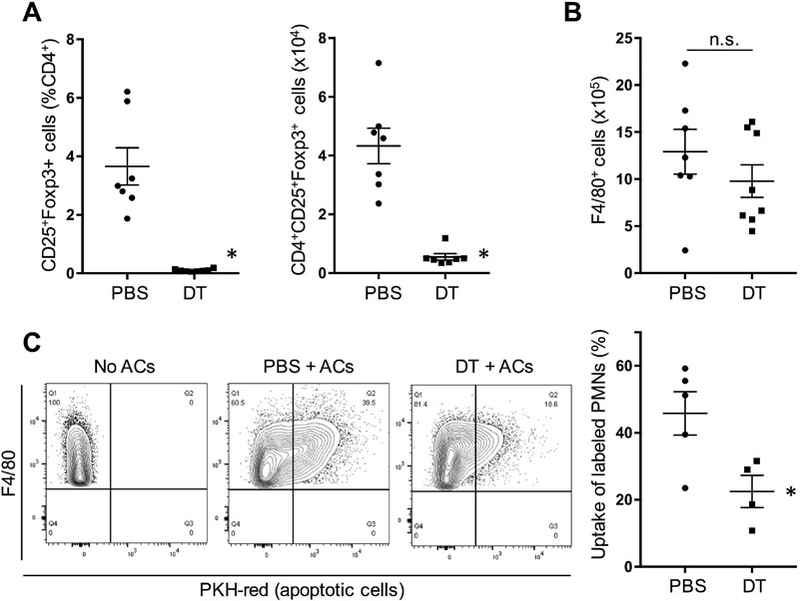
Foxp3-human DTR mice were injected i.p. with 0.1 mg zymosan at day 0 and then with 50 µg/kg DT at day 4 and 15 µg/kg DT at days 6 and 8. The vehicle control for DT was PBS. (A-B) Peritoneal lavage fluid of one cohort of DT and PBS mice sacrificed at day 11 was analyzed for Treg cells as either percent of CD4 that were CD25+ Foxp3+ or as absolute number per mouse and for the total number of peritoneal F4/80+ macrophages (n = 7 mice per group; *P < 0.05, 2-tailed Student’s t test; n.s., nonsignificant). Data displayed represent one of 5 independent experiments and are means + SEM. (C) At day 11, another cohort of DT and PBS mice was injected i.p. with PKH-red-labeled apoptotic neutrophils (ACs), and 45 min later lavage fluid was analyzed by flow for the percentage of F4/80+ macrophages that had incorporated the labeled neutrophils (n = 4–5 mice per group; *P < 0.05, 2-tailed Student’s t test). Data displayed represent one of 2 independent experiments and are means + SEM.
Treg cell depletion during the resolution phase after acute lung injury (ALI) reduces efferocytosis by airspace macrophages
Treg cells are required for timely inflammation resolution in lipopolysaccharide (LPS)-induced ALI (D’Alessio et al., 2009). Moreover, murine models and clinical data suggest that efficient efferocytosis following injury is critical for lung repair (Schmidt and Tuder, 2010). In order to determine whether Treg cells promote macrophage efferocytosis during ALI, we subjected Foxp3-hDTR mice to LPS-induced ALI. Mice were treated with intranasal LPS on day 0 and then given DT injections (or PBS) on day 1 or on days 1, 3, and 5. To first validate the model, we showed that DT treatment on day 1 caused marked depletion of FoxP3+ Treg cells by day 4 in both bronchoalveolar lavage (BAL) fluid and in whole lung tissue (Figures 2A-B). Of note, Treg cell depletion did not affect the number of resident alveolar (F4/80+CD11chighSiglecF+) or exudate (F4/80+CD11chighSiglecF-) macrophages (Figure 2C) and did not lead to any changes in blood leukocyte numbers (Figure S1A). In the experiment in which mice were injected with PBS or DT on days 1, 3, and 5, histopathologic injury scoring (Matute-Bello et al., 2011) by a blinded observer revealed that there was a trend toward improvement in the control mice between days 4 and 7 based on neutrophil numbers in alveolar and interstitial spaces, airway debris, and alveolar septal thickening (Figures S1B-C). This improvement was not seen in the Treg cell-depleted mice, resulting in a significantly worse histological score in these mice compared with control mice at day 7.
Figure 2. Treg cell depletion decreases efferocytosis by macrophages in LPS-induced acute lung injury (ALI).
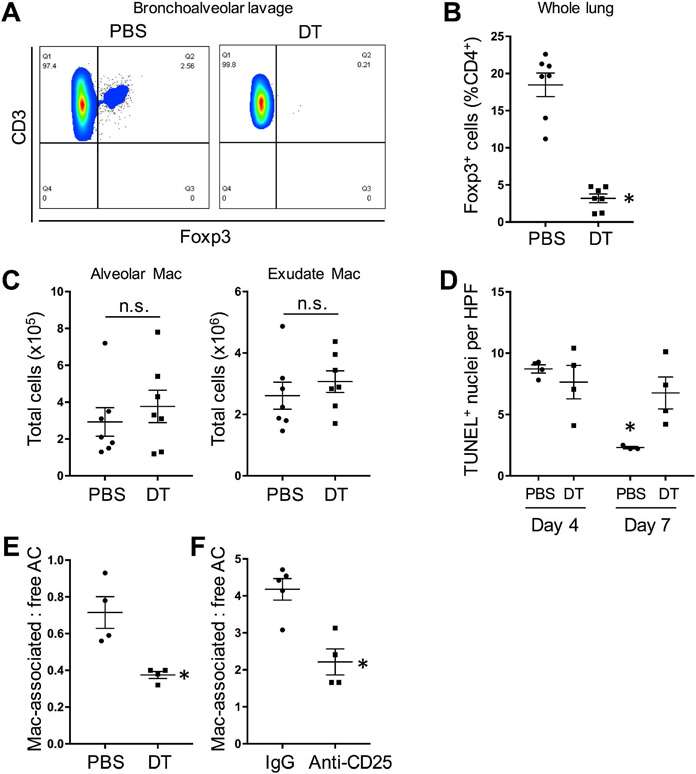
Foxp3-human DTR mice were treated with intranasal LPS on day 0 and then given DT injections (or PBS) on day 1 (A-C, E) or days 1, 3, and 5 (D). (A) Representative flow cytometry plots of Foxp3+ Treg cells in the bronchoalveolar lavage fluid of PBS- and DT-treated mice at day 4. Data displayed represent one of 3 independent experiments. (B) Quantification of percent of Foxp3+ T cells in whole lung of PBS- and DT-treated mice at day 4 (n = 7 mice per group; *P < 0.05, 2-tailed Student’s t test). Data are represented as means + SEM. (C) Quantification of alveolar and exudate macrophages (Mac) of PBS- and DT-treated mice at day 4 (n = 7 mice per group; n.s., not significant by 2-tailed Student’s t test). (D) Quantification of TUNEL+ cells in lung sections per high-power field (HPF) of mice at days 4 and 7 (n = 3–4 mice per group; *P < 0.05 vs. all other groups, two-way ANOVA, Sidak’s multiple comparisons test). Data are represented as means + SEM. (E) Quantification of day 4 lung tissue for TUNEL+ apoptotic cells (AC) that were either associated with F4/80+ macrophages or not associated with macrophages (“free”) (n = 4 mice per group; *P < 0.05, 2-tailed Student’s t test). Data are represented as means + SEM. (F) As in (E), except Treg cells were depleted in LPS-ALI wild-type mice using anti-CD25 antibody (with IgG as control), as described in Methods; see Supplemental Figure 2 (n = 4–5 mice per group; *P < 0.05, 2-tailed Student’s t test). Data displayed represent one of 2 independent experiments and are means + SEM. Please also see Figure S1.
As a prelude to assaying efferocytosis, we assayed dead cell content in the above day-13-5 DT experiment and found that the number of apoptotic cells, assessed by terminal deoxynucleotidyl transferase-mediated dUTP nick end-labeling (TUNEL), declined between days 4 and 7 in control mice, consistent with efficient efferocytosis. In contrast, the number of apoptotic cells remained elevated in Treg-depleted mice at day 7 (Figure 2D). To directly examine efferocytosis in day 4 lung tissue, we quantified the ratio of TUNEL+ nuclei (dead cells) that were associated with Mac-3+ macrophages to dead cells that were not associated with macrophages (“free”) (Thorp et al., 2008). The data show that Treg cell depletion significantly reduced efferocytosis (Figures 2E and S1D top). A similar result was obtained when Treg cell depletion was accomplished using anti-CD25 antibody treatment of wild-type mice (Sutmuller et al., 2001), i.e., rather than DT treatment of Foxp3-human DTR mice (Figures 2F, S1D bottom, and S1E). Because acute depletion of Treg cells can activate adaptive immune responses that might impair efferocytosis, we conducted an ALI experiment in Rag1−/− mice, which lack mature B and T cells. Compared with efferocytosis in the lungs of WT mice, efferocytosis was lower in the lungs of Rag1−/− mice, which lack Treg cells. These data are consistent with the results above using DT-treated Foxp3-hDTR mice. Moreover, partial Treg cell reconstitution in the lungs of Rag1−/− mice partially improved efferocytosis by lung macrophages. (Figure S1F-G). Thus, as with peritonitis, Treg cells promote efferocytosis in ALI, and this process is independent of B cells and effector T cells.
Treg cell depletion disrupts apoptotic cell internalization and Rac1 activation in macrophages
In preparation for mechanistic studies of how Treg cell depletion decreases efferocytosis, we first determined whether we could recapitulate the Treg cell depletion-mediated defect in efferocytosis ex vivo. To that end, peritoneal macrophages were isolated from PBS- or DT-treated Foxp3-hDTR mice 11 days after zymosan and then incubated ex vivo with fluorescently labeled apoptotic cells at 37oC. The macrophages from DT-treated mice showed decreased efferocytosis compared with macrophages from the control mice (Figure 3A, left). We next conducted this experiment at 4oC, which allows apoptotic cell binding but prevents uptake. Macrophages from control and DT mice showed equal apoptotic cell binding (Figure 3A, right), suggesting that the defect in efferocytosis in macrophages from Treg cell-depleted mice was due to impaired engulfment, not binding, of apoptotic cells.
Figure 3. Macrophages from Treg cell-depleted mice show decreased AC uptake subsequent to binding and impaired Rac1 activation.

(A) Macrophages were isolated at day 11 from the peritoneal lavage fluid of zymosan-treated Foxp3-hDTR mice treated with PBS or DT, as in Figure 1. The cells were then incubated with labeled apoptotic cells at 37oC or 4oC (n = 4 mice per group; *P < 0.05, n.s., not significant by 2-tailed Student’s t test). Data displayed represent one of 2 independent experiments and are means + SEM. (B) A similar set of macrophages was incubated with or without polystyrene beads for 15 mins and then assayed for GTP-bound Rac1 (n = 4 mice per group; *P < 0.05 vs. all other groups, two-way ANOVA, Sidak’s multiple comparisons test). Data displayed represent one of 2 independent experiments and are means + SEM. (C) Bone marrow-derived macrophages were incubated with or without splenic Treg cells for 48 h and then assayed for efferocytosis (37oC) or apoptotic cell binding (4oC) (n = 3 wells; *P < 0.05, n.s., not significant by 2-tailed Student’s t test). Data displayed represent one of 3 independent experiments and are means + SEM. (D) As in C, except GTP-bound Rac1 was assayed before or 5 or 10 min after the addition of beads (n = 4 wells; *P < 0.05 vs. PBS/time 0 and **P < 0.05 for Treg cell vs. Veh, two-way ANOVA, Sidak’s multiple comparisons test). Data displayed represent one of 2 independent experiments and are means + SEM. Please also see Figure S2.
Apoptotic cell engulfment converges on Rho-family GTPase activation, which induces cytoskeletal rearrangement. In particular, Rac1 has been shown to be critical for apoptotic cell engulfment as well as for the internalization of other phagocytic cargo (Ravichandran and Lorenz, 2007). Rac1-GTP increases early after apoptotic cell recognition by membrane receptors, and active Rac1 is recruited to the phagocytic cup where it promotes F-actin assembly. Thus, we questioned whether macrophages from Treg cell-depleted mice might have decreased GTP-bound Rac1, a measure of Rac1 activity, during phagocytosis. In pilot experiments, we found a high degree of variability in the Rac1 activity assay in macrophages incubated with apoptotic cells, perhaps due to effects of proteins in the apoptotic cells themselves. We reasoned that using inert beads as the phagocytic substrate might minimize this problem. We first determined whether macrophages from DT-treated mice had a defect in polystyrene bead uptake ex vivo, which indeed was the case (Figure S2A). Using this model, we compared Rac1 activation in macrophages from control and DT mice. Whereas GTPbound Rac1 was significantly increased 20 min after addition of beads in control macrophages, the bead-induced increase in Rac1 activation was completely abrogated in macrophages from Treg cell-depleted DT mice (Figure 3B). Thus, preventing macrophages from being exposed to Treg cells during resolution impairs efferocytosis and phagocytosis-associated Rac1 activation.
We next asked whether a Treg cell-macrophage co-culture model could recapitulate some of these findings. For this purpose, bone marrow-derived macrophages were incubated for 48 h with or without splenic Treg cells (Figure S2B) and then assayed for the uptake of fluorescently labeled apoptotic Jurkat cells and for bead-induced Rac1 activation. Consistent with the previous data, Treg cells enhanced apoptotic cell uptake without altering binding and increased bead-induced Rac1 activation (Figure 3C-D). We also investigated whether Treg cell-macrophage co-culture would induce other changes in the macrophages suggestive of a more pro-resolving phenotype. Moreover, Treg cells led to an upregulation in macrophages of mRNAs for genes associated with resolution, including Arg1, Retnla (Fizz1), and Mrc1 (CD206) (Figure S2C). We also compared mRNA from peritoneal macrophages obtained from mice either at day 8 post-zymosan, which is prior to the influx of Treg cells, with macrophages at day 10, which is the time when Treg cell influx into the peritoneum reaches its peak. Day 10 macrophages showed decreased expression of the pro-inflammatory genes Il1b and Il6 and increased expression of the pro-resolving gene Mrc1 (CD206), and there were trends toward decreased Tnfa and increased Arg1 (Figure S2D). In summary, Treg cells can directly enhance the ability of macrophages to internalize apoptotic cells or a non-cellular phagocytic substrate, and this action of Treg cells is associated with activation of Rac1. In line with the role of efferocytosis in resolution, Treg cells may also shift the phenotype of macrophages toward a more general pro-resolving functional state.
Enhancement of efferocytosis by Treg cells involves Treg cell-induced macrophage IL10 production
A number of secreted molecules have been described to be important for Treg cell function, including IL-10 (Arpaia et al., 2015). Because IL-10 enhances efferocytosis by macrophages (Ogden et al., 2005; Michlewska et al., 2009; Michalski et al., 2016), we investigated whether it was required for Treg cell-mediated enhancement of macrophage efferocytosis. Using the zymosan peritonitis model, we first compared the efferocytic capacity of peritoneal macrophages from Il10−/− and wild-type (WT) mice in vivo. On day 11 post-zymosan injection, WT and Il10−/− mice were injected i.p. with fluorescently labeled apoptotic neutrophils, and, after 45 min, uptake of the labeled cells by exudate macrophages was evaluated by flow cytometry. We found that apoptotic cell uptake was decreased in Il10−/− mice compared with WT mice (Figure 4A). Of note, there was no difference in the percentage of peritoneal Treg cells (CD4+CD25+) between WT and Il10−/− mice (Figure S3A). As further validation, a neutralizing anti-IL-10 antibody injected i.p. 48 hours prior to the harvest of peritoneal macrophages also caused a reduction in ex vivo efferocytosis (Figure 4B).
Figure 4. Treg cell-mediated enhancement of efferocytosis requires macrophage IL-10 expression.

(A) Efferocytosis of i.p.-injected labeled neutrophils was assayed at day 11 in zymosan-treated wild-type (WT) or Il10−/− mice as in Figure 1C (n = 9–10 mice per group; *P < 0.05, 2-tailed Student’s t test). Data are represented as means + SEM. (B) WT mice were injected i.p., with neutralizing antibody to IL-10 or control IgG, and 48 hours later, peritoneal macrophages were harvested and then assayed for efferocytosis ex vivo (n = 3 wells per condition; *P < 0.05, 2-tailed Student’s t test). Data are represented as means + SEM. (C) WT mice were injected i.p. with Treg cells from WT or Il10−/− mice or vehicle control (PBS). Peritoneal macrophages from these mice were than assayed for efferocytosis ex vivo (n = 5 mice per group; *P < 0.05 vs. PBS; n.s., non-significant, one-way ANOVA, Tukey’s post-hoc analysis). Data displayed represent one of 2 independent experiments and are means + SEM. (D) Bone marrow-derived macrophages from WT, or Il10−/− mice were incubated with or without splenic Treg cells from WT mice and then assayed for efferocytosis in vitro as in Figure 3C (n = 3 wells; *P < 0.05 vs. all other groups, two-way ANOVA, Sidak’s multiple comparisons test). Data are represented as means + SEM. (E) Bead-induced GTP-bound Rac1 was assayed in WT or Il10−/− macrophages incubated with or without Treg cells, as in Figure 3D (n = 4 wells; *P < 0.05 vs. no beads and **P < 0.05 for the indicated pairings, two-way ANOVA, Sidak’s multiple comparisons test). Data displayed represent one of 2 independent experiments and are means + SEM. (F) WT or Il10−/− bone marrow-derived macrophages were incubated with or without Treg cells and then assayed for Il10 mRNA (n = 3–4 wells; *P < 0.05, 2-tailed Student’s t test) or Bcl3 mRNA (n = 3–4 wells, *P < 0.05 vs. all other groups, two-way ANOVA, Sidak’s multiple comparisons test). Data are represented as means + SEM. (G) Bone marrow-derived macrophages were pre-treated for 48 h with the indicated concentrations of rIL-10 and then assayed for efferocytosis (n = 3 wells; *P < 0.05 vs. Veh, one-way ANOVA, Tukey’s post-hoc analysis). Data are represented as means + SEM. (H) Bone marrow-derived macrophages were pre-treated for 48 h with 10 ng/ml rIL-10 and then assayed for GTP-bound Rac1 10 mins after exposure to beads as in Figure 4D (n = 3 wells; *P < 0.001 vs. no beads and **P < 0.001 for rIL-10 vs. Veh, two-way ANOVA, Sidak’s multiple comparisons test). Data displayed represent one of 2 independent experiments and are means + SEM. Please also see Figure S3.
To determine whether Treg cells were the source of efferocytosis-enhancing IL-10, we injected WT or Il10−/− splenic Treg cells into the peritoneum of naïve WT mice. After 3 days, macrophages harvested from the peritoneal exudates of these mice were assayed for uptake of labeled apoptotic cells. We found that that injection with WT and Il10−/− Treg cells enhances subsequent ex vivo efferocytosis similarly (Figure 4C), suggesting that IL-10 production by Treg cells is dispensable for this process. We next tested whether expression of IL-10 by macrophages was required for the ability of Treg cells to enhance efferocytosis. For this purpose, WT and Il10−/− bone marrow-derived macrophages were cultured with WT splenic Treg cells and then assayed for efferocytosis in vitro. Whereas Treg cells enhanced efferocytosis in WT macrophages as expected, they did not have this effect on Il10−/− macrophages (Figure 4D) or in macrophages from mice lacking the β subunit of the IL10 receptor (Il10rb−/−), which is required for IL-10 signaling (Spencer et al., 1998) (Figure S3B). Similar results were found when the endpoint of this assay was bead-mediated Rac1 activation (Figure 4E). Thus, Treg cell-mediated enhancement of efferocytosis requires macrophages to express both IL-10 and the IL-10 receptor, suggesting an autocrine pathway in macrophages in which Treg cell-stimulated macrophage IL-10 production enhances apoptotic cell internalization by IL-10-mediated Rac1 activation.
To provide further support for this hypothesis, we showed that incubation of cultured macrophages with Treg cells markedly increased the expression of Il10 mRNA in the macrophages and the expression of the macrophage IL-10 target gene Bcl3 in WT but not Il10−/− macrophages (Figure 4F). Consistent with the findings above, Treg cell-induced Il10 and Bcl3 in macrophages did not depend on IL-10 expression by the Treg cells (Figure S3C-D). Finally, incubation of macrophages with recombinant IL-10 enhanced efferocytosis without increasing apoptotic cell binding (Figure 4H and S3E) and increased Rac1 activation (Figure 4H). IL-10 also enhanced efferocytosis in human macrophages (Figure S3F). These combined data support a mechanism in which Treg cells send a transcellular signal that induces Il10 in macrophages, which then acts in an autocrine-paracrine manner to enhance Rac1-mediated apoptotic cell internalization.
The Treg cell-IL-10-efferocytosis pathway is functional in a complex inflammatory disease model
In atherosclerosis, the disease process underlying the leading causes of death in the industrialized world, defective efferocytosis and decreased Treg cells drive disease progression, but these two processes have not been previously linked (Schrijvers et al., 2005; Yurdagul, Jr. et al., 2017; Ait-Oufella et al., 2006). In this context, we focused on the specific question as to whether expansion of Treg cells during advanced atherosclerosis progression can promote lesional efferocytosis in an IL-10-dependent manner. Twelve-week Western diet (WD)-fed Ldlr−/− mice, which develop aortic root atherosclerotic lesions with defective efferocytosis (Thorp et al., 2008), were treated with IL-2 complex (IL-2C) consisting of recombinant IL-2 and anti-IL-2 monoclonal antibody to expand Treg cells (Boyman et al., 2006; Dinh et al., 2012; Foks et al., 2011). The complex was administered for three consecutive days and then once every five days thereafter for a 3-week period, during which the WD was continued. Some of the mice were also treated twice weekly during this 3-week period with an anti-IL-10 neutralizing antibody, with the rest of the mice receiving control IgG antibody. Five days after the initiation of IL-2C treatment, there was >5-fold elevation of circulating Treg cells, and this was unaffected by anti-IL-10 co-administration (Figure 5A). At the time of sacrifice, Treg cells were also significantly higher in the spleens of IL-2C-treated mice (Figure 5B). We also measured phospho-STAT3 in splenocytes by flow cytometry as a measure of IL-10 bioactivity and found that this endpoint was significantly increased by IL-2C but not by the combination of IL-2C and anti-IL-10 (Figure 5C).
Figure 5. Treg cell expansion improves lesional efferocytosis in Western diet (WD)-fed Ldlr−/− mice in an IL-10-dependent manner.

Ldlr−/− mice were fed WD for 12 weeks and then treated with a complex of recombinant IL-2 and anti-IL2 (IL2C) or vehicle control for 3 consecutive days and then once every five days thereafter for a 3-week period, during which time the mice were continued on WD. The mice were also treated twice weekly with an IL-10 neutralizing antibody (nAb) or an IgG control antibody during this 3-week period. (A-B) Circulating Treg cells 5 days after initiation of the treatment and splenic Treg cells 3 weeks after antibody treatment in the four groups of mice (n = 7–13 mice per group; *P < 0.05 vs. groups without IL-2C, one-way ANOVA, Sidak’s multiple comparisons test). Data are represented as means + SEM. (C) Splenocytes from the four groups of mice were assayed for phospho-STAT3 by flow cytometry and quantified as mean fluorescence intensity (MFI) (n = 7–13 mice per group; *P < 0.05 vs. all other groups, one-way ANOVA, Sidak’s multiple comparisons test). Data are represented as means + SEM. (D) Aortic root lesions of the four groups of mice were assayed for in situ efferocytosis by quantifying the ratio of apoptotic cells (AC) that were associated with lesional macrophages or free (n = 7–13 mice per group; *P < 0.05 vs. all other groups, one-way ANOVA, Sidak’s multiple comparisons test). Data are represented as means + SEM. Please also see Figure S4.
Treg cell expansion with or without IL-10 neutralization had no effect on body weight, plasma cholesterol, plasma triglycerides, or fasting glucose (Figure S4A-D). Moreover, as expected for this short treatment period, there were no differences in lesional area or macrophage content among the four groups (Figures S4E-F). However, as predicted by the hypothesis, IL-2C treatment significantly improved the ratio of macrophage-associated:free apoptotic cells, indicating enhanced efferocytosis, and this improvement was abrogated by IL10 neutralization (Figure 5D). The improvement in efferocytosis in the IL-2C group (2nd group), and the prevention of this effect in the anti-IL-10 group (3rd group), could not be explained by changes in cell death, because the number of total TUNEL+ lesional cells was similar among these 3 groups (Figure S4G). Although the number of apoptotic cells was modestly higher in the lesions of mice treated with anti-IL-10 alone (4th group), the data in Figure 5D show that lesional efferocytosis was similar in this group compared with the control group (representative images shown in Figure S4H). These data support the concept that Treg cell expansion can enhance efferocytosis in an IL-10-dependent manner in a critically important disease model that encompasses both decreased Treg cells and defective efferocytosis.
Treg cell-derived IL-13 stimulates IL-10 production and efferocytosis by macrophages
To determine how Treg cells might stimulate macrophages to produce IL-10, we considered a number of Treg cell-derived secretory molecules and focused on interleukin-13 (IL-13) as a candidate (Ochoa-Reparaz et al., 2008; Kambayashi et al., 1996; Hutchins et al., 2012). We first showed that stimulation of IL-2-treated CD25+ Treg cells with CD3 and CD28 increased both Il13 mRNA (Figure S5A) and secreted IL-13 protein (Figure 6A). Next, incubation of macrophages with recombinant IL-13 induced Il10 and enhanced efferocytosis in an IL-10 receptor-dependent manner (Figure 6B-C). Most importantly, Treg cells from Il13−/− mice, unlike WT Treg cells, did not significantly increase efferocytosis above that seen with no Treg cells (Figure 6D, left). Similar findings were obtained when a Transwell system was used to separate the macrophages and Treg cells, indicating that Treg cell-macrophage contact was not needed for Treg cell-induced efferocytosis in macrophages (Figure 6D, right), and when an anti-IL-13 neutralizing antibody was used instead of Il13−/− Treg cells (Figure S5B). However, when IL-13 was silenced in macrophages, WT Treg cells still enhanced macrophage IL-10 expression (Figure S5C), indicating that Treg cell-derived IL-13 rather than macrophagederived IL-13 is important in this pathway. Finally, we examined the effect of WT and Il13−/− Treg cells on the uptake of polystyrene beads, live cells, and heat-induced necrotic cells. As with apoptotic cells, Treg cells increased the uptake of polystyrene beads in an IL-13-dependent manner (Figure S5D, left graph), which is consistent with the finding that Treg cells stimulate efferocytosis via Rac1-mediated internalization. As expected, there was no detectable uptake of live cells by macrophages, and this did not change when Treg cells were added. Necrotic cell uptake by macrophages was substantial even without co-culture with Treg cells and was not further enhanced by Treg cells (Figure S5D, right graph).
Figure 6. Treg cell-derived IL-13 stimulates macrophage efferocytosis in an IL-10-dependent manner.

(A) Treg cells were isolated from spleens of wild type mice and incubated with the indicated stimuli overnight. Concentrated cell supernatants were assayed for IL-13 by ELISA (n = 3 wells; *P < 0.001, 2-tailed Student’s t test). Data displayed represent one of 3 independent experiments and are means + SEM. (B) Bone marrow-derived macrophages were incubated with the indicated concentrations of rIL-13 for 2 hours and then assayed for Il10 mRNA (n = 4 wells; *P < 0.05 vs. Veh, one-way ANOVA, Sidak’s multiple comparisons test). Data are represented as means + SEM. (C) Bone marrow-derived macrophages from WT or Il10rb−/− mice were incubated for 2 days with 10 ng/ml rIL-13 or vehicle control and then assayed for efferocytosis (n = 3 wells; *P < 0.05 vs. WT/Veh, two-way ANOVA, Sidak’s multiple comparisons test). Data are represented as means + SEM. (D) Left: Macrophages were co-cultured with either WT or Il13−/− Treg cells and then assayed for efferocytosis. Right: Macrophages were plated on the upper chamber inserts of a 24-well Transwell dish with either media, WT Treg cells, or IL13−/− Treg cells in the bottom chambers. After 48 hours, the upper chamber inserts (macrophages) were transferred to a well containing fresh media, and efferocytosis was assayed (n = 3–4 wells per group; *P < 0.05 vs. the other groups, one-way ANOVA, Sidak’s multiple comparisons test). Data displayed represent one of 2 independent experiments and are means + SEM. (E) Mice were injected i.p. with or without Treg cells and with anti-IL-13 or control IgG, as indicated. Peritoneal macrophages from these mice were than assayed for efferocytosis ex vivo (n = 6 wells; *P < 0.05 vs. the other groups, one-way ANOVA, Sidak’s multiple comparisons test). Data are represented as means + SEM. (F) Naïve Foxp3-human DTR mice were injected with PBS or 50 µg/kg DT at day 0 and then 15 µg/kg DT on the morning of day one. On the afternoon of day one, 5 × 10⁵ splenic Treg cells from WT or Il13−/− mice, or PBS control, were isolated and delivered intraperitoneally to the mice as indicated. After 48 hours, mice were injected i.p. with PKH-red-labeled apoptotic neutrophils, and 45 min later lavage fluid was analyzed by flow cytometry for the percentage of F4/80+ macrophages that had incorporated the labeled neutrophils (n = 4 mice per group; groups with different symbols are statistically different from each other, with p value at least <0.05 using two-way ANOVA, Sidak’s multiple comparisons). Data are represented as means + SEM. (G) Foxp3-human DTR mice were treated with intranasal LPS on day 0 and then given DT injections (or PBS) on day one. 2 × 10⁶ WT or Il13−/− Treg cells (or PBS) were delivered intranasally to mice on the afternoon of day one. TUNEL+ apoptotic cells (AC) that were either associated with Mac-3+ macrophages or not associated with macrophages (“free”) were quantified (n = 3–4 mice per group; groups with different symbols are statistically different from each other, with P value at least <0.05 by two-way ANOVA, Sidak’s multiple comparisons). Data are represented as means + SEM. Please also see Figure S5 and S6.
To assess the role of IL-13 in vivo, we turned to the peritoneal adoptive transfer model described in Figure 4B and found that enhancement of efferocytosis by intraperitoneally injected Treg cells was abrogated when the mice were co-injected with anti-IL-13 neutralizing antibody at the time of Treg cell injection (Figure 6E). In addition, we utilized the Foxp3-hDTR mouse model to demonstrate that while WT Treg cells are able to rescue deficient efferocytosis in Treg cell-depleted mice, delivery of an equal number of Il13−/− Treg cells failed to do so (Figures 6F and S5E). We then tested this pathway in a disease model, utilizing the LPS-induced acute lung injury model in Foxp3-hDTR mice described in Figure 2. As expected, DT treatment caused loss of Treg cells in lung as well as spleen (Figure S5F, groups 1 and 2), and, consistent with our previous experiment, the lungs of mice depleted of Treg cells had decreased efferocytosis compared with lungs of control mice (Figure 6G, groups 1 and 2). We then tested the effect of partially restoring the lungs of DT-treated mice with WT vs. IL13−/− Treg cells using the strategy described for the Rag1−/− experiment in Figure S1F-G. Similar to that experiment, administering WT and IL13−/− Treg cells by the intranasal route was able to partially restore Treg cells in the lungs of DT-treated mice, without any increase in Treg cells in the spleens (Figure S5F, groups 3 and 4). Most importantly, while the lungs of mice treated with WT Treg cells showed partial restoration of efferocytosis, the lungs of mice treated with IL13−/− Treg cells showed less improvement in efferocytosis (Figure 6G, groups 3 and 4).
We next questioned whether different types of macrophages might respond differently to Treg cell stimulation. It has been reported previously that resident macrophages have higher rates of efferocytosis than do recruited macrophages (Newson et al., 2014). Accordingly, we isolated resident peritoneal macrophages from naïve mice (day 0 macrophages) and from mice that had received 0.1 mg of zymosan 8 days prior, which is a source of predominantly recruited macrophages. These macrophages were co-cultured ex vivo with either WT or Il13−/− Treg cells for 48 hours and then assayed for efferocytosis. As predicted, day 0 macrophages were better efferocytes under basal conditions. Most importantly, while both day 0 and day 8 macrophages showed enhancement of efferocytosis in response to WT Treg cells, the day 0 macrophages demonstrated a 20.1% increase, while the day 8 macrophages demonstrated a 66.4% increase (Figure S6A, groups 1,2 and 4,5). In contrast, Il13−/− Treg cells failed to boost efferocytosis in either day 0 or day 8 macrophages (Figure S6A, groups 3 and 6).
Given the role for both Treg cell IL-13 and macrophage IL-10, we sought to determine whether these are dynamically regulated in the peritonitis model. Day 4 and 10 post-zymosan were examined, during which time Treg cells markedly increase, while macrophage show a slight decrease (Figure S6B). As predicted by the proposed pathway, IL-13 in the peritoneal exudate rose between days 4 and 10 (Figure S6C). Note that the expression of Il13 by Treg cells did not rise (Figure S6D), consistent with the idea that it is not increased production per cell but rather the increased number of Treg cells in the peritoneum at day 10 that are responsible for the observed increase in peritoneal IL-13. Three other predictions were borne out by the data: (i) the concentration of peritoneal IL-10 rose between days 4 and 10 (Figure S6E); (ii) this rise coincided with an increase in Il10 expression by macrophages (Figure S6F); and (iii) the expression of Il13 in macrophages and Il10 in Treg cells did not change over time (Figure S6G and S6H).
In summary, the combined in vitro and in vivo data support a pathway in which activated Treg cells secrete IL-13, which then increases efferocytosis by stimulating macrophages, particularly recruited macrophages, to secrete the efferocytosis-enhancing autocrine-paracrine cytokine IL-10. The finding that IL13−/− Treg cells had some ability, albeit minimal, to boost efferocytosis in the DT lung model suggests that Treg cells have an additional pro-efferocytic mechanism in this setting.
IL-10 signaling enhances apoptotic cell uptake via induction of Vav1
As a Rho family GTPase, Rac1 cycles between an active GTP-bound form and an inactive GDP-bound form through the action of GTP-exchange factors (GEFs). In considering how IL-10 enhances Rac1 activity to enhance efferocytosis (Figure 3), we focused on the Rac1 GEF Vav1. Vav1 has been implicated previously in efferocytosis and is a target of STAT3, which is one of the mediators of IL-10 transcriptional programming (Mondal et al., 2011; Hutchins et al., 2012). We found that IL-10 increased Vav1 expression in macrophages and that this increase was blocked by the STAT3 inhibitor Stattic (Schust et al., 2006) (Figures 7A and S7A). Vav1 expression was also induced by Treg cells, and this effect was dependent on IL-10 expression by the macrophages (Figure 7B). To determine the importance of Vav1 in IL10-enhanced efferocytosis, we used siRNA to silence Vav1 in macrophages (Figure S7B) and then tested the effect of IL-10 on efferocytosis and Rac1 activation. Vav1 silencing completely abrogated the enhancement of both efferocytosis and Rac1 activation by IL-10 (Figure 7C-D). Taken together, the data in Figs. 3–7 support a mechanism in which Treg cells enhance macrophage efferocytosis through a transcellular signaling pathway in which Treg cell-derived IL-13 activates an IL-10-Vav1-Rac1 apoptotic cell internalization pathway in macrophages (Figure S7C).
Figure 7. IL-10 and Treg cells induce the Rac1 GEF Vav1 in macrophages, which is necessary for the enhancement of Rac1 activation and efferocytosis.

(A) Bone marrow-derived macrophages were incubated with rIL-10 or vehicle control in the absence or presence of the STAT3 inhibitor, 6-nitro-benzo[b]thiophene-1,1-dioxide (“Stattic”, 6 µM) (n = 3 wells; *P < 0.05 vs. all other groups, two-way ANOVA, Sidak’s multiple comparisons test). Data are represented as means + SEM. (B) WT or Il10−/− macrophages were incubated with or without Treg cells and then assayed for Vav1 mRNA (n = 3–4 wells; *P < 0.05 vs. all other groups, twoway ANOVA, Sidak’s multiple comparisons test). Data are represented as means + SEM. (C) Macrophages treated with Vav1 or scrambled siRNA were incubated with or without IL-10 and then assayed for efferocytosis (n = 3 wells; *P < 0.05, two-way ANOVA, Sidak’s multiple comparisons test). Data displayed represent one of 2 independent experiments and are means + SEM. (D) Macrophages treated with Vav1 or scrambled siRNA were incubated with or without apoptotic cells and/or IL-10 and then assayed for GTP-bound Rac1 (n = 4 wells; *P < 0.05 vs. all other groups, one-way ANOVA, Sidak’s multiple comparisons test). Data displayed represent one of 2 independent experiments and are means + SEM. Please also see Figure S7.
DISCUSSION
Treg cells, by suppressing the inflammatory activity of both innate and adaptive immune cells and by secreting proteins involved in tissue repair, are poised to play an important role in the inflammation resolution response (Gagliani et al., 2015; Newson et al., 2014; D’Alessio et al., 2009; Weirather et al., 2014; Arpaia et al., 2015). The findings herein showing that Treg cells boost efferocytosis by macrophages, which is a critically important effector arm of inflammation resolution, fits well this idea. Treg cells carry out this function by using IL-13 as a transcellular mediator: Treg cell-derived IL-13 stimulates macrophages to produce IL-10, which then acts in an autocrine-paracrine manner to enhance apoptotic cell engulfment via a Vav1-Rac1mediated mechanism. IL-13 is typically considered to be pro-inflammatory, but it has also been reported to stimulate IL-10 production and inflammation resolution in a murine model of chronic colitis (Fichtner-Feigl et al., 2014) and to be protective in experimental autoimmune encephalomyelitis (Ochoa-Reparaz et al., 2008). While IL-13 appears to be the dominant mechanism in vitro and in zymosan-induced peritonitis, it is possible that Treg cell-mediated enhancement of efferocytosis in other settings may involve additional mechanisms, as suggested by our finding that adoptive transfer of Il13−/− Treg cells into the lungs of Treg cell-depleted mice displayed higher lung macrophage efferocytosis than Treg cell-depleted mice given vehicle alone. Thus, it is possible that Treg cells in this model may secrete a protein in addition to IL-13 that increases macrophage IL-10 (Chung et al., 2007) or that enhances macrophage efferocytosis by an IL-10-independent mechanism.
Although the Treg cell-efferocytosis pathway revealed here has not been previously elucidated, the IL-10 component of this pathway integrates well with the results of previous studies (Ogden et al., 2005; Michlewska et al., 2009; Michalski et al., 2016). One of these studies suggest a mechanistic link to STAT3 activation (Michalski et al., 2016), which fits well with the STAT3-Vav1-Rac1 pathway reported here. Another paper reported that Treg cell depletion during ALI is associated with an increase in protein and neutrophils in bronchoalveolar lavage fluid and a worsening of lung histology (Aggarwal et al., 2014), but efferocytosis was not examined. Finally, in considering the findings here, it is interesting to consider how the ability of Treg cells to induce macrophage IL-10 may have a broader role in macrophage-mediated inflammation resolution. For example, a recent report shows that IL-10 can re-program macrophage metabolism in a way that promotes anti-inflammatory and resolution functions (Ip et al., 2017).
The application of our findings to atherosclerosis has particularly important implications. Defective resolution in general, and defective efferocytosis in particular, play key roles in the progression of relatively benign atherosclerotic lesions into clinically important necrotic plaques (Serhan et al., 2015; Schrijvers et al., 2005; Yurdagul, Jr. et al., 2017). Moreover, animal and human studies suggest that Treg cells, IL-10, and IL-13 can protect against advanced plaque progression (Schrijvers et al., 2005; Yurdagul, Jr. et al., 2017; Ait-Oufella et al., 2006; Pinderski et al., 2002; Potteaux et al., 2004; Liu et al., 2006; George et al., 2012; Tziakas et al., 2007; Cardilo-Reis et al., 2012). Our current data now suggest a plausible link among defects in Treg cells, IL-10, IL-13, and efferocytosis in plaque progression and thereby raise the possibility that therapeutically boosting this axis might prevent atherothrombotic disease in subjects at high risk. Likewise, based on the other two in vivo models used in this study, this therapeutic strategy may help prevent the pathophysiological consequences of sepsis and inflammatory lung disease, which, like advanced atherosclerosis, are often associated with impaired resolution (Buckley et al., 2014).
STAR METHODS
CONTACT FOR REAGENT AND RESOURCE SHARING
Further information and requests for resources and reagents should be directed to and will be fulfilled by the Lead Contact, Dr. Ira Tabas (iat1@cumc.columbia.edu). An MTA was obtained for the transfer of Il13−/− mice.
EXPERIMENTAL MODEL AND SUBJECT DETAILS
Cell Lines
Jurkat (human T lymphocytes) and L-929 (mouse fibroblasts) cells were maintained in Dulbecco’s modified Eagle’s medium (DMEM) supplemented with 10% (vol/vol) heatinactivated fetal bovine serum (HI-FBS), and 10 U/mL penicillin and 100 µg/mL streptomycin.Cells were cultured in a humidified CO2 incubator at 37ᵒC.
Primary Cell Cultures
For bone marrow-derived macrophages (BMDMs), bone marrow cells from 8–12 week old male or female mice were cultured in DMEM supplemented with 10% (vol/vol) heat-inactivated FBS, 10 U/mL penicillin, 100 µg/mL streptomycin, and 20% (vol/vol) L-929 fibroblast-cultured media supernatants for 7–9 days (Thorp et al., 2008). For human macrophages, buffy coats were purchased from the New York Blood Donor Center, and peripheral blood mononuclear cells (PBMCs) were isolated using Lymphoprep according to the manufacturer’s instructions. Briefly, Lymphoprep was added to the bottom of 50-mL Sepmate conical tubes, and buffy coat (diluted 1:1 with PBS containing 2% FBS) was layered above. Tubes were centrifuged at 800 x g for 20 minutes at room temperature to collect the mononuclear cell fraction. Approximately 60 million PBMCs were plated on 10-cm petri dishes. After 1 hour, non-adherent cells were removed by washing, and the adherent cells were cultured with Roswell Park Memorial Institute 1640 media (RPMI-1640) supplemented with 10% FBS and 10 ng/mL recombinant human GM-CSF for 7 days, with the medium replaced after the first 3 days. Columbia University Institutional Review Board and Health Insurance Portability and Accountability Act guidelines were followed for isolating peripheral human blood monocytes.
Experimental Animals
Animal protocols were approved by Columbia University’s Institutional Animal Care and Use Committee. All animals were cared for according to the NIH guidelines for the care and use of laboratory animals. Mice were socially housed under a 12-hour light-dark cycle with ad libitum access to water and food. All mice were on the C57Bl/6J background. C57BL/6J (wild type, WT), B6.129S7-Ldlrtm1Her/J (Ldlr−/−), B6.129P2-Il10tm1Cgn/J (Il10−/−), B6.129S2-Il10rbtm1Agt/J (Il10rb−/−), B6.129(Cg)-Foxp3tm3(DTR/GFP)Ayr/J, and B6.129S7-Rag1tm1Mom/J (Rag1−/−) mice were purchased from Jackson Laboratories. Il13−/− mice were a generous gift from Andrew McKenzie at the MRC Laboratory of Molecular Biology in Cambridge, UK (Neill et al., 2010). Male and female mice between the ages of 8–20 weeks were used in this study, and all mice were assigned randomly to the various experimental groups.
METHOD DETAILS
Zymosan-induced Peritonitis
Peritonitis was induced by i.p. injection of 0.1 mg zymosan A in a 500-µL volume per mouse (day 0). Treg cells were depleted in Foxp3-human DTR mice by i.p. injection of diphtheria toxin at day 4 (50 µg/kg), day 6 (15 µg/kg), and day 8 (15 µg/kg). Mice were sacrificed on day 11, and peritoneal exudates were collected by lavage with 2 mL of sterile PBS.
Peritoneal Uptake of Labeled Apoptotic Cells (ACs)
Neutrophils were collected by peritoneal lavage from donor mice 6 hours after they had been injected with 1 mg of zymosan A. The lavage fluid was passed through a 40-µm strainer and washed, and neutrophils were isolated with the EasySep Mouse Neutrophil Enrichment Kit according to manufacturer’s instructions and then cultured overnight in medium containing 1% FBS and 1% penicillin and streptomycin in DMEM. On the following day, the neutrophils, which were now apoptotic, were labeled with PKH26 red according to the manufacturer’s instructions. The recipient mice were injected i.p. with 4 × 10⁶ of these labeled apoptotic cells, and 45 minutes later, the mice were sacrificed and the peritoneum was lavaged. Efferocytosis was quantified as the percentage of F4/80+ macrophages that had taken up one or more PKHlabeled apoptotic cells.
Acute Lung Injury
LPS (3.75 µg/g body weight) was delivered by intranasal installation (day 0). To deplete Treg cells in DT-Treg cell mice, 50 µg/kg body weight diphtheria toxin was delivered i.p. at day 1. Alternatively, Treg cells were depleted in WT mice by injection of 0.5 mg anti-CD25 antibody at days −2 and +1. For cells in which Treg cells were administered to mice, 2×10⁶ cells were resuspended in 40 µl of PBS and delivered intranasally to anesthetized mice. Four days postLPS, mice were sacrificed, blood was removed by cardiac puncture, and the vasculature was perfused with PBS. Lungs were either lavaged with PBS, fixed by gravity perfusion of formalin, or harvested, minced, and digested with Liberase TL for 30 minutes at 37oC, followed by staining for flow cytometry. For 7-day experiments, mice were given additional doses of diphtheria toxin (15 µg/kg body weight) at days 3 and 5 post-LPS.
Lung Histology
Formalin-fixed lung tissues were paraffin-embedded and then sectioned. Tissue sections were stained with hematoxylin and eosin, then examined and quantitatively analyzed using a Nikon Labphoto 2 microscope equipped with Image Pro Plus software. Injury scoring was conducted by a blinded observer according to a previously established method (Matute-Bello et al., 2011). Briefly, images were scored for neutrophil localization to the alveolar and interstitial spaces, as well as the presence of air space debris and alveolar septal thickening.
In Situ Efferocytosis Analysis
Efferocytosis was determined using previously described methods (Thorp et al., 2008). Apoptotic cells were identified in tissue sections by performing terminal deoxynucleotidyl transferase dUTP nick end labeling (TUNEL) using the tetramethylrhodamine red in situ cell death detection kit according to the manufacturer’s protocols. Frozen tissues were first fixed with ice-cold acetone for 3 minutes at −20oC. In the case of formalin-fixed paraffin embedded tissues, tissues were first deparaffinized and incubated with proteinase K solution according to the manufacturer’s instructions. Following TUNEL staining, sections were incubated with primary antibodies against Mac3 or F4/80, and then by Alexa Fluor 647- or Alex Fluor 488conjugated secondary antibodies to identify macrophages. Images were captured using a Leica DMI 6000B or an Olympus IX-70 microscope and analyzed using ImageJ software. Briefly, the number of apoptotic cells that co-localized with or were adjacent to macrophages (“associated”) and those that were not associated with macrophages (“free”) were counted. Efferocytosis efficiency was quantified based on the ratio of associated:free apoptotic cells per tissue section.
Flow Cytometry
Cells were washed, resuspended in staining buffer consisting of 2% FBS in PBS with 2 mM EDTA, blocked with anti-mouse CD16/32 antibodies for 10 minutes, and then incubated with primary antibodies. Treg cells in bronchoalveolar lavage samples from Foxp3GFP/DTR mice were identified by first immunostaining for CD4 or CD3 and then by assaying eGFP expression among these cells. To analyze splenic T cells, spleens were processed to form a single-cell suspension and then placed through a 40-µm filter. Following red blood cell lysis, cells were blocked and stained for CD4 and CD25. Alternatively, following surface staining, cells were incubated with fixation-permeablization buffer, washed with permeabilization buffer, and then incubated with Foxp3 antibody. Peripheral blood samples were collected after tail clipping using microhematocrit microcapillary tubes. Circulating Treg cells were then analyzed in a similar manner to splenic Treg cells. To analyze lung macrophages, cells were incubated with aqua-fixable LIVE-DEAD stain according to the manufacturer’s protocol and then immunostained for CD11b, Siglec F, F4/80, and CD11c. For phospho-STAT3 flow cytometry, cells were fixed with 2% paraformaldehyde for 15 minutes at room temperature, permeabilized with 0.2% tween-20 for 10 minutes at room temperature, washed with permeabilization buffer, and then incubated with phospho-(Y705)-STAT3 antibody, and, in some cases, also total STAT3 antibody. Samples were processed on a BD FACSCanto II or BD Fortessa and analyzed with FlowJo software.
Regulatory T cell Isolation
Spleens were collected from WT, Il10-/,- or Il13−/− mice and processed into a single cell suspension. CD4+ T cells were first enriched using the EasySep Mouse CD4+ T cell enrichment kit according to the manufacturer’s instructions. CD4+CD25+ T cells were then purified using the mouse CD25 regulatory T cell positive selection kit. Purity was assessed by flow cytometry analysis and cells were typically >93% CD4+CD25+.
In Vitro Efferocytosis Assay
In vitro efferocytosis assays were performed according to established protocols (Subramanian et al., 2014). Primary bone marrow-derived macrophages were cultured at 3 × 10⁵ cells per well in 24-well tissue culture plates. To carry out efferocytosis, macrophages were incubated for 2 hours with PKH26-labeled Jurkat cells that were rendered apoptotic by UV-irradiation (Subramanian et al., 2014) at a ratio of 5:1 apoptotic cells: macrophage. Cultures were then vigorously washed, and fluorescence and bright field images were taken on an Olympus IX-70 microscope to identify uptake of labelled cells. Images were quantified using ImageJ software. A similar protocol was used to assay efferocytosis by human monocyte-derived macrophages. In the case of macrophage and Treg cell co-cultures, Treg cells were isolated as described above and then cultured with macrophages for ~40 hours at a ratio of 1:4 (Treg cell:macrophage) in the presence of anti-CD3 (62.5 ng/mL). For rIL-10 or rIL-13 treatment, macrophages were exposed to recombinant mouse IL-10 or IL-13 at the indicated dose for 48 hours prior to efferocytosis assays. To neutralize IL-13, an IL-13 neutralizing antibody (5 µg/mL) was added to the culture media during co-culture.
Adoptive Transfer of Treg cells to Naïve Mice
Treg cells were isolated from the spleens of donor WT, IL10−/−, or IL-13−/− mice as described above. For peritonitis studies, recipient mice were injected i.p. with 5 × 10⁵ Treg cells. Three days later, mice were sacrificed and the peritoneal cavity was lavaged to collect resident macrophages. For IL-13 neutralization studies, mice were co-injected with either IgG (200µg) or IL-13 neutralizing antibody (200 µg). For lung injury studies in which Treg cells were administered to mice, 0.75–2×10⁶ Treg cells were resuspended in 40 µl of PBS and delivered intranasally to anesthetized mice.
Ex vivo Efferocytosis and Apoptotic Cell Binding Assays
Peritoneal lavage cells were collected from mice and plated on 24-well plates. After 2 hours, the medium was aspirated and the cells were washed. The remaining adherent cells were >90% F4/80+ macrophages. Efferocytosis was carried out as described above. To measure apoptotic cell binding capacity, plates were incubated at 4oC for one hour immediately after the addition of labeled apoptotic Jurkat cells. Plates were washed with cold PBS and then imaged as described above.
Gene Expression Analysis
RNA was isolated using the RNeasy Isolation kit and reverse transcribed using the Maxima First strand cDNA synthesis kit (Thermo Fisher Scientific, K1671) according to the manufacturer’s protocol. RT-PCR was conducted on a 7500 Realtime PCR system (Applied Biosystems) using Power SYBR Green master mix (Thermo Fisher Scientific, 4367659). For primer sequences, please see Supplemental Key Resources Table.
Gene Silencing
Macrophages were transfected with ON-TARGETplus SMARTpool siRNA against Vav1 (15 nM) or IL-13 (30 nM) using Lipofectamine RNAiMax reagent according to the manufacturer’s instructions. Gene silencing was evaluated by RT-PCR.
Rac1 Activity Assay
Macrophages were plated on 12-well plates and exposed to 4-µm polystyrene beads at a macrophage:bead ratio of 1:5. The cells were then washed thoroughly and lysed with RIPA buffer containing Halt protease and phosphatase inhibitor cocktail. Protein concentrations were determined using the precision red protein assay. Rac1 activity was determined using the G-LISA Rac1 activation assay kit, according to the manufacturer’s instructions.
IL-10 and IL-13 ELISA Assays
To assay IL-10 and IL-13 in the conditioned medium of cultured Treg cells, a 48-well cell culture plate was coated with 200 µl/well purified CD3 and incubated overnight at 4oC. Treg cells were isolated as above and resuspended at a density of 1×10⁶ cells per 500 µl of DMEM media containing 10% FBS and penicillin and streptomycin. Certain samples also included CD28 (2 µg/ml) and/or IL-2 (10 ng/ml). Treg cells were then plated at 1×10⁶ and incubated overnight at 37oC and 5% CO2. Conditioned media were then collected from the wells, pelleted in order to get rid of cells, and concentrated approximately 4-fold using Amicon Ultra 3K centrifugal filter units. 50-µl aliquots of these concentrated Treg cell-conditioned medium samples were assayed in duplicate using commercially available IL-10 ELISA or IL-13 ELISA kits according to the manufacturer’s instructions. To assay IL-10 and IL-13 in peritoneal exudates, the peritoneums of mice were lavaged with 2ml of cold PBS. Exudates were centrifuged and the pellet was saved for further analyses. The exudate was then concentrated approximately 8-fold using Amicon Ultra 3K centrifugal filter units. 50-µl aliquots of these concentrated Treg cell-conditioned medium samples were assayed IL-10 or IL-13 as above.
Efferocytosis in Atherosclerosis
Beginning at approximately 10 weeks of age, Ldlr−/− mice were fed a saturated fat and cholesterol-containing Western-type diet (WD) ad libitum for 12 weeks, leading to advanced atherosclerosis. At this time, the mice were divided into four treatment groups: IgG only (control), IL-2 complex and IgG, and IL-2 complex and anti-IL-10, and anti-IL-10 alone. Rat IgG or anti-IL-10 antibody was administered twice weekly i.p. in 200-µg doses. IL-2 complexes were formed as previously described (Foks et al., 2011). Briefly, each dose per mouse consisted of 1 µg of recombinant IL-2 that had been incubated with 5 µg of IL-2 antibody for 30 minutes at 37oC in PBS. Mice were administered IL-2 complex i.p. for 3 consecutive days and then once every 5 days thereafter for the duration of the 3-week treatment period. Mice remained on WD during this time, such that at the time of sacrifice, the mice had been fed the WD for 15 weeks. Following completion of the WD-feeding period, mice were euthanized using isoflurane inhalation followed by exsanguination via cardiac puncture. The heart with the aortic root attached was harvested, embedded in OCT medium, and frozen on dry ice. Aortic root sections were prepared using a cryomicrotome and then stained with hematoxylin and eosin. Images were captured on a Nikon Labphoto 2 microscope and analyzed with Image Pro Plus analysis software and analyzed as described previously (Subramanian et al., 2013). Total plasma cholesterol and triglycerides were determined using the Cholesterol E and Triglyceride M kits, respectively, according to the manufacturer’s instructions. Fasting blood glucose concentration was determined using glucose test strips and a One Touch Ultra glucometer.
QUANTIFICATION AND STATISTICAL ANALYSIS
Data were tested for normality using the Kolmogorov-Smirnov test, and statistical significance was determined using GraphPad Prism software. Data that passed the normality were analyzed using Student’s t test for two groups with one variable tested and equal variances, one-way ANOVA with Tukey’s post-test for multiple groups with only variable tested, or twoway ANOVA with Sidak’s post-tests for more than two groups with multiple variables tested. Data that were not normally distributed but contained equal variances were analyzed using the nonparametric Mann-Whitney U test with post hoc analysis. Data are shown as mean values ± SEM. Differences were considered statistically significant at p< 0.05.
Supplementary Material
Highlights.
Depletion of Treg cells impairs efferocytosis during inflammation resolution
Treg cell transfer to mice with atherosclerosis improves lesional efferocytosis
Treg cells secrete IL-13, which stimulates IL-10 production in macrophages
Macrophage IL-10 induces Vav1, which activates Rac1 and apoptotic cell engulfment
ACKNOWLEDGMENTS
The authors thank Dr. Andrew McKenzie, Medical Research Council, for his generous donation of the Il13−/− mice used in this study. This work was supported by NIH T32 postdoctoral training grant HL007343 (J.D.P. and A.Y.), an American Heart Association Fellow-toFaculty Transition Award (A.C.D.), a grant from the Scientific and Technological Research Council of Turkey (TUBITAK), a grant from the BIDEB 2214/A Program (E.S.), a Grant-in-Aid from the American Heart Association (M.N.I.), an American Heart Association Fellow-toFaculty Transition Award and a Stony Wold-Herbert Fund, Inc. Research Fellowship (J.H.), NIH grants HL122730 AND DoD-PR150672 (J.B.), and NIH grants HL132412, HL075662, and HL127464 (I.T.). These studies used the resources of the Columbia Diabetes and Endocrinology Research Center and Columbia Cancer Center flow core facilities funded in part through NIH Center Grants 5P30DK063608 and P30CA013696 respectively.
Footnotes
Publisher's Disclaimer: This is a PDF file of an unedited manuscript that has been accepted for publication. As a service to our customers we are providing this early version of the manuscript. The manuscript will undergo copyediting, typesetting, and review of the resulting proof before it is published in its final citable form. Please note that during the production process errors may be discovered which could affect the content, and all legal disclaimers that apply to the journal pertain.
DECLARATION OF INTERESTS
The authors declare no competing interests.
REFERENCES
- Aggarwal NR, Tsushima K, Eto Y, Tripathi A, Mandke P et al. (2014). Immunological priming requires regulatory T cells and IL-10-producing macrophages to accelerate resolution from severe lung inflammation. J. Immunol 192, 4453–4464. [DOI] [PMC free article] [PubMed] [Google Scholar]
- Ait-Oufella H, Salomon BL, Potteaux S, Robertson AK, Gourdy P et al. (2006). Natural regulatory T cells control the development of atherosclerosis in mice. Nat. Med 12, 178–180. [DOI] [PubMed] [Google Scholar]
- Arandjelovic S & Ravichandran KS (2015). Phagocytosis of apoptotic cells in homeostasis. Nat. Immunol 16, 907–917. [DOI] [PMC free article] [PubMed] [Google Scholar]
- Arpaia N, Green JA, Moltedo B, Arvey A, Hemmers S et al. (2015). A distinct function of regulatory T cells in tissue protection. Cell 162, 1078–1089. [DOI] [PMC free article] [PubMed] [Google Scholar]
- Boyman O, Kovar M, Rubinstein MP, Surh CD, & Sprent J (2006). Selective stimulation of T cell subsets with antibody-cytokine immune complexes. Science 311, 1924–1927. [DOI] [PubMed] [Google Scholar]
- Buckley CD, Gilroy DW, & Serhan CN (2014). Proresolving lipid mediators and mechanisms in the resolution of acute inflammation. Immunity 40, 315–327. [DOI] [PMC free article] [PubMed] [Google Scholar]
- Cai B, Thorp EB, Doran AC, Subramanian M, Sansbury BE et al. (2016). MerTK cleavage limits proresolving mediator biosynthesis and exacerbates tissue inflammation. Proc. Natl. Acad. Sci. U. S. A 113, 6526–6531. [DOI] [PMC free article] [PubMed] [Google Scholar]
- Cardilo-Reis L, Gruber S, Schreier SM, Drechsler M, Papac-Milicevic N et al. (2012). Interleukin13 protects from atherosclerosis and modulates plaque composition by skewing the macrophage phenotype. EMBO Mol. Med 4, 1072–1086. [DOI] [PMC free article] [PubMed] [Google Scholar]
- Chen H, Qin J, Wei P, Zhang J, Li Q et al. (2009). Effects of leukotriene B4 and prostaglandin E2 on the differentiation of murine Foxp3+ T regulatory cells and Th17 cells. Prostaglandins Leukot. Essent. Fatty Acids 80, 195–200. [DOI] [PubMed] [Google Scholar]
- Chung EY, Liu J, Homma Y, Zhang Y, Brendolan A et al. (2007). Interleukin-10 expression in macrophages during phagocytosis of apoptotic cells is mediated by homeodomain proteins Pbx1 and Prep-1. Immunity 27, 952–964. [DOI] [PMC free article] [PubMed] [Google Scholar]
- D’Alessio FR, Tsushima K, Aggarwal NR, West EE, Willett MH et al. (2009).CD4+CD25+Foxp3+ Treg cells resolve experimental lung injury in mice and are present in humans with acute lung injury. J. Clin. Invest 119, 2898–2913. [DOI] [PMC free article] [PubMed] [Google Scholar]
- Dinh TN, Kyaw TS, Kanellakis P, To K, Tipping P et al. (2012). Cytokine therapy with interleukin-2/anti-interleukin-2 monoclonal antibody complexes expands CD4+CD25+Foxp3+ regulatory T cells and attenuates development and progression of atherosclerosis. Circulation 126, 1256–1266. [DOI] [PubMed] [Google Scholar]
- Fadok VA, Bratton DL, Konowal A, Freed PW, Westcott JY et al. (1998). Macrophages that have ingested apoptotic cells in vitro inhibit proinflammatory cytokine production through autocrine/paracrine mechanisms involving TGF-β, PGE2, and PAF. J. Clin. Invest 101, 890–898. [DOI] [PMC free article] [PubMed] [Google Scholar]
- Fichtner-Feigl S, Kesselring R, Martin M, Obermeier F, Ruemmele P et al. (2014). IL-13 orchestrates resolution of chronic intestinal inflammation via phosphorylation of glycogen synthase kinase-3beta. J. Immunol 192, 3969–3980. [DOI] [PubMed] [Google Scholar]
- Foks AC, Frodermann V, ter BM, Habets KL, Bot I et al. (2011). Differential effects of regulatory T cells on the initiation and regression of atherosclerosis. Atherosclerosis 218, 53–60. [DOI] [PubMed] [Google Scholar]
- Freire-de-Lima CG, Xiao YQ, Gardai SJ, Bratton DL, Schiemann WP et al. (2006). Apoptotic cells, through transforming growth factor-beta, coordinately induce anti-inflammatory and suppress proinflammatory eicosanoid and NO synthesis in murine macrophages. J. Biol. Chem 281, 38376–38384. [DOI] [PubMed] [Google Scholar]
- Gagliani N, Amezcua Vesely MC, Iseppon A, Brockmann L, Xu H et al. (2015). Th17 cells transdifferentiate into regulatory T cells during resolution of inflammation. Nature 523, 221–225. [DOI] [PMC free article] [PubMed] [Google Scholar]
- George J, Schwartzenberg S, Medvedovsky D, Jonas M, Charach G et al. (2012). Regulatory T cells and IL-10 levels are reduced in patients with vulnerable coronary plaques. Atherosclerosis 222, 519–523. [DOI] [PubMed] [Google Scholar]
- Godson C, Mitchell S, Harvey K, Petasis NA, Hogg N et al. (2000). Cutting edge: lipoxins rapidly stimulate nonphlogistic phagocytosis of apoptotic neutrophils by monocyte-derived macrophages. J. Immunol 164, 1663–1667. [DOI] [PubMed] [Google Scholar]
- Hutchins AP, Poulain S, & Miranda-Saavedra D (2012). Genome-wide analysis of STAT3 binding in vivo predicts effectors of the anti-inflammatory response in macrophages. Blood 119, e110-e119. [DOI] [PubMed] [Google Scholar]
- Ip WKE, Hoshi N, Shouval DS, Snapper S, & Medzhitov R (2017). Anti-inflammatory effect of IL-10 mediated by metabolic reprogramming of macrophages. Science 356, 513–519. [DOI] [PMC free article] [PubMed] [Google Scholar]
- Kambayashi T, Jacob CO, & Strassmann G (1996). IL-4 and IL-13 modulate IL-10 release in endotoxin-stimulated murine peritoneal mononuclear phagocytes. Cell Immunol 171, 153–158. [DOI] [PubMed] [Google Scholar]
- Liu Y, Li D, Chen J, Xie J, Bandyopadhyay S et al. (2006). Inhibition of atherogenesis in LDLR knockout mice by systemic delivery of adeno-associated virus type 2-hIL-10. Atherosclerosis 188, 1927. [DOI] [PubMed] [Google Scholar]
- Matute-Bello G, Downey G, Moore BB, Groshong SD, Matthay MA et al. (2011). An official American Thoracic Society workshop report: features and measurements of experimental acute lung injury in animals. Am. J. Respir. Cell Mol. Biol 44, 725–738. [DOI] [PMC free article] [PubMed] [Google Scholar]
- Michalski MN, Koh AJ, Weidner S, Roca H, & McCauley LK (2016). Modulation of osteoblastic cell efferocytosis by bone marrow macrophages. J. Cell Biochem 117, 2697–2706. [DOI] [PMC free article] [PubMed] [Google Scholar]
- Michlewska S, Dransfield I, Megson IL, & Rossi AG (2009). Macrophage phagocytosis of apoptotic neutrophils is critically regulated by the opposing actions of pro-inflammatory and antiinflammatory agents: key role for TNF-alpha. FASEB J 23, 844–854. [DOI] [PubMed] [Google Scholar]
- Mondal S, Ghosh-Roy S, Loison F, Li Y, Jia Y et al. (2011). PTEN negatively regulates engulfment of apoptotic cells by modulating activation of Rac GTPase. J. Immunol 187, 5783–5794. [DOI] [PMC free article] [PubMed] [Google Scholar]
- Newson J, Stables M, Karra E, Arce-Vargas F, Quezada S et al. (2014). Resolution of acute inflammation bridges the gap between innate and adaptive immunity. Blood 124, 1748–1764. [DOI] [PMC free article] [PubMed] [Google Scholar]
- Ochoa-Reparaz J, Rynda A, Ascon MA, Yang X, Kochetkova I et al. (2008). IL-13 production by regulatory T cells protects against experimental autoimmune encephalomyelitis independently of autoantigen. J. Immunol 181, 954–968. [DOI] [PMC free article] [PubMed] [Google Scholar]
- Ogden CA, Pound JD, Batth BK, Owens S, Johannessen I et al. (2005). Enhanced apoptotic cell clearance capacity and B cell survival factor production by IL-10-activated macrophages: implications for Burkitt’s lymphoma. J. Immunol 174, 3015–3023. [DOI] [PubMed] [Google Scholar]
- Pinderski LJ, Fischbein MP, Subbanagounder G, Fishbein MC, Kubo N et al. (2002). Overexpression of interleukin-10 by activated T lymphocytes inhibits atherosclerosis in LDL receptordeficient Mice by altering lymphocyte and macrophage phenotypes. Circ. Res 90, 1064–1071. [DOI] [PubMed] [Google Scholar]
- Potteaux S, Esposito B, van OO, Brun V, Ardouin P et al. (2004). Leukocyte-derived interleukin 10 is required for protection against atherosclerosis in low-density lipoprotein receptor knockout mice. Arterioscler. Thromb. Vasc. Biol 24, 1474–1478. [DOI] [PubMed] [Google Scholar]
- Ravichandran KS & Lorenz U (2007). Engulfment of apoptotic cells: signals for a good meal. Nat. Rev. Immunol 7, 964–974. [DOI] [PubMed] [Google Scholar]
- Saito M, Iwawaki T, Taya C, Yonekawa H, Noda M et al. (2001). Diphtheria toxin receptormediated conditional and targeted cell ablation in transgenic mice. Nat. Biotechnol 19, 746–750. [DOI] [PubMed] [Google Scholar]
- Schmidt EP & Tuder RM (2010). Role of apoptosis in amplifying inflammatory responses in lung diseases. J. Cell Death 2010, 41–53. [DOI] [PMC free article] [PubMed] [Google Scholar]
- Schrijvers DM, De Meyer GR, Kockx MM, Herman AG, & Martinet W (2005). Phagocytosis of apoptotic cells by macrophages is impaired in atherosclerosis. Arterioscler. Thromb. Vasc. Biol 25, 1256–1261. [DOI] [PubMed] [Google Scholar]
- Schust J, Sperl B, Hollis A, Mayer TU, & Berg T (2006). Stattic: a small-molecule inhibitor of STAT3 activation and dimerization. Chem. Biol 13, 1235–1242. [DOI] [PubMed] [Google Scholar]
- Serhan CN, Chiang N, Dalli J, & Levy BD (2015). Lipid mediators in the resolution of inflammation. Cold Spring Harb. Perspect. Biol 7, a016311. [DOI] [PMC free article] [PubMed] [Google Scholar]
- Spencer SD, Di MF, Hooley J, Pitts-Meek S, Bauer M et al. (1998). The orphan receptor CRF24 is an essential subunit of the interleukin 10 receptor. J. Exp. Med 187, 571–578. [DOI] [PMC free article] [PubMed] [Google Scholar]
- Subramanian M, Hayes CD, Thome JJ, Thorp E, Matsushima GK et al. (2014). An AXL/LRP1/RANBP9 complex mediates DC efferocytosis and antigen cross-presentation in vivo. J. Clin. Invest 124, 1296–1308. [DOI] [PMC free article] [PubMed] [Google Scholar]
- Sutmuller RP, van Duivenvoorde LM, van EA, Schumacher TN, Wildenberg ME et al. (2001). Synergism of cytotoxic T lymphocyte-associated antigen 4 blockade and depletion of CD25(+) regulatory T cells in antitumor therapy reveals alternative pathways for suppression of autoreactive cytotoxic T lymphocyte responses. J. Exp. Med 194, 823–832. [DOI] [PMC free article] [PubMed] [Google Scholar]
- Thorp E, Cui D, Schrijvers DM, Kuriakose G, & Tabas I (2008). Mertk receptor mutation reduces efferocytosis efficiency and promotes apoptotic cell accumulation and plaque necrosis in atherosclerotic lesions of Apoe−/− mice. Arterioscler. Thromb. Vasc. Biol 28, 1421–1428. [DOI] [PMC free article] [PubMed] [Google Scholar]
- Tziakas DN, Chalikias GK, Kaski JC, Kekes A, Hatzinikolaou EI et al. (2007). Inflammatory and anti-inflammatory variable clusters and risk prediction in acute coronary syndrome patients: a factor analysis approach. Atherosclerosis 193, 196–203. [DOI] [PubMed] [Google Scholar]
- Weirather J, Hofmann UD, Beyersdorf N, Ramos GC, Vogel B et al. (2014). Foxp3+ CD4+ T cells improve healing after myocardial infarction by modulating monocyte/macrophage differentiation. Circ. Res 115, 55–67. [DOI] [PubMed] [Google Scholar]
- Yurdagul A Jr., Doran AC, Cai B, Fredman G, & Tabas IA (2017). Mechanisms and consequences of defective efferocytosis in atherosclerosis. Front Cardiovasc. Med 4, 86. doi: 10.3389/fcvm.2017.00086. [DOI] [PMC free article] [PubMed] [Google Scholar]
Associated Data
This section collects any data citations, data availability statements, or supplementary materials included in this article.