

Abstract
The expansion of native mass spectrometry (MS) methods for both academic and industrial applications has created a substantial need for analysis of large native MS data sets. Existing software tools are poorly suited for high-throughput deconvolution of native electrospray mass spectra from intact proteins and protein complexes. The UniDec Bayesian deconvolution algorithm is uniquely well suited for high-throughput analysis due to its speed and robustness but was previously tailored towards individual spectra. Here, we optimized UniDec for deconvolution, analysis, and visualization of large data sets. This new module, MetaUniDec, centers around a hierarchical data format 5 (HDF5) format for storing data sets that significantly improves speed, portability, and file size. It also includes code optimizations to improve speed and a new graphical user interface for visualization, interaction, and analysis of data. To demonstrate the utility of MetaUniDec, we applied the software to analyze automated collision voltage ramps with a small bacterial heme protein and large lipoprotein nanodiscs. Upon increasing collisional activation, bacterial Heme-Nitric Oxide/Oxygen binding (H-NOX) protein shows a discrete loss of bound heme, and nanodiscs show a continuous loss of lipids and charge. By using MetaUniDec to track changes in peak area or mass as a function of collision voltage, we explore the energetic profile of collisional activation in an ultra-high mass range Orbitrap mass spectrometer.
Introduction
The use of mass spectrometry (MS) to characterize intact proteins and protein complexes has expanded in recent years due to improvements in instrumentation [1–4], new applications to structural biology [5–9], and increased commercial use for biotherapeutic applications [6, 8–11]. The increased use of top-down and native MS approaches creates a significant demand for user-friendly, robust, and high-throughput deconvolution of electrospray (ESI) mass spectra. Unlike bottom-up proteomics, the available data analysis pipelines for native and intact protein MS are not well optimized for large data sets. Commercial deconvolution programs are available from instrument vendors and third parties, but their cost and lack of published algorithms limits their accessibility. Several academic packages, CIUSuite [12], ORAGAMI [13], and PULSAR [14], offer analysis and visualization of collision induced unfolding ion mobility-MS data sets. Other academic software packages [15–20] are generally low throughput, operating on a single spectrum at a time. Thus, conventional approaches are poorly suited for analyzing large data sets that vary ligand concentration [21–23], lipid species [24, 25], collision voltage [12–14], temperature, pH, reaction time [26–29], or retention/migration time [30].
UniDec [19] offers uniquely powerful deconvolution of native and intact protein MS data because it is fast, able to analyze complex spectra, and requires minimal user input. It has been used by a number of research groups [3, 19, 21, 22, 24, 31–50]. UniDec uses a Bayesian deconvolution algorithm to determine the charge state distribution of each m/z data point, which is captured in a two-dimensional matrix of intensity values as a function of m/z and charge. By converting m/z into mass, UniDec produces a two-dimensional matrix of intensity values as a function of mass and charge, which is summed along the charge dimension to determine the mass distribution—sometimes called the zero-charge mass spectrum. In addition to the core deconvolution algorithm, UniDec provides an extensive graphical user interface (GUI) for data visualization and analysis. Although it allows batch processing of multiple spectra, the data formats and algorithms of UniDec are tailored for individual spectra and are not optimized for processing of larger data sets.
To address this limitation, we developed a high-throughput derivative of UniDec, termed MetaUniDec, which is optimized for analysis of larger data sets. MetaUniDec uses the same core deconvolution algorithm as UniDec and will thus show the same high performance level for native mass spectra as UniDec [19]. First, we bundled each data set into a hierarchical data format 5 (HDF5) file, which provides a faster, smaller, and simpler data format. MetaUniDec includes tools to automatically parse data into HDF5, including chromatographic data. Second, we extended the UniDec executable, which is written in C, to operate on the HDF5 files and to include functions previously performed by the Python advanced programming interface (API). Finally, we designed a new user interface for visualization and quantitative analysis of multiple spectra. Together, these improvements greatly streamline processing, quantitative analysis, and visualization of MS data sets. MetaUniDec is two to nine times faster than batch processing with UniDec, and the streamlined executable and file structure are amenable to remote execution with high-performance computers.
Here, we describe the design, performance, and application of MetaUniDec to native MS for characterizing collision-induced dissociation of heme from a bacterial Heme-Nitric Oxide/Oxygen binding (H-NOX) protein from Nostoc sp. PCC 7120 and lipoprotein nanodiscs with a Q-Exactive HF with ultra-high mass range (UHMR) research modifications [1]. The UHMR modifications optimize the optics for transmission of large ions up to m/z 80,000 and include the ability to trap and activate ions in the injection flatapole. Our objective was to use heme loss with H-NOX and lipid loss with lipoprotein nanodiscs as a relative indicator of the level of activation under different instrumental conditions. With H-NOX, MetaUniDec was used to extract the area of the holo- (heme bound) and apo- (heme lost) protein peaks as a function of collision voltage. In contrast, MetaUniDec was used to extract the average mass of the nanodisc complexes as a function of collision voltage. Because automated methods were used to adjust the collision voltage as a function of time, the same methods described here could be readily translated to time-dependent experiments such as chromatography [30].
Methods
Data Structure
HDF5 [51] is a hierarchical data format that groups multiple types of data objects into a set of virtual directories. Thus, although it is a single file, we will discuss the organization of the file in directory notation. HDF5 also includes metadata, which can be associated with either directories or data objects. As shown in Figure 1, the MetaUniDec HDF5 file contains three top directories, /ms_dataset, /config, and /peaks. The /ms_dataset contains subdirectories for each of the individual spectra listed by their index: /0, /1, etc. Each of these individual spectra contains a number of data objects such as raw_data, processed_data, mass_data, and charge_data. Moreover, each individual spectrum directory can have associated metadata such as the collision voltage, time point, or ligand concentration. In addition to the individual spectra, the /ms_dataset directory contains the combined mass and m/z data from each spectrum that has been merged into a single matrix with a uniform mass and m/z axis.
Figure 1.
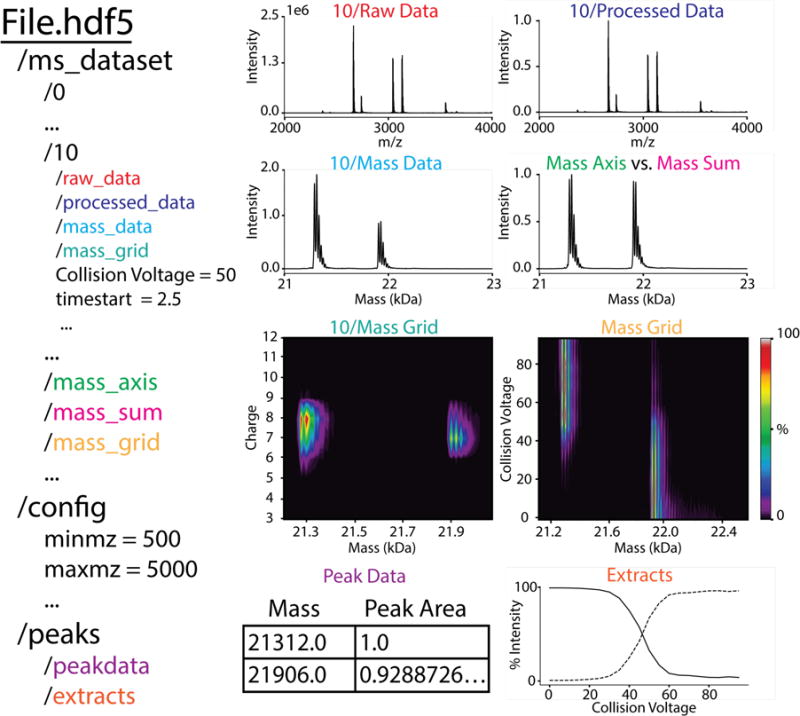
Schematic of MetaUniDec HDF5 file format organization (left) with example data from H-NOX (right). Examples are shown from the 50 V spectrum (index 10) and global analysis.
The /config directory contains the metadata parameters for data preparation, deconvolution, and analysis. All metadata are associated directly with the /config directly. A few data objects can be included when necessary to specify manual assignments, limited mass lists, and potential oligomers. Finally, the /peaks directory contains /peakdata, which details the mass and intensities of detected peaks, and /extracts, which includes the extracted quantitative values of intensities or mass as defined by the /config.
MetaUniDec Software
The compiled program and source code for MetaUniDec are available online as part of the UniDec software package: https://github.com/michaelmarty/UniDec. We have removed licensing restrictions from previous versions and released version 2 as free and open source for both commercial and academic users.
MetaUniDec continues to use the UniDec executable and was built to operate on top of the existing UniDec code. It was written in C and compiled with Intel Parallel Studio XE 17.0. UniDec was originally designed to separate data preparation and analysis into the Python API and use the C-based executable only for deconvolution, which sacrificed speed for flexibility. Because speed is paramount with high-throughput deconvolution, we incorporated many of the functions from the Python API into the executable. However, we also constructed a Python API for scripting MetaUniDec processing and analysis. The GUI is also programmed in Python and has been integrated into the same package as conventional UniDec, which we have upgraded to version 2 to reflect the additions. As shown in Figure 2, the GUI assembles the raw data and configuration parameters into the HDF5 file. UniDec.exe operates on the HDF5 file, and the results are imported by the GUI for visualization. Here, we describe the new additions to the code and refer the reader to the original publication [19] for a complete description and benchmarking of the deconvolution algorithm.
Figure 2.
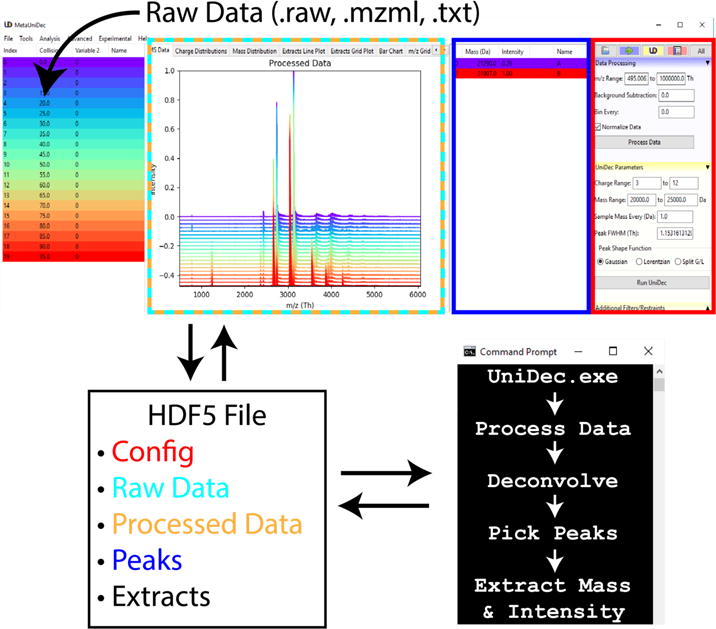
Schematic of MetaUniDec software. Raw data are parsed by the Python GUI and stored in the HDF5 with the configuration parameters. The UniDec.exe opens the HDF5 for data processing, deconvolution, and analysis. Results are written back into the HDF5 file, which is read by the GUI for visualization. Text colors on the HDF5 file match the outlined regions of the GUI they are plotted in or taken from.
There are several initial steps to prepare the data for analysis. First, the data can optionally be binned to average n data points together. Binning offers an unbiased smoothing of the data and can be used to reduce the number of data points. Because the speed of deconvolution depends primarily on the number of data points and potential charge states, binning significantly speeds up the algorithm. Second, the data can optionally be limited to a specific m/z range. Third, any data points with zero intensity that are flanked by data points with zero intensity are removed. Removing these middle zeros speeds up the algorithm by removing useless data points. Fourth, data points with the same m/z values are averaged together to eliminate duplicates. Fifth, an optional background subtraction is performed using a curved background as previously described [15, 19]. Sixth, the data are optionally normalized to a maximum intensity of one. Finally, any negative intensities are set to zero. By looping through each spectrum in /ms_dataset, the /raw_data objects are converted to /processed_data objects. Together, these steps help to speed up the algorithm and avoid potential artifacts while minimizing distortion of the data.
The /processed_data object is then deconvolved using the conventional UniDec Bayesian deconvolution algorithm as previously described [19]. Each spectrum in /ms_dataset is deconvolved sequentially using parallelized deconvolution code. An alternative parallelization scheme with parallelized spectra and sequential deconvolution code did not show any speed advantage and introduced significant complexities to coordinate reading and writing of data between threads. Following deconvolution of each spectrum, the fit to /processed_data is written to /fit_data, the m/z vs. charge matrix is written to /mz_grid, and the mass vs. charge matrix is written to /mass_grid. By summing the mass vs. charge matrix along the charge axis, the mass vs. intensity spectrum is written to /mass_data. Summing the m/z vs. charge matrix along the m/z axis produces the total charge distribution, which is written to /charge_data.
Following deconvolution, the data are combined and summed. Because the m/z (/processed_data) and mass (/mass_data) axes of each spectrum may be different, a linear interpolation is applied with the /0 spectrum as a reference to make the m/z and mass axes the same for each spectrum. Note, this is only applied to the new global /mass_grid and /mz_grid and not to the data in each spectrum directory. The sum of the zero-charge mass spectra is used for peak detection by detecting local maxima within a specified window and above a specified threshold [19].
Finally, specified quantities are extracted from the data for each peak based on an optional specified window around each peak. Currently, there are several forms of extraction. The intensities can be extracted using the peak height, local max, or area. The mass of the peak can be extracted using the local max position or the center of mass for all intensities above a 0, 10, or 50% threshold. These allow a range of different quantitative experiments with the same framework.
UltraMeta for Visualization and Quantitation of Multiple Data Sets
We have also developed a module, called UltraMeta, to visualize and quantify multiple HDF5 data sets from MetaUniDec. The inputs to UltraMeta include the file name, the color and line style for plots, and the label for the legend. UltraMeta groups all files with the same legend label and assumes these are replicate experiments. During extraction, the replicate experiments are used to automatically generate error bars on the extracted values.
After supplying and grouping the input files, the user defines which peaks to extract, the type of extraction as defined above, the extraction window, and the normalization performed on the extraction. The peaks are automatically imported from MetaUniDec but can be manually adjusted or defined to investigate specific features. UltraMeta then passes the desired peaks back to the HDF5 files as peaks/ultrapeakdata. UniDec.exe performs the extraction and exports the mass and charge extracts as peaks/ultraextracts and peaks/ultrazextracts respectively. Thus, UltraMeta allows quantitation of a variety of parameters such as average mass, average charge, and peak area across multiple data sets. Furthermore, these extracted parameters can be automatically fit to sigmoidal, exponential, or linear functions with automatically generated error bars for multiple experiments. Thus, UltraMeta enables an integrated workflow for quantitative analysis of multiple data sets and replicate experiments.
H-NOX Native Mass Spectrometry
Ns H-NOX was expressed and purified from E. coli as previously described [52]. Briefly, the H-NOX was engineered into a pET21b+ plasmid with a C-terminal His6 affinity purification tag with TEV cleavage sequence. Expression was in Rosetta competent cells initially grown at 37 °C followed by protein induction with 0.5 mM IPTG at 16 °C and inclusion of 0.1 mM δ-aminolevulinic acid (ALA) to stimulate heme production. After cell lysis (French press) and removal of cell debris, the protein was loaded onto a HisTrap FF Ni-NTA affinity column (GE Healthcare, Uppsala, Sweden) and eluted by supplementing the buffer with 30 mM EDTA rather than imidazole to prevent imidazole-dependent heme extraction. After incubating at 4 °C overnight with TEV protease (1:100 protease:protein molar ratio), the sample was again passed over a HisTrap FF column. Cleaved protein was further purified using a Superdex 200 gel filtration column (GE Healthcare, Uppsala, Sweden) equilibrated with 20 mM Tris-HCl, pH 7.4, 100 mM NaCl. Protein concentrations were assessed based on Soret band absorption, and samples were frozen in liquid nitrogen for storage at −80 °C.
The final H-NOX protein was fully loaded with ferrous heme and quite pure. The final sequence after TEV cleavage was 190 residues long, one residue longer than native H-NOX due to the TEV cleavage site. The final eight residues, which are not conserved, differ from the wild type protein and have the sequence “GAENLYFQ”. The wild type sequence for this region is “DSNLYDD”.
For mass spectrometry experiments, purified H-NOX was diluted with 0.2 M ammonium acetate and exchanged into 0.2 M ammonium acetate (Sigma Aldrich, St. Louis, MO, USA) buffer using micro bio-spin columns with bio-gel P-6 (Bio-Rad, Hercules, CA, USA). Native MS was performed as previously described [37, 53]. Briefly, H-NOX samples were loaded into homemade nanoelectrospray needles coated in gold. Mass spectrometry was performed using a Q-Exactive HF mass spectrometer with UHMR modifications (Thermo Fisher Scientific, Bremen, Germany) [1]. Ionization was performed using static nanoelectrospray gold coated needles. Key parameters included, 15,000 resolution, 10 microscans, 50 ms max inject time, 4 ms in-source trapping time, 0 V source fragmentation, pulser mode 100, noise threshold 4, 4 V C-trap entrance lens, and nitrogen as the higher-energy collisional dissociation (HCD). Method files were created at different HCD gas pressure settings to automatically ramp the HCD voltage from 0 to 95 V in 5 V increments with 0.25 minute acquisitions at each step. The HCD gas pressure settings were set to 1, 3, or 5 in the vendor’s Tune software, and in-source trapping dissociation was performed with an HCD gas setting of 3 by adjusting the desolvation voltage from 0 to 300 V. These settings control the pressure in the HCD cell, which leaks upstream to affect the pressure in other regions of the instrument. Because there is no vacuum gauge in the injection flatapole where in-source trapping is performed or in the HCD cell, we have reported the gas pressure settings rather than the absolute pressures in the HCD cell. For reference, HCD gas settings of 1, 3, 5, 7, and 9 corresponded with a high vacuum reading in the quadrupole region of 31.6, 102, 168, 233, and 298 nanobar respectively.
In MetaUniDec, the charge range was 3 – 12, and the mass range was 20,000 – 25,000 Da. The mass was sampled every 1 Da, the peak full-width at half max (FWHM) was 1.15 Th (determined automatically) with a Gaussian peak shape function, and the charge smooth width was 1. Peak areas were extracted within an extraction window of ±150 Da.
Nanodisc Native Mass Spectrometry
Nanodiscs were created as previously described [54, 55]. Briefly, MSP1D1 scaffold protein was expressed in E. coli and purified by immobilized metal affinity chromatography. The polyhistidine tag was cleaved with TEV protease to create MSP1D1(−), which was mixed with 1-palmitoyl-2-oleoyl-sn-glycero-3-phosphocholine (POPC) lipids dissolved in cholate. Addition of Amberlite XAD-2 (Sigma Aldrich, St. Louis, MO, USA) initiated nanodisc assembly. Nanodiscs were purified using a Superose 6 Increase 10/300 column (GE Healthcare, Uppsala, Sweden) equilibrated in 0.2 M ammonium acetate. Eluted fractions were analyzed directly by native MS without further concentration.
Key parameters were the same as described above except for the pulsar mode was 0 and the HCD gas pressure settings were set to 5, 7 and 9. In-source trapping data were collected at an HCD gas pressure setting of 7. To collisionally activate the nanodisc complexes, we created methods files at different HCD gas pressure settings to automatically ramp the HCD voltage and in-source trapping desolvation voltage from 0 to 200 V in 20 V increments with 1 minute acquisitions at each step in the ramp. The deconvolution parameters were as follows: m/z range 5,000 – 20,000, background subtraction 100, charge range 1 – 30, mass range 20,000 – 200,000 Da with mass being sampled every 10 Da. The peak FWHM was 5.0 with a Gaussian peak shape function. Charge smooth width was set to 1.0, the mass difference was 760 Da, and the mass smooth width was 1.0. Peaks were extracted using the center of mass above a 50% intensity threshold with an extraction window of 50,000.
Results and Discussion
Performance
To compare the performance of MetaUniDec and batch processing with conventional UniDec, we compared six nanodisc data sets and six H-NOX data sets collected over a range of collision voltages. Each nanodisc data set contained 11 spectra, and each H-NOX dataset contained 20 spectra. We collected the data using an automated method as a single Thermo RAW file, parsed the data into an HDF5 using the automatic chromatogram parser in MetaUniDec, and then exported each of the spectra as text files for conventional UniDec analysis. Timing analysis was performed on a laptop with an Intel Core i7-6700 CPU (2.6 GHz, 4 cores, 8 threads).
Comparing the total execution time for data processing, deconvolution, and extraction of the center of mass, we observed that MetaUniDec was 2.3±0.1 times faster than UniDec batch processing for nanodiscs and 7.0±0.6 times faster for H-NOX (Figure S-1B and C). This improvement in speed is likely the result of speed enhancements from moving the Python functions to C and the improved data reading and writing speed of the HDF5 file compared with the text files used by conventional UniDec. Analysis of the parallelization efficiency of the nanodisc data sets (Figure S-1A) showed improved speed with additional cores but was less than ideal due to non-parallelizable functions such as reading and writing to the HDF5 files.
Similar improvements are observed in the hands-on time it takes for the user to perform the analysis. To process three H-NOX files from raw data to a final VC50 (described below) with conventional UniDec batch processing required two custom Python scripts and 6.07±0.06 minutes. In contrast, MetaUniDec was able to perform the same analysis in 2.12±0.03 minutes with an entirely integrated GUI workflow. Although UniDec is able to batch process spectra, it still requires manual selection of spectra within a single data set. MetaUniDec offers batch processing of entire datasets, which greatly streamlines the analysis of multiple experiments at once. Thus, MetaUniDec shows better scalability across multiple data sets. Finally, comparison of file sizes (Figure S-1D and E) showed that the total file size for the HDF5 files from H-NOX and nanodiscs was respectively 43% and 82% of the batch-processed files from conventional UniDec.
To demonstrate the performance on a large data file, we collection a 65 minute acquisition of H-NOX at an HCD pressure setting of 3 and an HCD collision voltage of 20 V. In total, this long acquisition file contained 5,153 spectra. Batch processing with conventional UniDec led to the creation of 61,836 separate files with a combined size of 8.9 GB. Processing with MetaUniDec created a single HDF5 file with a size of 5.8 GB, demonstrating the improved portability with the HDF5 format. Conventional UniDec required 46±3 minutes to execute while MetaUniDec required only 4.98±0.07 minutes, over a nine-fold speed enhancement. Interestingly, it was not possible to batch process 5,153 file in conventional UniDec due to fundamental limitations on the number of files that can be selected at once in the Windows file system, so we have reported the combined execution time over two smaller batches. Together, these results demonstrate the superior performance of MetaUniDec for large data sets and long chromatograms.
Application to Collision Induced Dissociation of H-NOX
To monitor the behavior of a small soluble protein, we performed collisional activation of bacterial H-NOX protein in the HCD cell, which loses a heme group upon sufficient activation. Heme loss provides a clean transition (Figure 3C) to monitor the internal energy of the ions under different instrumental conditions. With each HCD gas pressure, the HCD voltage was ramped from 0 to 95 V in 5 V increments with 0.25 minute acquisitions at each step. The chromatograms were imported into HDF5 by averaging each step into a single spectrum. Different gas pressures were applied in the HCD cell. All measurements were performed with the same sample but triplicate nESI needles (Figure 3D). Because each of the 9 data sets contained 20 spectra, the total number of spectra in the global data set was 180.
Figure 3.
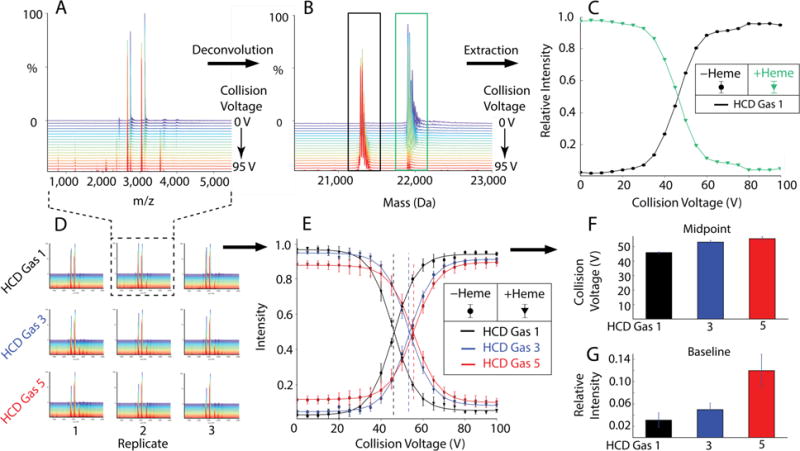
MetaUniDec analysis of H-NOX. (A) A single data set with collision voltage ramping in 5V increments from 0 to 95V is deconvolved into (B) the corresponding mass distributions. Integration of the holo (green) and apo (black) forms is plotted in (C). Results from multiple data sets (D) are extracted and plotted in (E). Sigmoidal fits to the extracted peak areas reveal the VC50 (F) and baseline dissociation (G). Vertical lines in E represent the midpoints of the sigmoidal fit.
Because loss of the heme causes a shift in the charge state distribution (Figure S-2), deconvolution and summation of all charge states is required to achieve accurate quantitation of the relative distribution between holo and apo forms. MetaUniDec was used to deconvolve the m/z data (Figure 3A) into a set of zero-charge mass spectra (Figure 3B). For each data set, relative peak areas normalized to a total of 100% for both the holo-protein and the apo-protein were plotted as a function of collision voltage (Figure 3C and 3E). Each of these collisional dissociation curves was fit to a sigmoid to determine the voltage at which 50% of the species is decayed, which is sometimes referred to as the VC50 (Figure 3F) [56].
We observed that increased gas pressure initially shifts the dissociation of the heme-protein complex to higher collisional energy, but this effect plateaus after an HCD gas setting of 3. Thus, increasing the HCD pressure up to 3 will provide a more gentle dissociation, but settings above 3 have little effect on the VC50. However, although the VC50 plateaus, higher gas pressure shows an increasing level of baseline activation (Figure 3F) that is present at all collision energies. We believe that this baseline activation is caused by activation of ions as they are injected into the Orbitrap. The increased pressure in the HCD cell leaks upstream into the C-trap and Orbitrap, and increased pressures in the C-trap collisionally activate the ions to a small degree as they are injected into the Orbitrap. A similar analysis was performed using activation in the in-source trapping (IST), which is applied in the injection flatapole region. The IST activation and trapping conditions were not able to activate the smaller H-NOX beyond around 50% dissociation even at very high collision voltage (Figure S-3). Thus, IST activation on the UHMR Q-Exactive HF is limited for collisional activation of smaller ions. MetaUniDec allows these types of collision induced dissociation (CID) experiments to be analyzed and visualized in a high-throughput manner with a unified workflow from data to final fits.
Application to CID of Nanodiscs
To probe the collisional activation of larger complexes, we performed native MS on POPC MSP1D1(−) nanodiscs using different gas pressures applied in the HCD cell and with activation in the in-source trapping region. Nanodiscs are nanoscale lipoprotein particles consisting of a lipid bilayer surrounded by two membrane scaffold protein (MSP) belts and are a promising system for studying membrane proteins by native MS. All measurements were performed with triplicate nanodisc assembly reactions with different needles for each sample (Figure 4D). The collision voltage in either the HCD or IST regions was ramped from 0 to 200 V in 20 V steps with 1 min acquisitions at each step. Each 1 min acquisition was averaged into a single spectrum for data processing. Because each of the 15 data sets contained 11 spectra, the total number of spectra in the global data set was 165.
Figure 4.
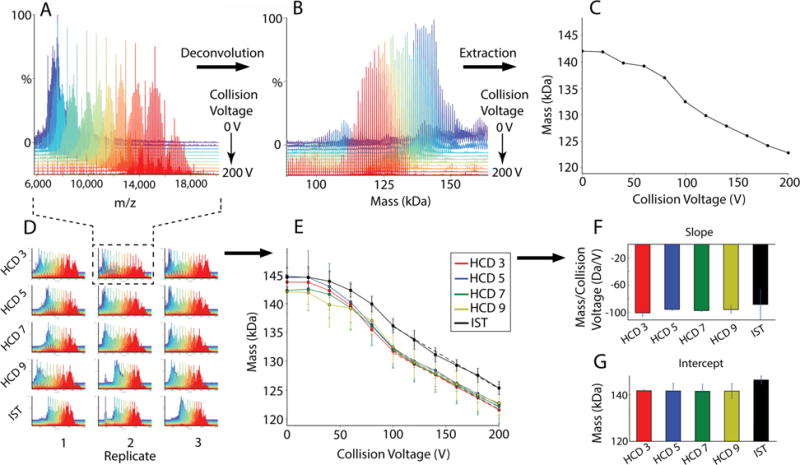
MetaUniDec analysis of nanodisc data sets. A representative data set (A) is deconvolved to get the mass distribution (B), which is distilled into the average mass (C). Deconvolution of multiple data sets (D) provides average mass as a function of collision voltage (E). A linear fit (dashed lines) to the 100-200 V region shows no significant changes in the slope of the line (F) but shows a shift in the intercept of the linear fit with in-source trapping activation (G), which shows that a higher voltage is required in the IST region to achieve the same level of HCD activation.
Because nanodiscs contain around 130 lipids and two MSP belts, there is an intrinsic distribution in the number of lipids per nanodiscs of about ±5 lipids [53, 57]. As observed previously [19, 57], nanodiscs fragment gradually under increasing collisional activation, losing charge and mass in a continuous manner (Figure 4A and 4B). Thus, rather than measure the intensity of specific peaks as described above, we extracted the average mass weighted by the intensity of the peaks above a 50% threshold (Figure 4C).
In contrast to H-NOX, no significant differences in activation were observed for nanodiscs with HCD activation at different pressures (Figure 4E). Combined with results from H-NOX, this suggests that changes to the HCD gas setting above 3 do not significantly affect collisional dissociation, but it may also be that larger ions are less influenced by HCD pressure under these instrumental conditions. However, nanodiscs activated in the IST region showed mildly higher masses throughout the same collisional energy range. When fitting the linear region from 100 to 200 V, the slope of the mass loss (Figure 4F) is the same with the IST, but the intercept is higher (Figure 4G). Thus, to compensate for this higher intercept, 35±3 extra volts of IST activation are required to achieve the same level of activation as HCD.
These data provide a quantitative description of the role of pressure on the dissociation of macromolecular complexes, which is important because instrumental pressures are crucial for effective transmission of larger m/z ions [58]. At moderate to high levels of HCD pressure, there is very little influence of increasing pressure on HCD dissociation except for a small amount of background activation. However, activation in the higher pressure in-source trapping region requires a higher voltage to achieve the same level of activation as the HCD cell.
One final question is how the UHMR Orbitrap instrument compares with a more conventional quadrupole time-of-flight (Q-ToF) instrument. Because nanodiscs show a continuous loss of lipids with increasing CID, we can compare the relative levels of activation observed on the UHMR with previously published data from a Waters Synapt G1 [19]. Although these nanodiscs were not the same physical sample, they were prepared with the same protocol and contents. The dissociation shows remarkable quantitative agreement in average mass as a function of collision voltage (Figure S-4). The Q-ToF activation curve is generally closer to the HCD than the IST curve, and it is within error of the HCD curve at all collision voltage steps. IST activation shows higher masses and thus less dissociation at higher collision voltages. Another difference is that the UHMR shows improved desolvation at low collision voltages as the Q-ToF was not as effective at resolving nanodisc peaks below 50 V. However, for POPC nanodiscs, we conclude that the similarities between the Orbitrap and Q-ToF instruments are greater than their differences.
MetaUniDec provides a rapid and automated means of quantitatively monitoring the mass as a function of collision voltage. In addition to nanodisc systems, these tools will be useful for quantitation of labelling experiments, including hydroxyl-radical footprinting or gas-phase hydrogen/deuterium exchange, which both show a shift in mass as a function of labelling time [59–61]. Similarly, because average mass can be used to determine the drug-to-antibody ratio or the glycosylation state, monitoring the average mass or the intensities of specific peak as a function of processing parameters will be useful in characterization of therapeutic antibodies [62].
Conclusions
MetaUniDec provides simplified high-throughput data analysis for extracting mass and intensity information from native mass spectra. Compared to batch processing with conventional UniDec, MetaUniDec was faster and reduced file sizes. To quantitate the energetic differences between different forms of activation, we analyzed the intensity and average mass of H-NOX and nanodiscs respectively as a functional of collision voltage applied in both the HCD and in-source trapping region. With increased HCD pressure, H-NOX showed an initial increase in the VC50 followed by an increase in the baseline activation. In contrast, nanodiscs did not show a significant increase in activation with increasing HCD pressure but showed an offset towards lower activation when subjected to in-source trapping activation. These applications demonstrate the utility of MetaUniDec for high-throughput deconvolution of mass spectra and provide a more quantitative picture of relative activation energy differences with an UHMR Q-Exactive.
Supplementary Material
Acknowledgments
The authors thank Maria Reinhardt-Szyba and Alexander Makarov at Thermo Fisher Scientific for helpful discussions and support on the UHMR modification of the Q-Exactive HF instrument. The pMSP1D1 plasmid was a gift from Stephen Sligar (Addgene plasmid #20061). This work was funded by an American Cancer Society Institutional Research Grant (IRG-16-124-37-IRG) and the Bisgrove Scholar Award from Science Foundation Arizona to M.T.M.; by National Institutes of Health grants R01 GM117357 and P30 CA023074 to W.R.M., and T32 GM008804 to J.W.; and American Heart Association grant 16PRE31090034 to J.W.
Footnotes
Resources
The compiled program and source code for the UniDec executable, Python API, and GUI are available online: https://github.com/michaelmarty/UniDec.
References
- 1.van de Waterbeemd M, Fort KL, Boll D, Reinhardt-Szyba M, Routh A, Makarov A, Heck AJ. High-fidelity mass analysis unveils heterogeneity in intact ribosomal particles. Nat Methods. 2017;14:283–286. doi: 10.1038/nmeth.4147. [DOI] [PubMed] [Google Scholar]
- 2.Yang Y, Liu F, Franc V, Halim LA, Schellekens H, Heck AJR. Hybrid mass spectrometry approaches in glycoprotein analysis and their usage in scoring biosimilarity. Nat Commun. 2016;7:13397. doi: 10.1038/ncomms13397. [DOI] [PMC free article] [PubMed] [Google Scholar]
- 3.Gault J, Donlan JAC, Liko I, Hopper JTS, Gupta K, Housden NG, Struwe WB, Marty MT, Mize T, Bechara C, Zhu Y, Wu B, Kleanthous C, Belov M, Damoc E, Makarov A, Robinson CV. High-resolution mass spectrometry of small molecules bound to membrane proteins. Nat Methods. 2016;13:333–336. doi: 10.1038/nmeth.3771. [DOI] [PMC free article] [PubMed] [Google Scholar]
- 4.Rose RJ, Damoc E, Denisov E, Makarov A, Heck AJR. High-sensitivity Orbitrap mass analysis of intact macromolecular assemblies. Nat Methods. 2012;9:1084–1086. doi: 10.1038/nmeth.2208. [DOI] [PubMed] [Google Scholar]
- 5.Rajabi K, Ashcroft AE, Radford SE. Mass spectrometric methods to analyze the structural organization of macromolecular complexes. Methods. 2015;89:13–21. doi: 10.1016/j.ymeth.2015.03.004. [DOI] [PubMed] [Google Scholar]
- 6.Chait BT, Cadene M, Olinares PD, Rout MP, Shi Y. Revealing Higher Order Protein Structure Using Mass Spectrometry. J Am Soc Mass Spectrom. 2016;27:952–965. doi: 10.1007/s13361-016-1385-1. [DOI] [PMC free article] [PubMed] [Google Scholar]
- 7.Landreh M, Marty MT, Gault J, Robinson CV. A sliding selectivity scale for lipid binding to membrane proteins. Curr Opin Struct Biol. 2016;39:54–60. doi: 10.1016/j.sbi.2016.04.005. [DOI] [PMC free article] [PubMed] [Google Scholar]
- 8.Liko I, Allison TM, Hopper JTS, Robinson CV. Mass spectrometry guided structural biology. Curr Opin Struct Biol. 2016;40:136–144. doi: 10.1016/j.sbi.2016.09.008. [DOI] [PubMed] [Google Scholar]
- 9.Leney AC, Heck AJ. Native Mass Spectrometry: What is in the Name? J Am Soc Mass Spectrom. 2017;28:5–13. doi: 10.1007/s13361-016-1545-3. [DOI] [PMC free article] [PubMed] [Google Scholar]
- 10.Eschweiler JD, Kerr R, Rabuck-Gibbons J, Ruotolo BT. Sizing Up Protein-Ligand Complexes: The Rise of Structural Mass Spectrometry Approaches in the Pharmaceutical Sciences. Annu Rev Anal Chem. 2017;10:25–44. doi: 10.1146/annurev-anchem-061516-045414. [DOI] [PubMed] [Google Scholar]
- 11.Terral G, Beck A, Cianferani S. Insights from native mass spectrometry and ion mobility-mass spectrometry for antibody and antibody-based product characterization. J Chromatogr B Analyt Technol Biomed Life Sci. 2016;1032:79–90. doi: 10.1016/j.jchromb.2016.03.044. [DOI] [PubMed] [Google Scholar]
- 12.Eschweiler JD, Rabuck-Gibbons JN, Tian Y, Ruotolo BT. CIUSuite: A Quantitative Analysis Package for Collision Induced Unfolding Measurements of Gas-Phase Protein Ions. Anal Chem. 2015;87:11516–11522. doi: 10.1021/acs.analchem.5b03292. [DOI] [PubMed] [Google Scholar]
- 13.Migas LG, France AP, Bellina B, Barran PE. ORIGAMI: A software suite for activated ion mobility mass spectrometry (aIM-MS) applied to multimeric protein assemblies. Int J Mass Spectrom. 2017 doi: 10.1016/j.ijms.2017.1008.1014. [DOI] [Google Scholar]
- 14.Allison TM, Reading E, Liko I, Baldwin AJ, Laganowsky A, Robinson CV. Quantifying the stabilizing effects of protein-ligand interactions in the gas phase. Nat Commun. 2015;6:8551. doi: 10.1038/ncomms9551. [DOI] [PMC free article] [PubMed] [Google Scholar]
- 15.Morgner N, Robinson CV. Massign: An Assignment Strategy for Maximizing Information from the Mass Spectra of Heterogeneous Protein Assemblies. Anal Chem. 2012;84:2939–2948. doi: 10.1021/ac300056a. [DOI] [PubMed] [Google Scholar]
- 16.Sivalingam GN, Yan J, Sahota H, Thalassinos K. Amphitrite: A program for processing travelling wave ion mobility mass spectrometry data. Int J Mass Spectrom. 2013;345–347:54–62. doi: 10.1016/j.ijms.2012.09.005. [DOI] [PMC free article] [PubMed] [Google Scholar]
- 17.Tseng YH, Uetrecht C, Yang SC, Barendregt A, Heck AJR, Peng WP. Game-Theory-Based Search Engine to Automate the Mass Assignment in Complex Native Electrospray Mass Spectra. Anal Chem. 2013;85:11275–11283. doi: 10.1021/ac401940e. [DOI] [PubMed] [Google Scholar]
- 18.Cleary SP, Thompson AM, Prell JS. Fourier Analysis Method for Analyzing Highly Congested Mass Spectra of Ion Populations with Repeated Subunits. Anal Chem. 2016;88:6205–6213. doi: 10.1021/acs.analchem.6b01088. [DOI] [PubMed] [Google Scholar]
- 19.Marty MT, Baldwin AJ, Marklund EG, Hochberg GK, Benesch JL, Robinson CV. Bayesian deconvolution of mass and ion mobility spectra: from binary interactions to polydisperse ensembles. Anal Chem. 2015;87:4370–4376. doi: 10.1021/acs.analchem.5b00140. [DOI] [PMC free article] [PubMed] [Google Scholar]
- 20.Lu J, Trnka MJ, Roh SH, Robinson PJJ, Shiau C, Fujimori DG, Chiu W, Burlingame AL, Guan S. Improved Peak Detection and Deconvolution of Native Electrospray Mass Spectra from Large Protein Complexes. J Am Soc Mass Spectrom. 2015;26:2141–2151. doi: 10.1007/s13361-015-1235-6. [DOI] [PMC free article] [PubMed] [Google Scholar]
- 21.Cong X, Liu Y, Liu W, Liang X, Russell DH, Laganowsky A. Determining Membrane Protein–Lipid Binding Thermodynamics Using Native Mass Spectrometry. J Am Chem Soc. 2016;138:4346–4349. doi: 10.1021/jacs.6b01771. [DOI] [PubMed] [Google Scholar]
- 22.Hopper JTS, Ambrose S, Grant OC, Krumm SA, Allison TM, Degiacomi MT, Tully MD, Pritchard LK, Ozorowski G, Ward AB, Crispin M, Doores KJ, Woods RJ, Benesch JLP, Robinson CV, Struwe WB. The Tetrameric Plant Lectin BanLec Neutralizes HIV through Bidentate Binding to Specific Viral Glycans. Structure. 2017;25:773–782.e775. doi: 10.1016/j.str.2017.03.015. [DOI] [PMC free article] [PubMed] [Google Scholar]
- 23.Yao Y, Richards MR, Kitova EN, Klassen JS. Influence of Sulfolane on ESI-MS Measurements of Protein–Ligand Affinities. J Am Soc Mass Spectrom. 2015;27:498–506. doi: 10.1007/s13361-015-1312-x. [DOI] [PubMed] [Google Scholar]
- 24.Reading E, Walton TA, Liko I, Marty MT, Laganowsky A, Rees DC, Robinson CV. The Effect of Detergent, Temperature, and Lipid on the Oligomeric State of MscL Constructs: Insights from Mass Spectrometry. Chem Biol. 2015;22:593–603. doi: 10.1016/j.chembiol.2015.04.016. [DOI] [PMC free article] [PubMed] [Google Scholar]
- 25.Laganowsky A, Reading E, Allison TM, Ulmschneider MB, Degiacomi MT, Baldwin AJ, Robinson CV. Membrane proteins bind lipids selectively to modulate their structure and function. Nature. 2014;510:172–175. doi: 10.1038/nature13419. [DOI] [PMC free article] [PubMed] [Google Scholar]
- 26.Benesch JLP, Aquilina JA, Baldwin AJ, Rekas A, Stengel F, Lindner RA, Basha E, Devlin GL, Horwitz J, Vierling E, Carver JA, Robinson CV. The Quaternary Organization and Dynamics of the Molecular Chaperone HSP26 Are Thermally Regulated. Chem Biol. 2010;17:1008–1017. doi: 10.1016/j.chembiol.2010.06.016. [DOI] [PMC free article] [PubMed] [Google Scholar]
- 27.Stengel F, Baldwin AJ, Painter AJ, Jaya N, Basha E, Kay LE, Vierling E, Robinson CV, Benesch JL. Quaternary dynamics and plasticity underlie small heat shock protein chaperone function. Proc Natl Acad Sci. 2010;107:2007–2012. doi: 10.1073/pnas.0910126107. [DOI] [PMC free article] [PubMed] [Google Scholar]
- 28.Baldwin Andrew J, Lioe H, Hilton Gillian R, Baker Lindsay A, Rubinstein John L, Kay Lewis E, Benesch Justin LP. The Polydispersity of αB-Crystallin Is Rationalized by an Interconverting Polyhedral Architecture. Structure. 2011;19:1855–1863. doi: 10.1016/j.str.2011.09.015. [DOI] [PubMed] [Google Scholar]
- 29.Baldwin AJ, Lioe H, Robinson CV, Kay LE, Benesch JLP. αB-Crystallin Polydispersity Is a Consequence of Unbiased Quaternary Dynamics. J Mol Biol. 2011;413:297–309. doi: 10.1016/j.jmb.2011.07.016. [DOI] [PubMed] [Google Scholar]
- 30.Belov AM, Viner R, Santos MR, Horn DM, Bern M, Karger BL, Ivanov AR. Analysis of Proteins, Protein Complexes, and Organellar Proteomes Using Sheathless Capillary Zone Electrophoresis - Native Mass Spectrometry. J Am Soc Mass Spectrom. 2017 doi: 10.1007/s13361-13017-11781-13361. [DOI] [PMC free article] [PubMed] [Google Scholar]
- 31.Bungard D, Copple JS, Yan J, Chhun JJ, Kumirov VK, Foy SG, Masel J, Wysocki VH, Cordes MHJ. Foldability of a Natural De Novo Evolved Protein. Structure. 2017;25:1687–1696 e1684. doi: 10.1016/j.str.2017.09.006. [DOI] [PMC free article] [PubMed] [Google Scholar]
- 32.Cai W, Guner H, Gregorich ZR, Chen AJ, Ayaz-Guner S, Peng Y, Valeja SG, Liu X, Ge Y. MASH Suite Pro: A Comprehensive Software Tool for Top-Down Proteomics. Mol Cell Proteomics. 2016;15:703–714. doi: 10.1074/mcp.O115.054387. [DOI] [PMC free article] [PubMed] [Google Scholar]
- 33.Calabrese AN, Jackson SM, Jones LN, Beckstein O, Heinkel F, Gsponer J, Sharples D, Sans M, Kokkinidou M, Pearson AR, Radford SE, Ashcroft AE, Henderson PJF. Topological Dissection of the Membrane Transport Protein Mhp1 Derived from Cysteine Accessibility and Mass Spectrometry. Anal Chem. 2017 doi: 10.1021/acs.analchem.7b01310. [DOI] [PMC free article] [PubMed] [Google Scholar]
- 34.Campuzano IDG, Li HL, Bagal D, Lippens JL, Svitel J, Kurzeja RJM, Xu H, Schnier PD, Loo JA. Native MS Analysis of Bacteriorhodopsin and an Empty Nanodisc by Orthogonal Acceleration Time-of-Flight, Orbitrap and Ion Cyclotron Resonance. Anal Chem. 2016;88:12427–12436. doi: 10.1021/acs.analchem.6b03762. [DOI] [PMC free article] [PubMed] [Google Scholar]
- 35.Gupta K, Donlan JAC, Hopper JTS, Uzdavinys P, Landreh M, Struwe WB, Drew D, Baldwin AJ, Stansfeld PJ, Robinson CV. The role of interfacial lipids in stabilizing membrane protein oligomers. Nature. 2017;541:421–424. doi: 10.1038/nature20820. [DOI] [PMC free article] [PubMed] [Google Scholar]
- 36.Hendus-Altenburger R, Pedraz-Cuesta E, Olesen CW, Papaleo E, Schnell JA, Hopper JTS, Robinson CV, Pedersen SF, Kragelund BB. The human Na+/H+ exchanger 1 is a membrane scaffold protein for extracellular signal-regulated kinase 2. BMC Biol. 2016;14:31. doi: 10.1186/s12915-016-0252-7. [DOI] [PMC free article] [PubMed] [Google Scholar]
- 37.Hoi KK, Robinson CV, Marty MT. Unraveling the Composition and Behavior of Heterogeneous Lipid Nanodiscs by Mass Spectrometry. Anal Chem. 2016;88:6199–6204. doi: 10.1021/acs.analchem.6b00851. [DOI] [PMC free article] [PubMed] [Google Scholar]
- 38.Iadanza MG, Higgins AJ, Schiffrin B, Calabrese AN, Brockwell DJ, Ashcroft AE, Radford SE, Ranson NA. Lateral opening in the intact beta-barrel assembly machinery captured by cryo-EM. Nat Commun. 2016;7:12865. doi: 10.1038/ncomms12865. [DOI] [PMC free article] [PubMed] [Google Scholar]
- 39.Larson AG, Elnatan D, Keenen MM, Trnka MJ, Johnston JB, Burlingame AL, Agard DA, Redding S, Narlikar GJ. Liquid droplet formation by HP1α suggests a role for phase separation in heterochromatin. Nature. 2017;547:236. doi: 10.1038/nature22822. [DOI] [PMC free article] [PubMed] [Google Scholar]
- 40.Li J, Richards MR, Bagal D, Campuzano IDG, Kitova EN, Xiong ZJ, Prive GG, Klassen JS. Characterizing the Size and Composition of Saposin A Lipoprotein Picodiscs. Anal Chem. 2016;88:9524–9531. doi: 10.1021/acs.analchem.6b02097. [DOI] [PubMed] [Google Scholar]
- 41.Liu Y, Cong X, Liu W, Laganowsky A. Characterization of Membrane Protein-Lipid Interactions by Mass Spectrometry Ion Mobility Mass Spectrometry. J Am Soc Mass Spectrom. 2017;28:579–586. doi: 10.1007/s13361-016-1555-1. [DOI] [PubMed] [Google Scholar]
- 42.Marty MT, Hoi KK, Gault J, Robinson CV. Probing the Lipid Annular Belt by Gas-Phase Dissociation of Membrane Proteins in Nanodiscs. Angew Chem Int Ed Engl. 2016;55:550–554. doi: 10.1002/anie.201508289. [DOI] [PMC free article] [PubMed] [Google Scholar]
- 43.Morgner N, Schmidt C, Beilsten-Edmands V, Ebong I-o, Patel NA, Clerico EM, Kirschke E, Daturpalli S, Jackson SE, Agard D, Robinson CV. Hsp70 Forms Antiparallel Dimers Stabilized by Post-translational Modifications to Position Clients for Transfer to Hsp90. Cell Rep. 2015;11:759–769. doi: 10.1016/j.celrep.2015.03.063. [DOI] [PMC free article] [PubMed] [Google Scholar]
- 44.Root K, Wittwer Y, Barylyuk K, Anders U, Zenobi R. Insight into Signal Response of Protein Ions in Native ESI-MS from the Analysis of Model Mixtures of Covalently Linked Protein Oligomers. J Am Soc Mass Spectrom. 2017 doi: 10.1007/s13361-13017-11690-13363. [DOI] [PubMed] [Google Scholar]
- 45.Rouse SL, Hawthorne WJ, Berry JL, Chorev DS, Ionescu SA, Lambert S, Stylianou F, Ewert W, Mackie U, Morgan RML, Otzen D, Herbst FA, Nielsen PH, Dueholm M, Bayley H, Robinson CV, Hare S, Matthews S. A new class of hybrid secretion system is employed in Pseudomonas amyloid biogenesis. Nat Commun. 2017;8:263. doi: 10.1038/s41467-017-00361-6. [DOI] [PMC free article] [PubMed] [Google Scholar]
- 46.Schiffrin B, Calabrese AN, Higgins AJ, Humes JR, Ashcroft AE, Kalli AC, Brockwell DJ, Radford SE. Effects of periplasmic chaperones and membrane thickness on BamA-catalysed outer membrane protein folding. J Mol Biol. 2017 doi: 10.1016/j.jmb.2017.09.008. [DOI] [PMC free article] [PubMed] [Google Scholar]
- 47.Smith FD, Esseltine JL, Nygren PJ, Veesler D, Byrne DP, Vonderach M, Strashnov I, Eyers CE, Eyers PA, Langeberg LK, Scott JD. Local protein kinase A action proceeds through intact holoenzymes. Science. 2017;356:1288–1293. doi: 10.1126/science.aaj1669. [DOI] [PMC free article] [PubMed] [Google Scholar]
- 48.Uppal SS, Beasley SE, Scian M, Guttman M. Gas-Phase Hydrogen/Deuterium Exchange for Distinguishing Isomeric Carbohydrate Ions. Anal Chem. 2017;89:4737–4742. doi: 10.1021/acs.analchem.7b00683. [DOI] [PubMed] [Google Scholar]
- 49.Xuan W, Surman AJ, Zheng Q, Long DL, Cronin L. Self-Templating and In Situ Assembly of a Cubic Cluster-of-Clusters Architecture Based on a {Mo24Fe12} Inorganic Macrocycle. Angew Chem Int Ed. 2016;55:12703–12707. doi: 10.1002/anie.201603298. [DOI] [PMC free article] [PubMed] [Google Scholar]
- 50.Yen HY, Liko I, Allison TM, Robinson CV, Hopper JTS, Liko I, Zhu Y, Wang D, Wu B, Wang D, Wu B, Stegmann M, Mohammed S. Ligand binding to a G protein-coupled receptor captured in a mass spectrometer. Sci Adv. 2017;3:e1701016. doi: 10.1126/sciadv.1701016. [DOI] [PMC free article] [PubMed] [Google Scholar]
- 51.Hierarchical Data Format, version 5. The HDF Group; 1997–2017. [Google Scholar]
- 52.Wales JA, Chen CY, Breci L, Weichsel A, Bernier SG, Sheppeck JE, 2nd, Solinga R, Nakai T, Renhowe PA, Jung J, Montfort WR. Discovery of stimulator binding to a conserved pocket in the heme domain of soluble guanylyl cyclase. J Biol Chem. 2018;293:1850–1864. doi: 10.1074/jbc.RA117.000457. [DOI] [PMC free article] [PubMed] [Google Scholar]
- 53.Marty MT, Zhang H, Cui W, Blankenship RE, Gross ML, Sligar SG. Native mass spectrometry characterization of intact nanodisc lipoprotein complexes. Anal Chem. 2012;84:8957–8960. doi: 10.1021/ac302663f. [DOI] [PMC free article] [PubMed] [Google Scholar]
- 54.Denisov IG, Grinkova YV, Lazarides AA, Sligar SG. Directed self-assembly of monodisperse phospholipid bilayer nanodiscs with controlled size. J Am Chem Soc. 2004;126:3477–3487. doi: 10.1021/ja0393574. [DOI] [PubMed] [Google Scholar]
- 55.Ritchie TK, Grinkova YV, Bayburt TH, Denisov IG, Zolnerciks JK, Atkins WM, Sligar SG. In: Reconstitution of Membrane Proteins in Phospholipid Bilayer Nanodiscs. Nejat D, editor. Academic Press; San Diego, CA: 2009. [DOI] [PMC free article] [PubMed] [Google Scholar]
- 56.Rogniaux H, Van Dorsselaer A, Barth P, Biellmann JF, Barbanton J, van Zandt M, Chevrier B, Howard E, Mitschler A, Potier N, Urzhumtseva L, Moras D, Podjarny A. Binding of aldose reductase inhibitors: correlation of crystallographic and mass spectrometric studies. J Am Soc Mass Spectrom. 1999;10:635–647. doi: 10.1016/S1044-0305(99)00030-6. [DOI] [PubMed] [Google Scholar]
- 57.Marty MT, Zhang H, Cui W, Gross ML, Sligar SG. Interpretation and deconvolution of nanodisc native mass spectra. J Am Soc Mass Spectrom. 2014;25:269–277. doi: 10.1007/s13361-013-0782-y. [DOI] [PMC free article] [PubMed] [Google Scholar]
- 58.Rosati S, Rose RJ, Thompson NJ, van Duijn E, Damoc E, Denisov E, Makarov A, Heck AJ. Exploring an orbitrap analyzer for the characterization of intact antibodies by native mass spectrometry. Angew Chem Int Ed. 2012;51:12992–12996. doi: 10.1002/anie.201206745. [DOI] [PubMed] [Google Scholar]
- 59.Mistarz Ulrik H, Brown Jeffery M, Haselmann Kim F, Rand Kasper D. Probing the Binding Interfaces of Protein Complexes Using Gas-Phase H/D Exchange Mass Spectrometry. Structure. 2016;24:310–318. doi: 10.1016/j.str.2015.11.013. [DOI] [PubMed] [Google Scholar]
- 60.Beeston HS, Ault JR, Pringle SD, Brown JM, Ashcroft AE. Changes in protein structure monitored by use of gas-phase hydrogen/deuterium exchange. Proteomics. 2015;15:2842–2850. doi: 10.1002/pmic.201400440. [DOI] [PMC free article] [PubMed] [Google Scholar]
- 61.Hambly D, Gross M. Laser flash photolysis of hydrogen peroxide to oxidize protein solvent-accessible residues on the microsecond timescale. J Am Soc Mass Spectrom. 2005;16:2057–2063. doi: 10.1016/j.jasms.2005.09.008. [DOI] [PubMed] [Google Scholar]
- 62.Tang Y, Tang F, Yang Y, Zhao L, Zhou H, Dong J, Huang W. Real-Time Analysis on Drug-Antibody Ratio of Antibody-Drug Conjugates for Synthesis, Process Optimization, and Quality Control. Sci Rep. 2017;7:7763. doi: 10.1038/s41598-017-08151-2. [DOI] [PMC free article] [PubMed] [Google Scholar]
Associated Data
This section collects any data citations, data availability statements, or supplementary materials included in this article.