

Abstract
Background.
Since 2012, the Centers for Disease Control and Prevention (CDC) has implemented Tips From Former Smokers (Tips), the first federally funded tobacco education campaign in the United States. To date, there are no evaluations of its long-term impact.
Aims.
To assess the impact of varied doses of the Tips campaign from 2012 through 2015 on cessation-related behaviors and intentions among U.S. smokers.
Method.
We used a national probability-based online survey of cigarette smokers (n = 22,189) and recent quitters (n = 776) to examine associations between doses of Tips advertising, measured by gross rating points (GRPs), and intentions to quit smoking in the next 30 days and quit attempts within the past 3 months. A curvilinear (i.e., square root) functional form of GRPs was used to capture patterns of diminishing effects at higher GRP levels.
Results.
An increase of 1,000 quarterly Tips GRPs at the media market level was associated with increased odds of making a quit attempt in the past 3 months (adjusted odds ratio = 1.23, p < .001) and increased odds of intending to quit in the next 30 days (adjusted odds ratio = 1.17, p = .030).
Discussion.
Results suggest that CDC-recommended media buys of 800 to 1,000 GRPs per quarter are sufficient to generate statistically significant increases in the likelihood of quit attempts in the past quarter.
Conclusions.
The Tips campaign has had a substantial impact on cessation behaviors among U.S. adult smokers over time. These data support the continued use of graphic and/or emotional media campaigns that encourage smokers to quit to further reduce tobacco use in the United States.
Keywords: health behavior, media, outcome evaluation, smoking and tobacco use, tobacco control and policy
Although significant progress has been made in reducing cigarette smoking in the United States in recent decades, the prevalence of cigarette smoking among adults remains at 16.8% as of 2014, representing 40 million smokers (Jamal et al., 2015). Tobacco smoking is the leading cause of preventable disease and death in the United States, with approximately 480,000 people dying from smoking-related illnesses each year. Additionally, smoking costs the United States an estimated $170 billion in medical care and over $150 billion in lost productivity per year from premature deaths (U.S. Department of Health & Human Services, 2014; Xu, Bishop, Kennedy, Simpson, & Pechacek, 2015).
In the United States, mass media campaigns to prevent and reduce cigarette smoking have been implemented for at least 50 years, with the earliest evaluations of these campaigns beginning after the Federal Communications Commission’s Fairness Doctrine of 1967. This doctrine required that cigarette commercials, which aired on television and radio, be balanced with time for antismoking messages (Hamilton, 1972; Simonich, 1991). The antismoking ads that aired on television and radio during the Fairness Doctrine period were found to reduce smoking in the United States (Warner, 1977, 1979). During the 1980s, antismoking campaigns began to focus less on long-term health consequences of smoking and more on shorter term psychosocial outcomes such as physical appearance and peer pressure to smoke (Farrelly, Niederdeppe, & Yarsevich, 2003). Subsequent antismoking campaigns that aired in the late 1990s and early 2000s, particularly the Florida TRUTH and Legacy’s national “truth” campaigns, leveraged tobacco industry documents released under the Master Settlement Agreement of 1998 to portray the manipulative marketing practices of tobacco companies. These well-funded campaigns also ushered in new evaluation research that demonstrated the effectiveness of these types of campaigns (Farrelly et al., 2002; Sly, Heald, & Ray, 2001).
More recently, state-level mass media campaigns in the United States focused on adult smoking cessation have been shown to increase quit attempts and intentions to quit among U.S. smokers (Davis, Farrelly, Duke, Kelly, & Willett, 2012; Farrelly et al., 2012; Nonnemaker et al., 2014; Vallone, Duke, Cullen, McCausland, & Allen, 2011). Similar impact has been demonstrated for cessation-focused campaigns in international settings such as Great Britain (Sims et al., 2014) and Australia (Donovan, Boulter, Borland, Jalleh, & Carter, 2003; Wakefield, Spittal, Yong, Durkin, & Borland, 2011), among others. While several of these studies address a general lack of control groups by using natural experiment designs that exploit geographic and temporal variation in media delivery (e.g., Farrelly et al., 2012; Wakefield et al., 2011), much of this evidence is based on state- or regional-level assessments (Durkin, Brennan, & Wakefield, 2012; McAfee, Davis, Alexander, Pechacek, & Bunnell, 2013; National Cancer Institute, 2008).
In 2012, the Centers for Disease Control and Prevention (CDC) implemented Tips From Former Smokers (Tips), the first federally funded adult smoking cessation campaign in the United States. The campaign was undertaken as part of a broad initiative to stimulate further declines in smoking among U.S. adults (Koh & Sebelius, 2012; McAfee et al., 2013). The campaign initially ran for 12 weeks in early 2012 and consisted of television advertisements on national cable networks and on select local networks in the United States. The television campaign was also supported by complementary advertising on other media outlets, including radio, online, print, and billboards. Most Tips campaign advertisements featured graphic, emotional messages with former smokers telling their true stories of suffering from smoking-related diseases. While based on evidence from previous campaigns that used graphic and emotional messages, the Tips message strategy differs from previous efforts in that it focuses almost exclusively on people living with smoking-related illnesses. Rather than highlighting end-stage consequences (death), the campaign emphasizes the pain, suffering, and debilitation associated with living with smoking-related illnesses over long periods of time. All Tips television ads can be viewed at the campaign’s website (CDC, 2016).
The inaugural Tips campaign was associated with an estimated 1.6 million quit attempts and at least 100,000 permanent quits among adult cigarette smokers in the United States (McAfee et al., 2013). The campaign was also associated with increased knowledge of the health conditions highlighted in Tips ads, motivation to quit, and smoking-related concerns about health (Duke et al., 2015), as well as increases in nationwide calls to the 1–800-QUIT-NOW quit line number (CDC, 2012; Davis et al., 2015). More recent studies have demonstrated that the 2013 and 2014 Tips campaigns were also associated with increased quit attempts and intentions to quit (McAfee et al., 2015; Neff et al., 2016) and increased knowledge of tobacco-related health risks (Huang et al., 2015). Additional evaluations of the 2015 campaign are ongoing.
Although dose–response relationships between antismoking media campaigns and cessation behaviors have been demonstrated at the state level in the United States (Farrelly et al., 2012; Nonnemaker et al., 2014) and in international settings (Wakefield et al., 2011), these relationships have not yet been established in the context of a nationwide federally funded campaign in the United States. The Tips campaign provides the first opportunity to do so with robust data on a nationwide cigarette cessation campaign implemented over multiple years in the United States. In this study, we expand the existing evidence base by examining the dose–response impact of the Tips campaign on cessation behaviors among adult cigarette smokers over a 4-year period from 2012 through 2015. We used data from a multiwave, nationally representative survey of U.S. smokers to measure the association between varied market-level doses of Tips campaign advertising and the outcomes of quit attempts and intention to quit smoking. In addition, we examine how the estimated dose–response effects of the U.S. Tips campaign compare to those demonstrated in previous studies of similar campaigns in other geographic settings.
Method
Data Source
The sample was obtained from KnowledgePanel (KP), a probability-based online panel of U.S. adults maintained by GfK Custom Research. Respondents from KP are initially recruited from a probability sample of postal addresses, covering approximately 95% of U.S. households, including those that use only mobile phones and those without Internet access. KP participants are initially invited to enroll via a series of mailings and telephone follow-up calls to nonresponders with listed telephone numbers that match the sampled mailing address. Households that do not have Internet access and wish to enroll are provided laptops with Internet service. KP recruitment procedures are described in more detail elsewhere (Chang & Krosnick, 2009; Yeager et al., 2011). Across all survey waves, approximately 92% of invited eligible respondents consented to participate, and among those, 62% completed the survey yielding an average within-panel response rate of 57%.
Participants were sampled from the existing KP using invitation e-mails containing a link to the online survey. Respondents who clicked this link were routed to an online screening questionnaire to determine eligibility. Those qualifying as current smokers or recent quitters were eligible to participate. Smokers were defined as adults aged 18 or older who had smoked at least 100 cigarettes in their lifetime and currently smoked every day or some days at the time of the survey. Recent quitters were defined at each survey wave as adults who quit smoking in the past 3 months. The inclusion of current smokers and recent quitters allows us to account for total quit attempts made in the past 3 months.
The survey was conducted in seven waves from 2012 through 2015. The first survey wave serves as an overall campaign baseline, collected before the Tips campaign when no other comparable national media campaigns were running. Additional survey waves were fielded either during or immediately after each campaign to measure recent quit attempts and other relevant outcomes. Table 1 summarizes the survey dates relative to campaign air dates during this period. Each wave of survey data was weighted to reflect national distributions of age, sex, race/ethnicity, and education among cigarette smokers aged 18 or older from the 2010–2011 Tobacco Use Supplement of the U.S. Census Bureau’s Current Population Survey (U.S. Department of Commerce, Census Bureau, 2012). The survey instrument, sample recruitment, and data collection procedures were reviewed and approved by the sanctioned institutional review board of RTI International.
Table 1.
Survey Data Collection, Campaign Air Dates, and Sample Sizes, 2012–2015.
| Survey wave/campaign | Observations | % of total sample | Description | Dates |
|---|---|---|---|---|
| Wave 1 survey | 4,028 | 17.5 | 2012 Tips baseline survey | February 21-March 18, 2012 |
| 2012 Tips campaign | — | — | Inaugural Tips campaign | March 19-June 10, 2012 |
| Wave 2 survey | 2,940 | 12.8 | 2012 Tips postcampaign survey | June 11-July 5, 2012 |
| 2013 Tips campaign | — | — | 2013 Tips campaign | March 4-June 17, 2013 |
| Wave 3 survey | 4,189 | 18.2 | 2013 Tips postcampaign survey | July 8-October 1, 2013 |
| 2014 Tips campaign (Phase 1) | — | — | Phase 1 of 2014 Tips campaign | February 3-April 6, 2014 |
| Wave 4 survey | 3,760 | 16.4 | 2014 Tips Phase 1 postcampaign survey | April 7-July 6, 2014 |
| 2014 Tips campaign (Phase 2) | - | - | Phase 2 of 2014 Tips campaign | July 7-September 7, 2014 |
| Wave 5 survey | 2,960 | 12.9 | 2014 Tips Phase 2 postcampaign survey | September 8-November 17, 2014 |
| 2015 Tips campaign | — | — | 2015 Tips campaign | March 30-August 16, 2015 |
| Wave 6 survey | 2,329 | 10.1 | 2015 Tips during campaign survey | April 1-June 10, 2015 |
| Wave 7 survey | 2,759 | 12.0 | 2015 Tips postcampaign survey | September 17-November 30, 2015 |
| Total observations | 22,965 | 100.0 | — | — |
Note. Tips = Tips From Former Smokers. Number of observations reflects total observations in the analytic sample, representing 8,209 unique individuals. Among unique individuals, 5,454 participated in two or more survey waves.
Outcome Variables
The primary outcome was defined with an indicator variable for the incidence of a quit attempt lasting 1 day or longer in the past 3 months. Nonsmokers who reported recently quitting smoking in the past 3 months were also included in the analytic sample and defined as having made a quit attempt. Intention to quit smoking was measured with an indicator variable for intention to quit smoking in the next 30 days. This measure was defined for current smokers only.
Independent Variables
Tips Campaign Gross Rating Points.
The independent variable in this study was cumulative weekly media market–level gross rating points (GRPs) for Tips television advertisements during the 13-week quarter before the respondents’ survey. GRPs measure the relative “dose” of advertising delivered to a given audience in a given media market and time period. GRPs are defined as the product of the percentage of the audience that is exposed (i.e., audience reach) and the frequency with which that exposure occurs (i.e., the number of times ads are aired). For example, if 80% of a media market’s television audience is exposed to Tips ads two times in a week, the television GRP for that market in that week would equal 160 (80 × 2). GRPs are based on Nielsen television ratings data for programs on which Tips ads aired and are calculated for each of the 210 designated market areas (DMAs) in the United States. DMAs are standard geographic units made up of U.S. counties that are grouped together within television market viewing areas. Because GRPs represent average media deliveries for a given market, they reflect a respondent’s potential exposure. Actual exposure levels can vary based on individual television viewing habits. The GRP data were merged to the survey data based on county identifiers that allow DMAs to be matched to survey respondents. Although the Tips campaign used other media channels to deliver its messages, television was the primary driver of ad exposure, representing approximately two thirds of the total campaign ad buy from 2012 to 2015.
Covariates.
We measured a number of covariates commonly used in similar studies (Farrelly et al., 2012; McAfee et al., 2013; Neff et al., 2016; Wakefield et al., 2011), including age, sex, race/ethnicity, education, annual household income, presence of children younger than age 18 in the household, and presence of other cigarette smokers in the household. We also included a control variable for prior diagnosis of a chronic (nonmental) health condition based on prior research indicating that diagnoses of some chronic diseases increase the odds of quitting smoking (Gulliford, 2001; Salive et al., 1992; Wilkes & Evans, 1999). Individuals who indicated prior diagnosis of a range of chronic diseases such as cancer, diabetes, high blood pressure, heart attack, high cholesterol, HIV/AIDS, asthma, arthritis, and kidney disease, among others, were defined as having a chronic (nonmental) health condition. Similarly, an additional covariate for previous diagnosis of a mental health condition was included based on previous studies indicating that smokers with mental illnesses are more receptive to antismoking advertising (Davis et al., 2016) yet are less likely to succeed in cessation attempts (Morris, Giese, Dickinson, & Johnson-Nagel, 2006). Respondents who indicated previous diagnoses of depression, anxiety disorder, general mental health conditions, attention deficit hyperactivity disorder or attention deficit disorder were defined as having a mental health condition.
We also measured the number of tobacco-related surveys taken in the past year to control for the possibility of panel conditioning among longer tenured panelists. We also controlled for a number of media market characteristics, including the total number of television households, the percentage of television households that are Black, and the percentage of television households that are Hispanic. In addition, we controlled for DMA-level adult cigarette smoking prevalence in 2012, which was derived by aggregating published data (Dwyer-Lindgren et al., 2014) on county-level estimates of smoking prevalence to the DMA level, weighted by county population. To account for state differences in cigarette taxes, yearly state cigarette excise taxes from 2012 to 2015 were also measured. We further accounted for any time-invariant fixed differences in outcomes across states by including state-specific indicator variables (i.e., state fixed effects). To control for secular trends in each outcome over time, we included a quarterly linear time trend variable.
Statistical Analysis
Multivariate logistic regressions were used to estimate the odds of each outcome as a function of past-quarter Tips campaign GRPs, with standard two-sided statistical tests using the .05 level threshold to determine statistical significance. Odds ratios were computed per unit increase of 1,000 GRPs per quarter in each media market. This scaling increment aligns with CDC’s (2014) best practices guidelines, which recommends quarterly media buys of between 800 and 1,200 GRPs for antismoking television campaigns. The observed quarterly GRP delivery per market across all waves of our data averaged 734 and ranged from 249 to 3,122 during periods when the campaign was on air. All models also included the covariates described previously. Because the data were collected from an established, ongoing panel of U.S. adults, some participants appear in multiple survey waves. We therefore clustered all models on unique individual case identifiers to account for within-person correlation of the data.
Because ever-increasing levels of paid media likely do not generate perpetual linear increases in quit attempts, we used a nonlinear specification of the GRP variable (square root) to capture asymptotic diminishing returns over the range of observed GRPs in our data. We also considered a simpler linear form for GRPs as a base model for comparison purposes. Specification tests (Linktest in Stata 13.0; StataCorp, 2013) and postestimation comparisons of model fit statistics using Bayesian information criterion (Cohen, Cohen, West, & Aiken, 2003) favored the square root specification of GRPs. This result was expected, given that a constant linear relationship between GRPs and cessation behavior is unlikely and that there is no prior evidence of negative effects of similar campaigns on quit attempts.
For interpretation purposes, we plotted the predicted probabilities of making a quit attempt across the observed range of GRP values in our data. These predictions were derived from the nonlinear model described above where GRPs are allowed to vary across the observed range in our data with all covariates held constant. Although our model fit tests favored the nonlinear function, similar studies of other campaigns have used linear specifications of GRPs in other state/regional or international settings (Farrelly et al., 2012; Wakefield et al., 2011). Thus, to facilitate direct comparisons of our results to these previous studies, we also describe results from the simpler linear specification. To further test how the effects of CDC-recommended GRP levels (CDC, 2014) compare to lower GRP levels, we estimated additional versions of the linear model that included dichotomous indicator variables for incremental categories of exposure including 0 to 199 GRPs (reference group), 200 to 399 GRPs, 400 to 599 GRPs, 600 to 799 GRPs, and 800 or more GRPs where the latter category represents the minimum recommended GRP level.
Although this study was not explicitly powered to detect campaign effects among vulnerable subgroups, we estimated exploratory regression models to test for interactions between Tips campaign GRPs and vulnerable subpopulations of interest that may have tobacco-related disparities including populations by race/ethnicity, education, and presence of a mental health condition (McAfee et al., 2013; McAfee et al., 2015; Neff et al., 2016). Last, we examined stratified models by campaign year and models with interactions between GRPs and campaign year to explore the durability of campaign effects over time.
Results
Sample Characteristics
The unweighted pooled sample consisted of 22,189 observations on current cigarette smokers and 776 observations on recent quitters: 17,246 non-Hispanic Whites (75.1%), 2,082 non-Hispanic Blacks (9.1%), 2,352 Hispanics (10.2%), and 1,285 of other races (5.6%). Across all waves of data in our panel sample, there were 8,209 unique individuals, of which 5,454 participated in more than one survey. The unweighted and weighted distributions of age, sex, race/ethnicity, and educational attainment are summarized in Table 2.
Table 2.
Sociodemographic Characteristics of Current Cigarette Smokers and Recent Quitters (n = 22,965).
| Characteristic | Observations | Unweighted (%) | Weighted (%) |
|---|---|---|---|
| Age (years) | |||
| 18–24 | 1,388 | 6.0 | 8.9 |
| 25–34 | 3,417 | 14.9 | 22.9 |
| 35–54 | 8,815 | 38.4 | 38.6 |
| ≥55 | 9,345 | 40.7 | 29.6 |
| Sex | |||
| Female | 13,705 | 59.7 | 49.1 |
| Male | 9,260 | 40.3 | 50.9 |
| Race/ethnicity | |||
| White, non-Hispanic | 17,246 | 75.1 | 68.1 |
| Black, non-Hispanic | 2,082 | 9.1 | 13.4 |
| Hispanic | 2,352 | 10.2 | 12.1 |
| Other, non-Hispanic | 1,285 | 5.6 | 6.3 |
| Education | |||
| <High school diploma | 1,777 | 7.7 | 15.3 |
| High school diploma | 5,771 | 25.1 | 40.3 |
| Some college | 10,491 | 45.7 | 31.8 |
| ≥College graduate | 4,926 | 21.5 | 12.7 |
| Annual household income ($) | |||
| <20,000 | 5,609 | 24.4 | 26.8 |
| 20,000–49,999 | 8,249 | 35.9 | 33.8 |
| 50,000–99,999 | 6,836 | 29.8 | 29.6 |
| ≥100,000 | 2,271 | 9.9 | 9.8 |
| Tobacco-related surveys taken in past year | |||
| Mean number | 22,808 | 2.56 | 2.58 |
| Children younger than age 18 in the household | |||
| 1 or more | 6,905 | 30.1 | 36.3 |
| Has a chronic condition, nonmental health-related | |||
| Yes | 13,622 | 59.3 | 53.5 |
| Has a mental health condition | |||
| Yes | 6,761 | 29.4 | 28.5 |
| Another cigarette smoker in the household | |||
| Yes | 9,591 | 41.8 | 42.9 |
Note. Sample distributions include current cigarette smokers (n = 22,189) and recent quitters (n = 776). Sample sizes reflect total observations in the analytic sample, representing 8,209 unique individuals. Smokers are defined as adults aged 18 or older who had smoked at least 100 cigarettes in their lifetime and currently smoked every day or some days. Recent quitters are defined as adults who quit smoking in the past 3 months. Data are weighted to the U.S. general population of adult smokers using the 2010–2011 Tobacco Use Supplement of the Census Bureau’s Current Population Survey.
Association Between Tips GRPs, Quit Attempts, and Intentions to Quit
Tips campaign GRPs at the media market level, measured in the curvilinear form, were associated with increased odds of making a quit attempt in the past 3 months (adjusted odds ratio [AOR] = 1.23; 95% confidence interval [CI; 1.11, 1.36]; Table 3). Among current smokers, past-quarter campaign GRPs were also associated with increased intentions to quit in the next 30 days (AOR = 1.17; 95% CI [1.02, 1.36]). Figure 1 shows the probability of making a quit attempt in the past 3 months at varying levels of GRPs based on postestimation predicted values from the nonlinear multivariate model. We estimate that in absence of the campaign (i.e., 0 GRPs), the estimated probability of making a quit attempt in the past 3 months was 33.3%. At the midpoint of CDC’s best practices recommendation for quarterly campaign dose (1,000 GRPs), the probability of a quit attempt was estimated at 37.6%, a 4.3% absolute increase. Further increases in GRPs yielded additional positive, but diminishing, effects consistent with the hypothesized curvilinear relationship for diminishing returns. Doubling the CDC-recommended dose from 1,000 to 2,000 GRPs increases the predicted probability of a quit attempt to 39.5%, an additional increase of 1.9%. Further increasing past-quarter GRPs to 3,000, the near maximum observed quarterly GRP in our data, increases the predicted probability of a quit attempt to 40.9%, a smaller increase of 1.4%. Similar dose–response patterns were observed for intention to quit smoking in the next 30 days (data not shown).
Table 3.
Odds Ratios [95% Confidence Interval] (p) From Logistic Regressions of Association Between Past-Quarter Tips GRPs and Quit Attempts and 30-Day Intentions to Quit.
| Independent variable | Quit attempt, past 3 months | Intends to quit, next 30 days |
|---|---|---|
| Curvilinear past | 1.23 [1.11, 1.36] | 1.17 [1.02, 1.36] |
| quarter Tips television | (<.001) | (.030) |
| GRPs (in 1,000s) | ||
| Model observations | 22,965 | 22,271 |
Note. Tips = Tips From Former Smokers; GRP = gross rating point. Boldface indicates statistical significance (p < .05). Curvilinear GRPs are measured as square root of past quarter GRPs. Quit attempt model estimated among current smokers and recent quitters (n = 22,965 observations on 8,209 unique individuals). Intention to quit model estimated among current smokers only (n = 22,271). All models control for age, sex, race/ethnicity, education, annual household income, tobacco surveys taken in the past year, presence of children in the household, presence of a chronic (nonmental) health condition, presence of a mental health condition, presence of another smoker in the household, market-level smoking prevalence, market-level total television households, percentage of market-level television households that are Black, percentage of market-level television households that are Hispanic, state cigarette excise taxes (2012), state fixed effects, and a linear time trend.
Figure 1.
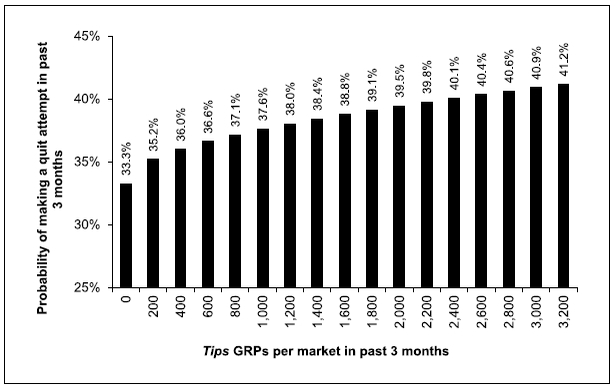
Predicted probabilities of making a quit attempt in the past 3 months as a function of market-level past-quarter Tips campaign GRPs.
Note. Tips = Tips From Former Smokers; GRP = gross rating point.
We found no statistically significant interactions between GRPs and membership in racial/ethnic subgroups (White, non-Hispanic; Black, non-Hispanic; and Hispanic), education subgroups (less than high school, high school diploma only, some college, college graduate), or mental health subgroups (has mental health condition, does not have mental health condition). Separate models that included interactions between campaign year and GRPs showed no significant differences in campaign effects over time (results not shown). Interactions between GRPs and a linear trend for campaign year were positive but statistically non-significant for quit attempts (AOR = 1.11; 95% CI [0.98, 1.24]) and intention to quit in the next 30 days (AOR = 1.09; 95% CI [0.90, 1.31]).
When we refit our overall model using the linear form of GRPs, results remained statistically significant and were directionally similar to those derived from the nonlinear form described above. In the linear model, we found that an increase of 1,000 GRPs in a given quarter was associated with a 14% increased odds of making a quit attempt in the past 3 months (AOR = 1.14; 95% CI [1.05, 1.23]) and a 12% increased odds of intending to quit smoking in the next 30 days (AOR = 1.12; 95% CI [1.00, 1.25]; data not shown). When we reestimated the linear model with indicators for incremental categories of GRPs, we found that quarterly GRPs of 800 or more generated the largest increase in the odds of a quit attempt (AOR = 1.27; 95% CI [1.13, 1.42]). Quarterly GRP doses between 600 and 799 were also significantly associated with increased quit attempts but at a lower magnitude (AOR = 1.19, 95% CI [1.01, 1.40]). Lesser GRP categories were not significantly associated with increased odds of a quit attempt (200–399 GRPs: AOR = 1.08, 95% CI [0.93, 1.25]; 400–599 GRPs: AOR = 1.13, 95% CI [0.97, 1.32]). Overall, respondents who received at least the minimum CDC-recommended dose of media (800 GRPs) were significantly more likely to make a quit attempt relative to those who received less than the minimum recommended dose (AOR = 1.18, 95% CI [1.07, 1.30]; data not shown).
Discussion
Given the continued existence of a large population of adult smokers in the United States (approximately 40 million as of 2014; Jamal et al., 2015), this study reinforces the public health importance of tobacco education media campaigns as one of the most effective ways to encourage cigarette smoking cessation. Our findings indicate that the Tips campaign has had significant impact on cessation-related outcomes over time from 2012 through 2015. These results are consistent with previous evaluations of individual Tips campaigns that have used alternate exogenous measures of campaign exposure to demonstrate campaign effects. These effects were previously demonstrated with basic pre–post cohort designs for the 2012 and 2014 campaigns (McAfee et al., 2013; Neff et al., 2016) and randomization of markets to heavier media buys for the 2013 campaign (McAfee et al., 2015). The current study demonstrates that from 2012 through 2015, individual-level quit attempts are also associated with varying doses of the Tips campaign measured by market-level GRPs.
The specific findings in our analysis have a number of practical implications for campaign planners and implementers. First, our results reinforce previous evidence that the use of negative health effects messages is an effective strategy for antismoking ads relative to other message types such as those that focus on secondhand smoke or how to quit smoking (Durkin et al., 2012; Farrelly et al., 2012; Nonnemaker et al., 2014; Wakefield, Loken, & Hornik, 2010). Second, the results suggest that CDC’s recommended doses of campaign media of between 800 and 1,200 quarterly GRPs (CDC, 2014) are sufficient to generate a significant overall impact on cessation-related outcomes. Third, our results suggest that the magnitude of the association between campaign GRPs and quit attempts does not differ significantly for any of the subgroup categories we examined. Hence, the Tips campaign may work equally well across a number of populations and does not underserve vulnerable subgroups of smokers. Fourth, the effects of the Tips campaign appear to be durable over time as our analysis indicated that there were no significant interactions between campaign GRPs and campaign year. Collectively, these results present Tips as a model anti-smoking campaign with effective message content, appropriate media buying strategies, message durability, and broad impact across multiple populations. State tobacco control programs and international health agencies that are implementing continued tobacco education campaigns should examine the Tips campaign for primary examples of appropriate message content and implementation strategies.
Prior to the current study, research on the dose–response effects of antismoking campaigns in the United States was limited to studies of state-based campaigns for adults (Farrelly et al., 2012; Nonnemaker et al., 2014), studies on the short-term incremental effects of additional dosing (McAfee et al., 2015), or studies of other populations, including youth (Farrelly, Davis, Haviland, Messeri, & Healton, 2005; Farrelly, Nonnemaker, Davis, & Hussin, 2009). Globally, other studies have used similar methods to estimate dose–response effects, particularly in Australia (Wakefield et al., 2011). Although some of these previous studies found a linear specification of campaign GRPs to best fit their data, their results are similar to ours when compared to our alternate linear model. For example, in Australia, Wakefield et al. (2011) found that an increase of 1,000 GRPs per quarter was associated with an 11% increase in the odds of a quit attempt in the past 3 months (compared with a 14% increased odds of a quit attempt under our linear specification). At the state level in the United States, Farrelly et al. (2012) estimated a 21% increased odds of a past-year quit attempt for each increase of 5,000 annual GRPs. When interpreted as part of this collective evidence base, our findings suggest that campaigns focused on strong negative health effects messages are effective in multiple domestic and global settings when delivered at doses consistent with CDC’s (2014) best practices guidelines for quarterly media buys. Hence, CDC’s best practice guidelines for antismoking media campaigns remain an important source of guidance for implementation of campaigns not only at the state level in the United States but also for other countries and international regions.
This study has some limitations. First, we relied on an ongoing online panel, which may limit generalizability if those who agree to participate in the panel are different from those who do not. However, the probability-based KP sample has been found to be comparable to random-digit-dial telephone surveys in terms of demographics and other key factors (Yeager et al., 2011). Second, some participants may have long-standing panel tenure, which could bias results if respondents are more knowledgeable of survey topics related to tobacco than the general population. However, this bias should be minimal in our analysis given our use of a control variable for the number of tobacco-related surveys taken in the past year. Furthermore, the mean number of tobacco surveys taken in the past year was only 2.6 and ranged from a minimum of 1 to a maximum of 6. Third, while GRPs are exogenous to the individual and not subject to selective attention bias, they are measured at the market level rather than the individual level. Hence, GRPs represent potential campaign exposure, not actual campaign exposure. This may limit the overall variability in the campaign exposure variable and lower statistical power to detect campaign effects. Fourth, our analysis captures the influence of the main television campaign only and does not address the impact of other media channels used by the campaign such as digital video, outdoor advertising (e.g., billboards), or radio. However, television was the primary driver of campaign messages, representing at least two thirds of the total campaign ad buy from 2012 to 2015. Given the relative size of the television ad buy, we do not believe the exclusion of other media components is a major source of bias. A fifth limitation of our analysis is that we assess the campaign’s influence on recent quit attempts only and not on longer term sustained quitting as our data do not have a suitable longitudinal structure for long-term follow-ups of all survey participants. Finally, variation in market-level Tips campaign GRP doses was multifactorial in origin. In 2013, additional GRPs were assigned at random to 67 markets (McAfee et al., 2015). Other market-level variation was due to peculiarities of the ad buys, timing of the campaign waves, and intentional complementary ad buys in local markets with high smoking prevalence. Although our analytic model controlled for market-level smoking rates to help mitigate this limitation, there may be other nonrandom sources of variation between the media buy and the outcome variables as noted above that are unaccounted for in our analysis.
Policy Implications
This study provides the first major long-term assessment of the dose–response effects of the Tips campaign on cessation-related outcomes over the entirety of its implementation from 2012 to 2015. Our findings support the continued use of graphic and/or emotional tobacco education campaigns to further reduce tobacco use in the United States. The consistency of these findings with other Tips evaluation studies (McAfee et al., 2013; McAfee et al., 2015; Neff et al., 2016) that have relied on other exogenous measures of campaign implementation provides additional strong evidence that the Tips campaign has had a sustained impact on cessation behavior and intentions to quit over time. Moreover, this study helps expand the evidence base on dose–response effects of cessation-focused campaigns to a national context as most previous evaluation evidence on dose–response in the United States is at the state (Davis et al., 2012; Farrelly et al., 2012; Nonnemaker et al., 2014) or regional (McAfee et al., 2015) levels. Having demonstrated the overall impact of the Tips campaign on a large national population of smokers, future research should further explore its public health impact and reach among vulnerable subpopulations with research designs created specifically for these purposes.
Acknowledgments
Funding
The authors disclosed receipt of the following financial support for the research, authorship, and/or publication of this article: This work was supported by the Centers for Disease Control and Prevention, U.S. Department of Health & Human Services.
Footnotes
Declaration of Conflicting Interests
The authors declared no potential conflicts of interest with respect to the research, authorship, and/or publication of this article.
References
- Centers for Disease Control and Prevention. (2012). Increases in quitline calls and smoking cessation website visitors during a national tobacco education campaign—March 19-June 10, 2012. Morbidity and Mortality Weekly Report, 61, 667–670. [PubMed] [Google Scholar]
- Centers for Disease Control and Prevention. (2014). Best practices for comprehensive tobacco control programs-2014. Atlanta, GA: Author. [Google Scholar]
- Centers for Disease Control and Prevention. (2016). Tips From Former Smokers campaign. Retrieved from www.cdc.gov/Tips.
- Chang L, & Krosnick JA (2009). National surveys via RDD telephone interviewing versus the Internet. Public Opinion Quarterly, 73, 641–678. doi: 10.1093/Poq/Nfp075 [DOI] [Google Scholar]
- Cohen J, Cohen P, West SG, & Aiken LS (2003). Applied multiple regression/correlation analysis for the behavioral sciences (3rd ed.). Hillsdale, NJ: Lawrence Erlbaum. [Google Scholar]
- Davis KC, Alexander RL Jr., Shafer P, Mann N, Malarcher A, & Zhang L (2015). The dose-response relationship between tobacco education advertising and calls to quitlines in the United States, March-June, 2012. Preventing Chronic Disease, 12, E191. doi: 10.5888/pcd12.150157 [DOI] [PMC free article] [PubMed] [Google Scholar]
- Davis KC, Duke J, Shafer P, Patel D, Rodes R, & Beistle D (2016). Perceived effectiveness of antismoking ads and association with quit attempts among smokers: Evidence from the Tips From Former Smokers campaign Health Communication. Advance online publication. doi: 10.1080/10410236.2016.1196413 [DOI] [PubMed] [Google Scholar]
- Davis KC, Farrelly MC, Duke J, Kelly L, & Willett J (2012). Antismoking media campaign and smoking cessation outcomes, New York State, 2003–2009. Preventing Chronic Disease, 9, E40. [PMC free article] [PubMed] [Google Scholar]
- Donovan RJ, Boulter J, Borland R, Jalleh G, & Carter O (2003). Continuous tracking of the Australian national tobacco campaign: Advertising effects on recall, recognition, cognitions, and behavior. Tobacco Control, 12(Suppl. 2), ii30–ii39. [DOI] [PMC free article] [PubMed] [Google Scholar]
- Duke JC, Davis KC, Alexander RL, MacMonegle AJ, Fraze JL, Rodes RM, & Beistle DM (2015). Impact of a U.S. antismoking national media campaign on beliefs, cognitions and quit intentions. Health Education Research, 30, 466–483. doi: 10.1093/her/cyv017 [DOI] [PMC free article] [PubMed] [Google Scholar]
- Durkin S, Brennan E, & Wakefield M (2012). Mass media campaigns to promote smoking cessation among adults: An integrative review. Tobacco Control, 21, 127–138. doi: 10.1136/tobaccocontrol-2011-050345 [DOI] [PubMed] [Google Scholar]
- Dwyer-Lindgren L, Mokdad AH, Srebotnjak T, Flaxman AD, Hansen GM, & Murray CJ (2014). Cigarette smoking prevalence in US counties: 1996–2012. Population Health Metrics, 12, 5. doi: 10.1186/1478-7954-12-5 [DOI] [PMC free article] [PubMed] [Google Scholar]
- Farrelly MC, Davis KC, Haviland ML, Messeri P, & Healton CG (2005). Evidence of a dose-response relationship between “truth” antismoking ads and youth smoking prevalence. American Journal of Public Health, 95, 425–431. doi: 10.2105/AJPH.2004.049692 [DOI] [PMC free article] [PubMed] [Google Scholar]
- Farrelly MC, Duke JC, Davis KC, Nonnemaker JM, Kamyab K, Willett JG, & Juster HR (2012). Promotion of smoking cessation with emotional and/or graphic antismoking advertising. American Journal of Preventive Medicine, 4, 475–482. doi: 10.1016/j.amepre.2012.07.023 [DOI] [PubMed] [Google Scholar]
- Farrelly MC, Healton CH, Davis KC, Messeri P, Hersey JC, & Haviland ML (2002). Getting to the truth: Evaluating national tobacco countermarketing campaigns. American Journal of Public Health, 92, 901–907. [DOI] [PMC free article] [PubMed] [Google Scholar]
- Farrelly MC, Niederdeppe J, & Yarsevich J (2003). Youth tobacco prevention mass media campaigns: Past, present, and future directions. Tobacco Control, 12(Suppl. 1), i35–i47. [DOI] [PMC free article] [PubMed] [Google Scholar]
- Farrelly MC, Nonnemaker J, Davis KC, & Hussin A (2009). The influence of the national truth campaign on smoking initiation. American Journal of Preventive Medicine, 36, 379–384. doi: 10.1016/j.amepre.2009.01.019 [DOI] [PubMed] [Google Scholar]
- Gulliford MC (2001). Low rates of detection and treatment of hypertension among current cigarette smokers. Journal of Human Hypertension, 15, 771–773. [DOI] [PubMed] [Google Scholar]
- Hamilton JL (1972). The demand for cigarettes: Advertising, health scare, and the cigarette advertising ban. Review of Economics and Statistics, 54, 401–411. [Google Scholar]
- Huang LL, Thrasher JF, Abad EN, Cummings KM, Bansal-Travers M, Brown A, & Nagelhout GE (2015). The U.S. national Tips From Former Smokers antismoking campaign: Promoting awareness of smoking-related risks, cessation resources, and cessation behaviors. Health Education & Behavior, 42, 480–486. doi: 10.1177/1090198114564503 [DOI] [PMC free article] [PubMed] [Google Scholar]
- Jamal A, Homa DM, O’Connor E, Babb SD, Caraballo RS, Singh T,… King BA (2015). Current cigarette smoking among adults: United States, 2005–2014. Morbidity and Mortality Weekly Report, 64, 1233–1240. doi: 10.15585/mmwr.mm6444a2 [DOI] [PubMed] [Google Scholar]
- Koh HK, & Sebelius KG (2012). Ending the tobacco epidemic. Journal of the American Medical Association, 308, 767–768. doi: 10.1001/jama.2012.9741 [DOI] [PubMed] [Google Scholar]
- McAfee T, Davis KC, Alexander RL Jr., Pechacek TF, & Bunnell R (2013). Effect of the first federally funded US antismoking national media campaign. The Lancet, 382, 2003–2011. doi: 10.1016/s0140-6736(13)61686-4 [DOI] [PubMed] [Google Scholar]
- McAfee T, Davis KC, Shafer P, Patel D, Alexander R, & Bunnell R (2015). Increasing the dose of television advertising in a national antismoking media campaign: Results from a randomised field trial Tobacco Control. Advance online publication. doi: 10.1136/tobaccocontrol-2015-052517 [DOI] [PMC free article] [PubMed] [Google Scholar]
- Morris CD, Giese JJ, Dickinson M, & Johnson-Nagel N (2006). Predictors of tobacco use among persons with mental illnesses in a statewide population. Psychiatric Services, 57, 1035–1038. [DOI] [PubMed] [Google Scholar]
- National Cancer Institute. (2008). The role of the media in promoting and reducing tobacco use: Tobacco control Monograph No. 19 Bethesda, MD: Author. [Google Scholar]
- Neff LJ, Patel D, Davis KC, Ridgeway W, Shafer P, & Cox S (2016). Evaluation of the National Tips From Former Smokers Campaign: The 2014 longitudinal cohort. Preventing Chronic Disease, 13, E42. doi: 10.5888/pcd13.150556 [DOI] [PMC free article] [PubMed] [Google Scholar]
- Nonnemaker JM, Allen JA, Davis KC, Kamyab K, Duke JC, & Farrelly MC (2014). The influence of antismoking television advertisements on cessation by race/ethnicity, socioeconomic status, and mental health status. PLoS One, 9, e102943. doi: 10.1371/journal.pone.0102943 [DOI] [PMC free article] [PubMed] [Google Scholar]
- Salive ME, Cornoni-Huntley J, LaCroix AZ, Ostfeid AM, Wallace RB, & Hennekens CH (1992). Predictors of smoking cessation and relapse in older adults. American Journal of Public Health, 82, 1268–1271. [DOI] [PMC free article] [PubMed] [Google Scholar]
- Simonich WL (1991). Government antismoking policies. New York, NY: Peter Lang. [Google Scholar]
- Sims M, Salway R, Langley T, Lewis S, McNeill A, Szatkowski L, & Gilmore AB (2014). Effectiveness of tobacco control television advertising in changing tobacco use in England: A population-based cross-sectional study. Addiction, 109, 986–994. doi: 10.1111/add.12501 [DOI] [PMC free article] [PubMed] [Google Scholar]
- Sly DF, Heald GR, & Ray S (2001). The Florida “truth” anti-tobacco media evaluation: Design, first-year results, and implications for planning future state media evaluations. Tobacco Control, 10, 9–15. [DOI] [PMC free article] [PubMed] [Google Scholar]
- StataCorp. (2013). Stata statistical software: Release 13 College Station, TX: Author. [Google Scholar]
- U.S. Department of Commerce, Census Bureau. (2012). National Cancer Institute-Sponsored Tobacco Use Supplement to the Current Population Survey (2010–11). Retrieved from https://www.census.gov/programs-surveys/cps/technical-documentation/complete.html [Google Scholar]
- U.S. Department of Health & Human Services. (2014). The health consequences of smoking: 50 years of progress: A report of the Surgeon General. Washington, DC: Author. [Google Scholar]
- Vallone DM, Duke JC, Cullen J, McCausland KL, & Allen JA (2011). Evaluation of EX: A national mass media smoking cessation campaign. American Journal of Public Health, 101, 302–309. doi: 10.2105/AJPH.2009.190454 [DOI] [PMC free article] [PubMed] [Google Scholar]
- Wakefield MA, Loken B, & Hornik RC (2010). Use of mass media campaigns to change health behaviour. The Lancet, 376, 1261–1271. [DOI] [PMC free article] [PubMed] [Google Scholar]
- Wakefield MA, Spittal MJ, Yong HH, Durkin SJ, & Borland R (2011). Effects of mass media campaign exposure intensity and durability on quit attempts in a population-based cohort study. Health Education Research, 26, 988–997. doi: 10.1093/her/cyr054 [DOI] [PMC free article] [PubMed] [Google Scholar]
- Warner KE (1977). The effects of the antismoking campaign on cigarette consumption. American Journal of Public Health, 67, 645–650. [DOI] [PMC free article] [PubMed] [Google Scholar]
- Warner KE (1979). Clearing the airwaves: The cigarette ad ban revisited. Policy Analysis, 5, 435–450. [Google Scholar]
- Wilkes S, & Evans A (1999). A cross-sectional study comparing the motivation for smoking cessation in apparently health patients who smoke to those who smoke and have ischemic heart disease, hypertension or diabetes. Family Practice, 16, 608–610. [DOI] [PubMed] [Google Scholar]
- Xu X, Bishop EE, Kennedy SM, Simpson SA, & Pechacek TF (2015). Annual healthcare spending attributable to cigarette smoking: An update. American Journal of Preventive Medicine, 48, 326–333. doi: 10.1016/j.amepre.2014.10.012 [DOI] [PMC free article] [PubMed] [Google Scholar]
- Yeager DS, Krosnick JA, Chang L, Javitz HS, Levendusky MS, Simpser A, & Wang R (2011). Comparing the accuracy of RDD telephone surveys and internet surveys conducted with probability and non-probability samples. Public Opinion Quarterly, 75, 709–747. doi: 10.1093/Poq/Nfr020 [DOI] [Google Scholar]