Abstract
Bone is comprised of separate inner endosteal and outer periosteal compartments, each with distinct contributions to bone physiology and each maintaining separate pools of cells due to physical separation by the bone cortex. While the skeletal stem cell giving rise to endosteal osteoblasts has been extensively studied, the identification of a periosteal stem cell has been elusive1–5. Here, we identify a periosteal stem cell (PSC) present in the long bones and calvarium of mice that displays clonal multipotency, self-renewal and sits at the apex of a differentiation hierarchy. Single cell and bulk transcriptional profiling show that PSCs display distinct transcriptional signatures in comparison with both other skeletal stem cells and mature mesenchymal cells. While other skeletal stem cells form bone via an initial cartilage template using the endochondral pathway4, PSCs form bone via a direct intramembranous route, providing a cellular basis for the divergence between intramembranous versus endochondral developmental pathways. However there is plasticity in this division, as PSCs acquire endochondral bone formation capacity in response to injury. Genetic blockade of the ability of PSCs to give rise to bone-forming osteoblasts results in selective impairments in cortical bone architecture and defects in fracture healing. A cell analogous to PSCs is present in the human periosteum, raising the possibility that PSCs are attractive targets for drug and cellular therapy for skeletal disorders. Moreover, the identification of PSCs provides evidence that bone contains multiple pools of stem cells, each with distinct physiologic functions.
Keywords: Stem cell, Bone, Periosteum, Osteoblasts
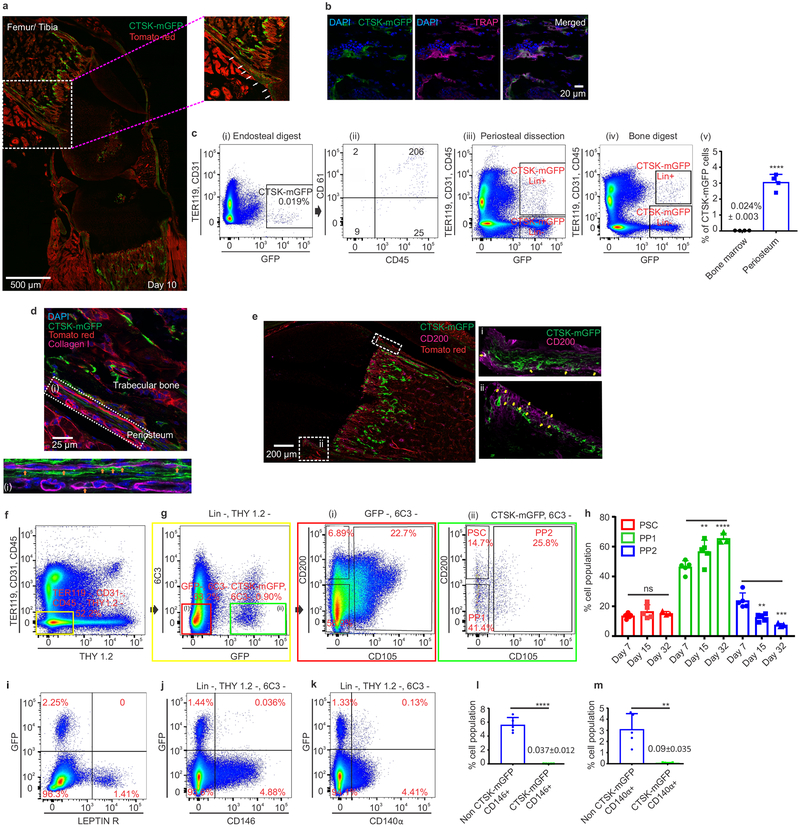
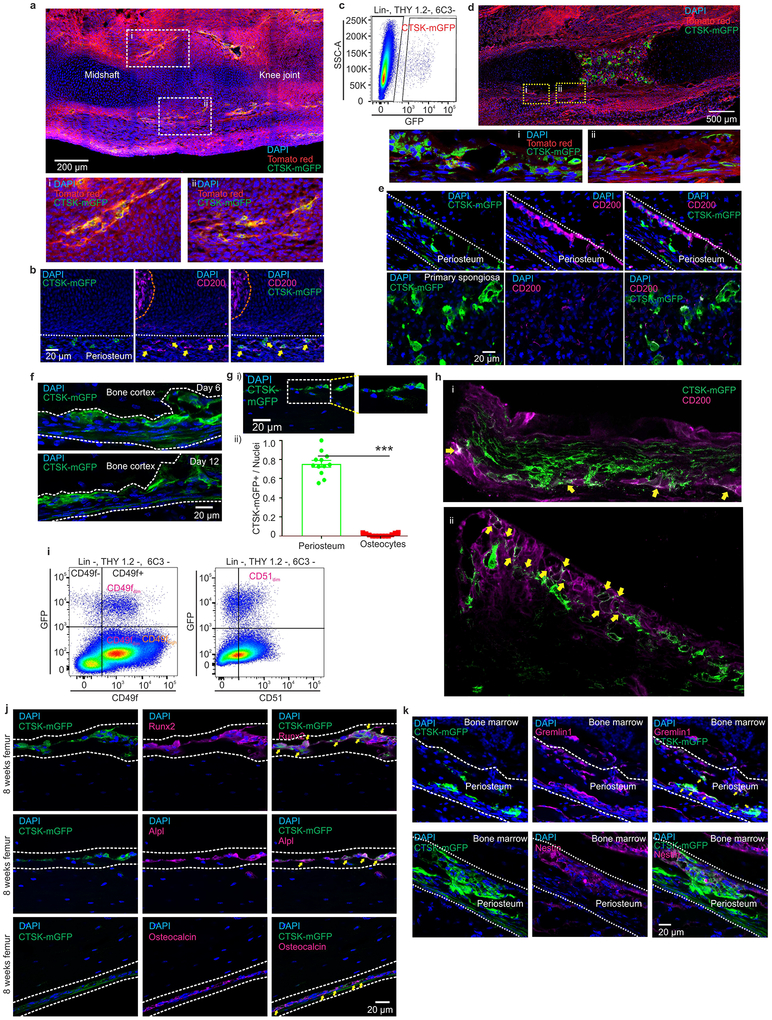
A major limitation to identifying periosteal stem cells has been the lack of genetic markers that discriminate periosteal versus endosteal mesenchyme. While studying the specificity of skeletal targeting cre strains, we observed that Cathepsin K-cre (Ctsk-cre) labels the periosteal mesenchyme. In Ctsk-cre; mTmG reporter mice6, where Ctsk-cre positive cells and their progeny (hereafter CTSK-mGFP cells) are mGFP+, labeling of the periosteal mesenchyme was observed as early as embryonic day 14.5 (Extended data 1a–e). At postnatal day 10, CTSK-mGFP cells were observed in the periosteal mesenchyme and the endosteal marrow compartment, though nearly all the endosteal cells were morphologically consistent with osteoclasts (Fig. 1a, Extended data 1f). Negligible number of osteocytes were CTSK-mGFP+ (Extended data 1g). Flow cytometry of endosteal cells and co-staining for TRAP confirmed that endosteal CTSK-mGFP cells were osteoclasts (Fig. 1b, c panel i-ii). Conversely, the majority of CTSK-mGFP cells in the periosteum were CD45−, TER119−, CD31− (hereafter Lin−) mesenchymal cells (Fig. 1c, panel iii). Periosteal CTSK-mGFP cells include periosteal osteoblasts as shown by expression of type I collagen, RUNX2, alkaline phosphatase (ALPL) and osteocalcin (Fig. 1d, Extended data 1j). Thus, within the mesenchymal compartment, Ctsk-cre selectively labels the periosteum7 (Fig. 1c, panel iv-v).
Figure 1: Cathepsin K-cre labels periosteal mesenchymal cells.
a, mGFP (green) signal in femur of Ctsk-cre; mTmG mice at postnatal day 10 (P10). Scale bar 500μm. Enlarged view of dotted white box. b, Endosteal CTSK-mGFP+ cells express the osteoclast marker TRAP (magenta). DAPI (blue) for nuclei.). a, b 5 independent experiments. c, Distribution of CTSK-mGFP cells in the endosteal digest (i, ii), periosteum (iii) and total bone digests (iv) by FACS. ****p=1.69×10⁻⁵ (v) (mean ± S.D; n=4; 2 tailed Student’s t-test). d-e, A subset of CTSK-mGFP (green) periosteal cells of the femur expresses type 1 Collagen (d, magenta; orange arrow, scale bar 25μm) and a subset expresses CD200 (e, magenta; yellow arrows, scale bar 200μm). DAPI (blue) for nuclei. Enlarged view of e, i-ii is provided in Extended data. 1h. 3 independent experiments. f-g, Flow cytometry of P7 mice to identify periosteal stem cells (PSC) and progenitor cells (PP1, PP2) in long bones. Color coded boxes (yellow, red, green) indicate parent/daughter gates. h, % of PSC, PP1 and PP2 populations over time in long bone digests. For PP1, **p = 0.0063 at day 15, ****p=0.0001 at day 32. PP2, **p = 0.0022 at day 15, ***p =0.0001 at day 32. One way ANOVA, Sidak’s multiple comparison test; mean ± S.D; n=5 for days 7 and 15, n=3 for day 32, representative of 3 independent experiments. i-k, Flow cytometry for LEPR (i), CD146 (j) and CD140α (k) versus CTSK-mGFP in long bones. 5 independent experiments. l-m, CTSK-mGFP cells display significantly fewer CD146+ (****p=0.0000029) and CD140α+ (**p= 0.0014) cells than non-CTSK mGFP cells (mean ± S.D; 3 independent experiments; 2-tailed Student’s t-test).
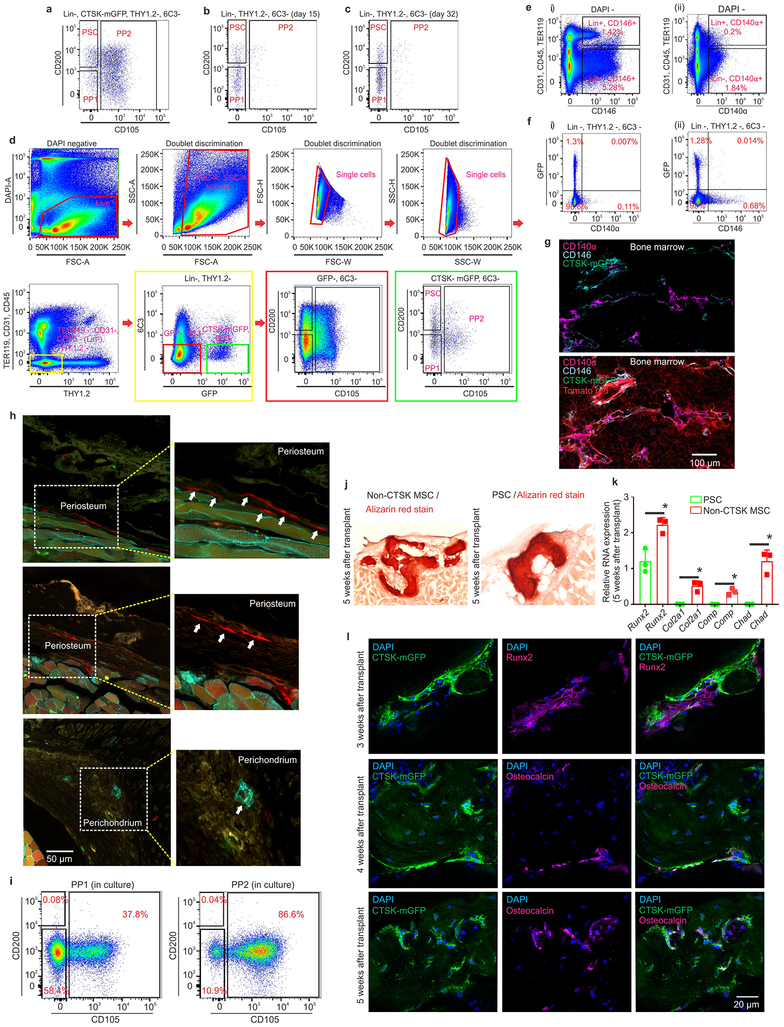
This labeling suggested that a periosteal stem cell exists within the mesenchymal CTSK-mGFP+ population (Fig. 1a–c). To test this, CTSK-mGFP mesenchymal cells were fractionated by multi-color flow cytometry (Fig. 1 f–g, i–k; Extended data 1i). Three populations were observed within the CTSK-mGFP+ cells lacking THY and 6C38, all of which were CD49fdim, CD51dim: periosteal mesenchymal stem cells (PSCs) (CD200+, CD105−), periosteal progenitor 1 (PP1) (CD200−, CD105−), and periosteal progenitor 2 (PP2) (CD105+, CD200variable) (Fig. 1g panel ii, 1h, Extended data 2a–c). Immunostaining confirmed the presence of CD200+ CTSK-mGFP cells in the periosteum and also identified subsets of CTSK-mGFP cells expressing Gremlin15 and Nestin1 (Fig. 1e, Extended data 1b, 1e, 1k). Consistent with the restriction of hematopoiesis to the endosteal compartment, CTSK-mGFP+ status is mutually exclusive with expression of LEPR, CD146, and CD140α, markers present in mesenchymal cells with the ability to support hematopoiesis2,3,9,10 (Fig. 1i–m, Extended data 2e–g). During embryonic development, periosteal CTSK-mGFP+, CD200+ cells consistent with PSCs was first observed at E14.5 concurrent with the onset of skeletal mineralization and were distinct from CD200+ cells present within the chondroepiphysis (Extended data 1a–e).
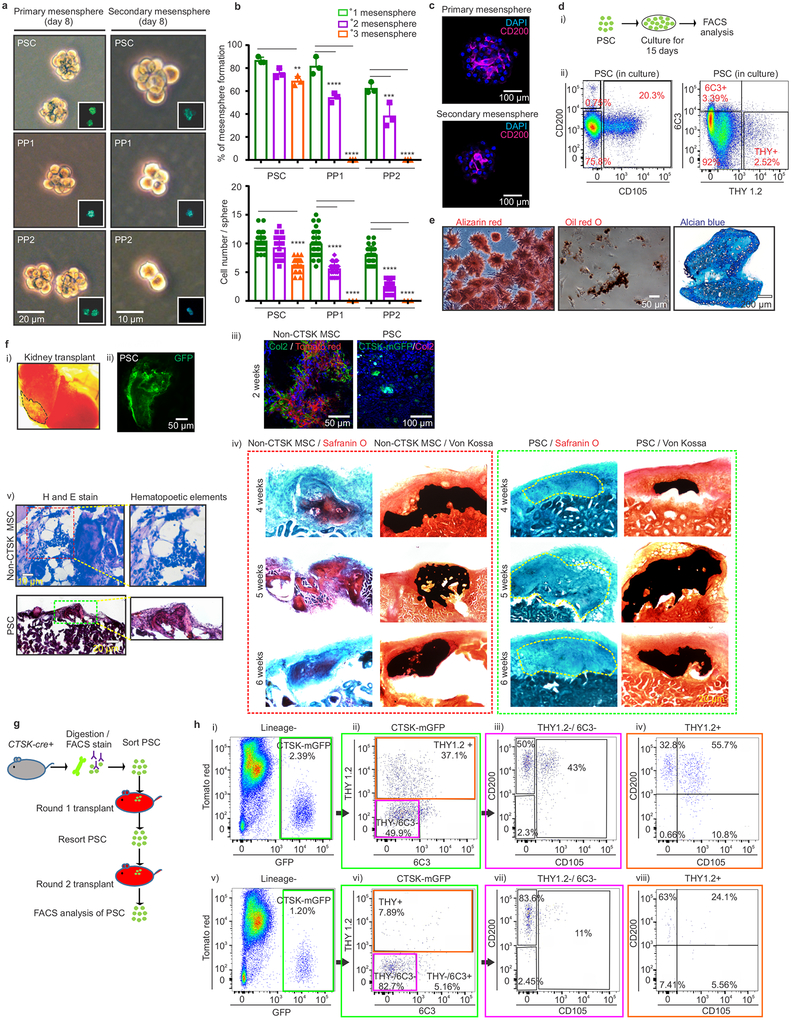
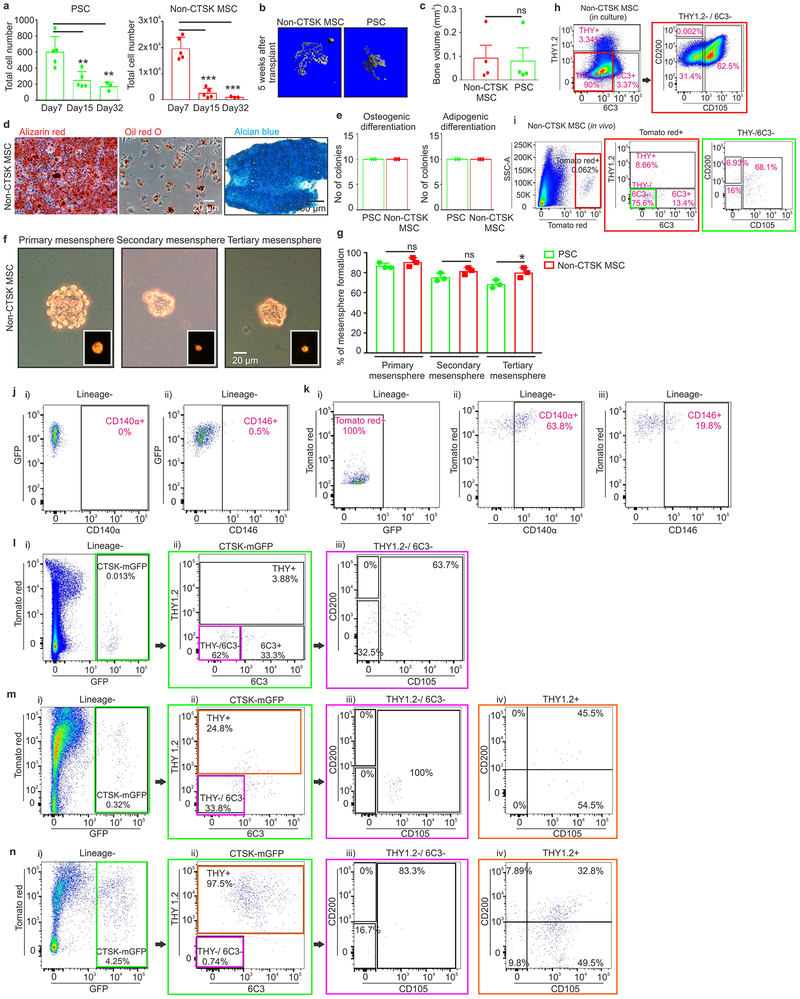
PSCs display the stem cell properties of clonal multipotency, self-renewal and the ability to give rise to the entire range of CTSK-mGFP+ cells. Serial mesensphere formation is an in vitro proxy for self-renewal1, and only PSCs possessed the capacity to form tertiary mesenspheres, retaining CD200 through this process (Fig. 2a–c). To determine which periosteal population sits at the apex of the CTSK-mGFP differentiation hierarchy, FACS isolated populations were cultured for 15 days, and subsequently reanalyzed by flow cytometry, where PSCs differentiated into PP1 and PP2 cells in addition to THY+ and 6C3+ cells (Fig. 2d). In contrast, PP1s or PP2s did not produce PSCs in culture (Extended data 2i). Additionally, PSCs demonstrated in vitro clonal multipotency for differentiation into mature osteoblasts and adipocytes (Fig. 2e). Similarly, a clonogenic periosteal population can be identified by pulse labeling in vivo (Extended data 2h). PSCs also possessed chondrocyte differentiation capacity. Together, PSCs are the most stem-like of the CTSK-mGFP populations in vitro.
Figure 2: Functional characterization of periosteal stem cells.
a, Brightfield images, primary (left; scale bar 20μm) and secondary (right; scale bar 10μm) mesenspheres derived from PSCs (top), PP1s (middle) and PP2s (bottom). GFP (green) in insert. 3 independent experiments. b, % of cells able to form spheres (top) and cell number/sphere (bottom) in PSCs, PP1s and PP2s. **p=0.0036 for % PSC tertiary mesenspheres, ****p=0.0001 for % PP1 secondary and tertiary mesenspheres, ***p= 0.0002 for % PP2 secondary, ****p= 0.0001 for % PP2 tertiary mesenspheres, (n=3 independent experiments). Dunnett’s multiple comparison test; mean ± S.D (top, bottom graphs) c, Immunostaining for CD200 (magenta) in primary (top) and secondary (bottom) PSC derived mesenspheres. DAPI (blue), scale bar 100μm. 3 independent experiments. d, Sorted PSCs cultured for 15 days and analyzed by flow (i, ii) 3 independent experiments. e, Single cell-derived PSC colonies were split for differentiation into osteoblasts (Alizarin red staining; left), adipocytes (Oil red O staining; middle; scale bar 50μm). Separately, chondrocyte differentiation potential was assayed (Alcian blue staining, right; scale bar 200μm). 3 independent experiments. f, Non-CTSK MSCs and CTSK-mGFP+ PSCs were transplanted into kidney capsule of secondary recipients (i, dotted black line). Donor origin of PSCs was confirmed with GFP retention (ii). Immunostaining for type 2 collagen (green in left box; magenta in right box) on 2 week non-CTSK MSC (red, left box) and PSC (green, right box)-derived organoids (iii). Safranin O (red) for cartilage and von Kossa (black) for mineralized bone on non-CTSK MSC (red box) and PSC (green box)-derived organoids 4 (top), 5 (middle) and 6 weeks (bottom) after transplantation (iv). Hematoxylin and eosin, non-CTSK MSC (top) and PSC (bottom)-derived organoids (v). 8 independent experiments. g, Schema of serial transplantation of PSCs into mouse mammary fat pad. h, FACS plots of PSC-derived cells after the first (i-iv) and second round of transplantation (v-viii). (Lineage- = Ter119−, CD45− and CD31−). Color coded boxes (green, magenta, orange) indicate parent/ daughter gates. 3 independent experiments.
In contrast to other skeletal MSCs that mediate endochondral ossification, PSCs form bone in vivo via an intramembranous pathway. PSCs and non-CTSK MSCs (Lin−, 6C3−, THY−, CD200+, CD105−, GFP−) were transplanted under the kidney capsule of WT secondary recipients (Fig. 2f, panel i-ii). Both non-CTSK MSCs and PSCs mediated de novo generation of bone organoids (Fig. 2f, panel iv). Consistent with the physiologic restriction of marrow recruitment to the endosteal compartment, non-CTSK MSCs underwent endochondral ossification with cartilage differentiation and recruitment of hematopoietic elements whereas PSCs mediated intramembranous bone formation without hematopoietic recruitment or cartilage formation11 (Fig. 2f, panels iii, v, Extended data 2j–l). Otherwise, non-CTSK MSCs displayed similar performance to PSCs in bone organoid, clonal multipotency and mesensphere assays (Extended data 3a–h). No interconversion between non-CTSK MSCs and PSCs could be observed post-transplant (Extended data 3i–k). Thus, bone contains discrete stem cell populations with differing functional specializations1,2,4,5,12, including a PSC population specialized for periosteal physiology.
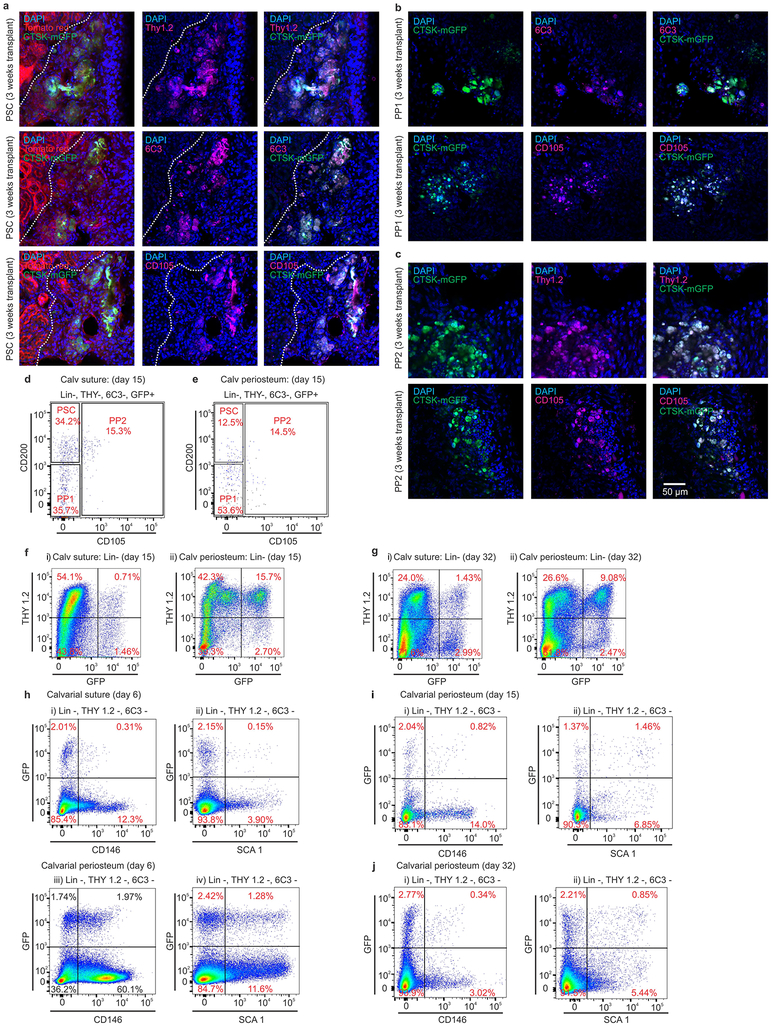
Additionally, PSCs sit at the apex of a differentiation hierarchy in vivo and are capable of self-renewal during serial transplantation assays1,9 CTSK-mGFP PSCs were transplanted into the mammary fat pad of female mTmG mice and analyzed over two successive rounds of transplantation (Fig. 2g). After the first round of transplantation, PSCs both self-renewed and gave rise to the entire spectrum of CTSK-mGFP cells observed in native periosteum (Fig. 2h, panels i-iv). Similar results were observed in a kidney capsule system (Extended data. 4a). PSCs from secondary hosts were re-isolated and transplanted into tertiary hosts where they again displayed intact self-renewal and differentiation capacity (Fig. 2h, panels v-viii). In contrast, CTSK-mGFP+ PP1 or PP2 cells did not revert to PSCs after transplantation and were unable to maintain THY−, 6C3− progenitor cells (Extended data 3l–n, 4b–c). Thus, PSCs retain both self-renewal and differentiation capacity through successive rounds of transplantation, indicating they sit at the apex of the CTSK-mGFP differentiation hierarchy.
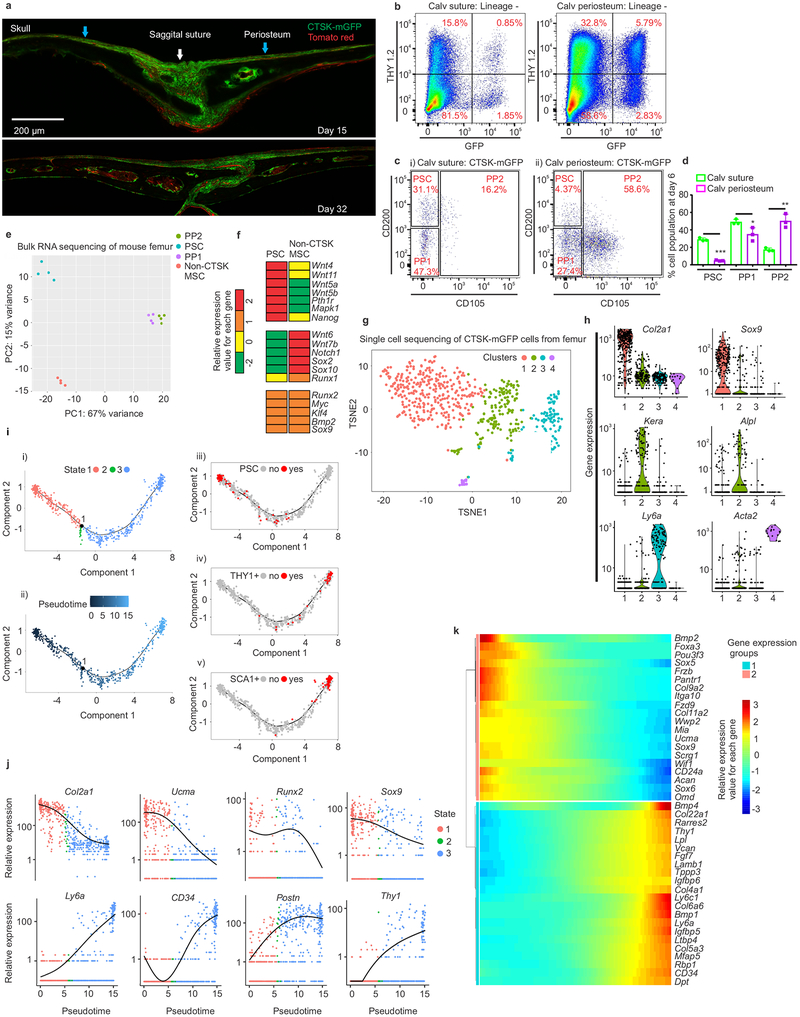
The specialization of PSCs for intramembranous bone formation was further examined at a well-known site of intramembranous bone formation, the calvarium. Consistent with observations that calvarial sutures contain progenitors that migrate out onto calvarial periosteum as they mature13,14, cells with a PSC immunophenotype exist predominantly in the sutures (Fig. 3a, 3ci, 3d; Extended data 4d–e). In contrast, CTSK-mGFP PP1 and PP2 cells, as well as THY+, CD146+, SCA1+ cells, were predominantly present in the calvarial periosteum outside of the sutures (Fig. 3b–d, Extended data 4f–j). Calvarial PSCs are functionally equivalent to long bone PSCs as seen by sitting at the apex of their differentiation hierarchy during in vitro and in vivo assays, tertiary mesensphere formation capacity, clonal multipotency and bone organoid formation capacity and gene expression (Extended data 5). The few non-CTSK MSC cells in the calvarium displayed low in vitro bone formation capacity (Extended data 5d–f). Thus, PSCs are present in the calvarial sutures, suggesting that PSCs orchestrate intramembranous ossification at multiple anatomic sites.
Figure 3: Periosteal stem cells in mouse calvarium and gene expressional analysis on mouse femoral periosteal cells.
a, CTSK-mGFP (green) cells in mouse calvarium at P15 (top) and P32 (bottom) (sagittal suture, white arrow; calvarial periosteum, blue arrow, scale bar 200μm). 3 independent experiments. b, THY expression in CTSK-mGFP cells from P6 suture (left) and calvarial periosteum (right).c, PSC, PP1 and PP2 in suture (i) and calvarial periosteum (ii) at P6. 10 independent experiments. d, Relative proportion of PSC, PP1and PP2 cell populations at day 6 in suture (green) and calvarial periosteum (purple). ***p = 2.7×10⁻⁵, *p=0.04, **p= 0.002 mean ± S.D; n=3 independent experiment, 5 animals pooled per group; 2-tailed Student’s t-test). e, Principal component analysis of RNA sequencing from FACS sorted PSC, PP1, PP2 and non-CTSK MSC populations from P6 mouse femurs. n=4 per group. f, Heatmap of gene expression in PSCs and non-CTSK MSCs. (g-k) 658 CTSK-mGFP+ mesenchymal cells isolated by FACS from P6 mouse femur and subjected to CEL-SEQ2. g, A two-dimensional representation (t-SNE) of global gene expression (Cluster 1= 276 cells, cluster 2=215 cells, cluster 3 = 145 cells, cluster 4=16 cells). h, Relative expression of Col2a1, Sox9, Kera, Alpl, Ly6a, Acta2 among the four clusters. Gene expression along y and clusters (1–4) along x-axes. i, Monocle analysis of CEL-SEQ2 data. Single cell trajectory obtained via unsupervised ordering of 658 CTSK-mGFP cells based on State (i) and Pseudotime (ii). Labelling of PSCs (iii), THY+ (iv) and SCA1+ (v) cells based on flow cytometry assessment of protein surface immunophenotype on the differentiation trajectory. j, Monocle analysis for relative gene expression versus pseudotime. k, Heatmap of differentially expressed genes across pseudotime.
Transcriptional analysis showed that PSCs from mouse femur were broadly different from both their PP1 and PP2 derivatives and other skeletal MSCs (Fig. 3e, Extended data 6a, 6g). Both PSCs and non-CTSK MSCs shared expression of genes associated with mesenchymal stem/progenitor cells including Runx2 and Sox9, alongside stemness associated genes such as Myc15 and Klf416, whereas PSCs expressed higher levels of Nanog and Wnt5a17 (Fig. 3f). Notably, PSCs displayed increased per cell bone formation capacity than PP1/2 cells after kidney capsule transplantation (Extended data 6b–d). Calvarial PSCs also displayed similar patterns of gene expression as those observed in femoral PSCs (Extended data 5g). In parallel, to empirically determine the populations present within the pool of femoral CTSK-mGFP+, Lin− cells, single cell RNA sequencing was performed using CEL-SEQ218. Mesenchymal CTSK-mGFP+ cells clustered into 4 groups: a group expressing progenitor/stem cell markers19 such as Sox9 and Col2a1, a group expressing osteoblast markers such as Bglap and Alpl, a group expressing Ly6a (Sca1) and a small group with high expression of Acta2 (Fig. 3g–h, Extended data 6e–f). Unsupervised construction of an inferred differentiation trajectory using Monocle20 empirically identified a population corresponding to flow cytometry defined PSCs (Fig. 3i, panel iii-v). Transcriptional markers of mesenchymal stem / progenitor cells were expressed in the early region of this differentiation trajectory containing PSCs (Fig. 3j–k). Thus, combined index sorting/single cell sequencing independently identifies a discrete PSC population similar to that identified by FACS, and PSCs display transcriptional signatures of mesenchymal stem cells and are distinct from other CTSK-mGFP+ populations.
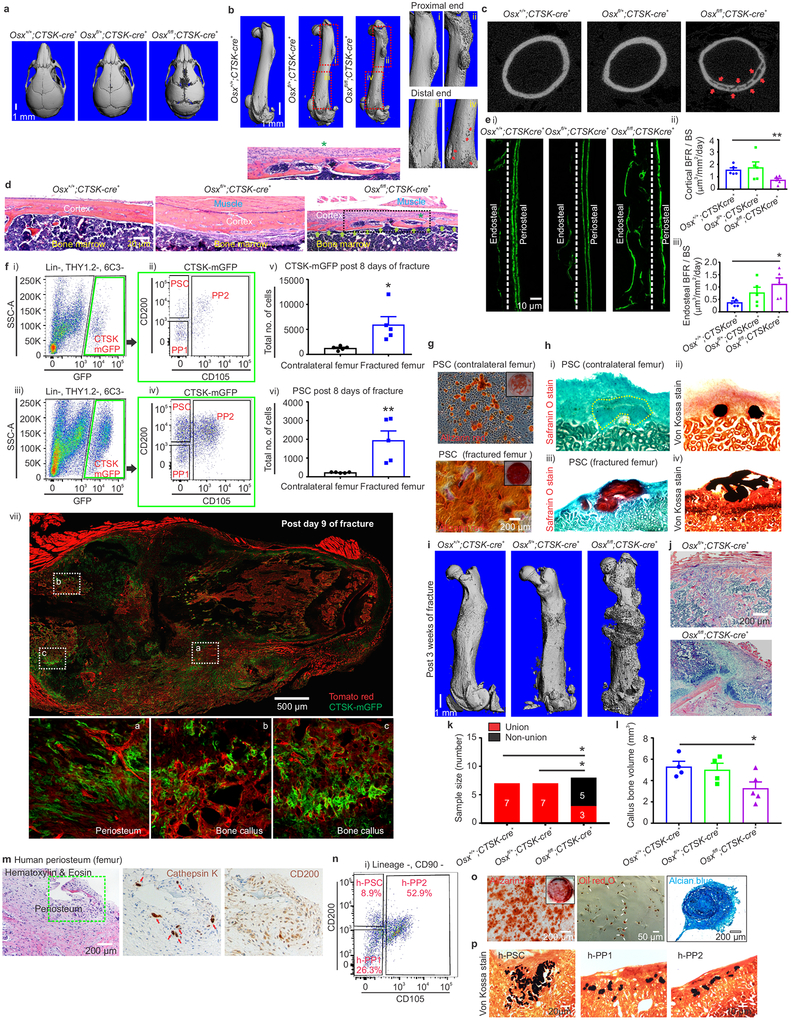
To evaluate the physiologic importance of PSC-derived osteoblasts to bone formation, the ability of PSCs to give rise to osteoblasts was blocked by conditionally deleting Osterix (Osx), a transcription factor essential for osteoblast differentiation21,22, using Ctsk-cre. Osxfl/fl; Ctsk-cre+ mice displayed hypomineralization of the calvarium, uneven periosteal surfaces, and extensive linear intra-cortical pores that gave a characteristic appearance of a double cortex (Fig. 4a–d, Extended data 7a). Endosteal trabecular bone mass was not significantly altered (Extended data 7d). Otherwise, bone morphology and growth plate architecture were intact in Osxfl/fl; Ctsk-cre+ mice aside from a slight reduction in long bone length (Extended data 7b–c). Bone formation rates were significantly reduced in the periosteum of Osxfl/fl; Ctsk-cre+ mice, with a compensatory increase in endosteal bone formation (Fig. 4e, Extended data 7e). TRAP staining showed no changes in osteoclast numbers23 (Extended data 7f–g). Consistent with histomorphometry results, the in vivo and in vitro osteogenic potential of both long bone and calvarial PSCs but not endosteal MSCs was reduced in Osxfl/fl; Ctsk-cre+ mice (Extended data 7h–j). Thus, PSC-derived osteoblasts are necessary for periosteal bone formation and the establishment of normal cortical architecture.
Figure 4: PSCs contribute to bone formation and fracture healing; human samples contain PSC-like cells.
a-b, μCT, skull (a) and femur (b; i-iv enlarged view), 4-week mice. Scale, 1mm. c, μCT, femur cortex. Cortical porosity, red arrows. d, H & E, mouse periosteum (*, insert). Scale, 20μm. n = 5 animals/group. e, Calcein labelling, mouse femur (i-iii), Scale, 10μm. (*p= 0.021; **p = 0.007, mean ± S.E.M, n=5 animals/group at 4 weeks old; 2-tailed Student’s t-test, 5 independent experiments). f, FACS in contralateral (i, ii) and fractured femurs (iii, iv). Green, parent/daughter gates.*p= 0.018, v; **p=0.009, vi in callus tissue 8-days post fracture (mean ± S.E.M; n=5; 2-tailed Student’s t-test). Ctsk-cre; mTmG mouse femurs 9-days post-fracture (vii). Enlarged views, white. CTSK-mGFP (green), mTomato (red), 3 independent experiments. g, Alizarin red, PSCs from fractured (bottom) or contralateral femur (top) (scale 200μm). 3 independent experiments. h, Safranin O (i, iii) and von-Kossa (ii, iv) 4 weeks after transplantation of PSCs from fractured (bottom) or contralateral femurs (top). 3 independent experiments. i, μCT, femur 3 weeks post fracture. n=8/group. j, H& E, fracture callus. Scale, 200μm. 3 independent experiments. k, Fracture non-union (Fisher’s exact test, *p = 0.025, n= 7, control and het n= 8, knockout). l, Callus bone volume. *p=0.042; mean ± S.E.M, n= 4, control and het; n=5, knockout, 2-tailed Student’s t-test). m, Immunohistochemistry, human femoral periosteum. H & E (left; scale bar 200μm), Cathepsin K (middle, red arrow), CD200 (right). High power insert (green). 4 independent experiments. n, FACS on human periosteum. n=10 experiments. o, Alizarin red (left, scale 200μm, low power insert), Oil red O (middle; white arrows; scale 50μm) and Alcian blue (right, scale 200μm) on cultured h-PSCs. n= 3. p, Von Kossa staining (black), bone organoids after h-PSC (left), h-PP1 (middle) and h-PP2 (right) xenograft. 3 independent experiments.
Consistent with prior observations that the periosteum is necessary for fracture repair24,25, PSC-derived osteoblasts expand in response to injury and are necessary for fracture healing. PSCs showed a greater expansion than non-CTSK MSCs in femurs 8 days after fracture (Fig. 4f, Extended data 7k–p, 8, 9a–c). PSCs isolated from the fracture site displayed enhanced osteoblast differentiation capacity on a per cell basis in vitro (Fig. 4g). Thus, fracture markedly increases both the numbers and the osteoblast differentiation capacity of PSCs.
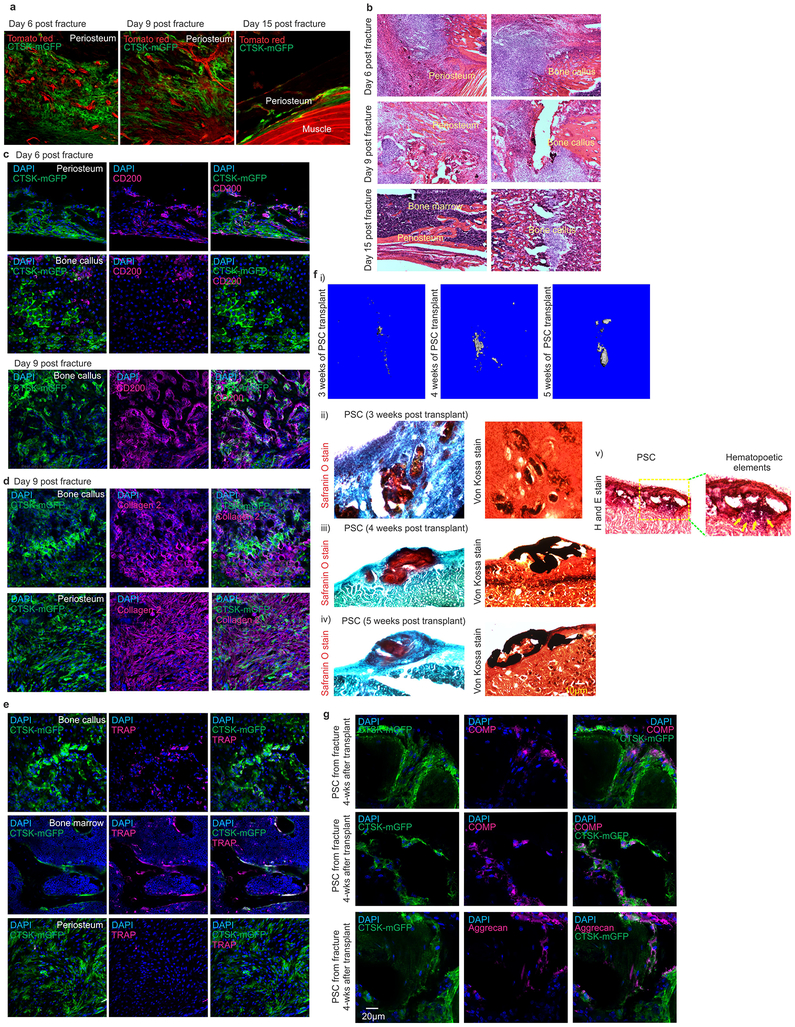
It is a longstanding apparent contraction that periosteum undergoes intramembranous bone formation at baseline while also being necessary for endochondral fracture repair. We examined if PSCs could explain this contraction by switching from a baseline intramembranous bone formation capacity to acquire endochondral bone formation capacity after fracture. While no CTSK-mGFP+ labeling of chondrocytes is observed at baseline, CTSK-mGFP+ cells contributed approximately half of the chondrocytes present in the fracture callus, (Extended data 8a insert c, 9d). PSCs isolated from the fracture callus mediated endochondral ossification after transplantation into the kidney capsule (Fig 4f vii, 4h, Extended data 9f–g). Thus, while there is a clear distinction between intramembranous competent PSCs and endochondral competent MSCs at baseline, injury can introduce plasticity or interconversion between these cell types. This offers an explanation for how the periosteum can contribute to the endochondral process of fracture repair despite being specialized for intramembranous formation at baseline.
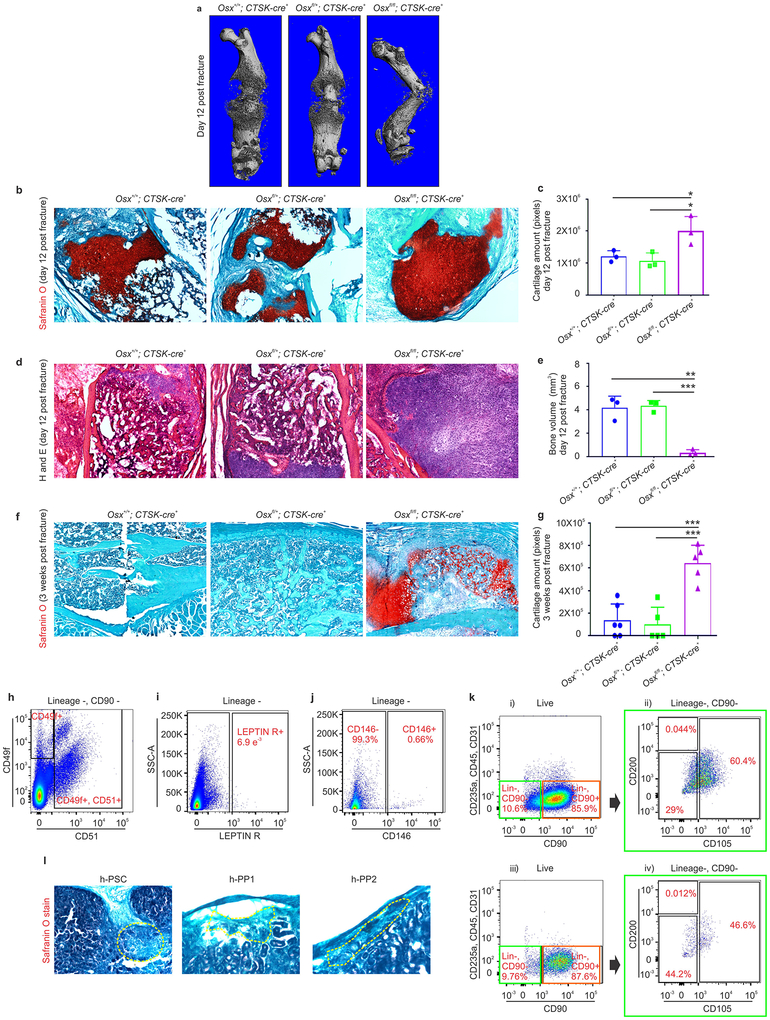
Next, the functional contribution of PSC-derived osteoblasts to fracture healing was examined in Osxfl/fl; Ctsk-cre+ mice, which displayed markedly impaired fracture healing with increased rates of fracture non-union and a decrease in the total fracture callus bone volume (Fig. 4i–l). Histologic analysis of the fracture callus was consistent with defects in mineralization with decreased bone and increased cartilage in the callus (Extended data 10a–g).
To establish if a population analogous to PSCs exists in humans, human periosteal tissue from femur was sectioned and stained, demonstrating cells expressing Cathepsin K and CD200 (Fig. 4m). Flow cytometry similarly revealed the presence of a population (Lin− CD90− CD200+, CD105-; hereafter h-PSCs) in human periosteum bearing an immunophenotype similar to that of murine PSCs (Fig. 4n, Extended data 10h–j). These human PSCs were multipotent as they underwent osteogenic, adipogenic and chondrogenic differentiation in vitro (Fig. 4o). When transplanted into the kidney capsule of immunocompromised mice, h-PSCs, h-PP1, and h-PP2 cells all mediated intramembranous bone formation (Fig. 4p, Extended data 10l). Thus, human periosteum contains a population analogous to PSCs.
Here we have identified a stem cell that serves as a physiologic precursor of periosteal osteoblasts, playing a critical role in both fracture healing and modeling of the bone cortex. As the bone cortex is essential for the biomechanical resistance of bone to fracture26–29, isolation of PSCs is likely to facilitate both the development of drugs that increase cortical bone thickness and also cellular therapy for skeletal injury30. Moreover, the existence of a discrete periosteal stem cell demonstrates that bone is comprised of multiple distinct pools of stem cell progenitors, which in turn allows for the functional specialization of each of those stem cells and their derivatives. In this regard, PSCs are specialized for intramembranous bone formation at baseline, providing a cellular basis for long-observed differences between intramembranous and endochondral bone formation. Lastly, the interconversion between PSCs and endochondral competent populations suggests that such interconversions may occur more broadly and contribute to the cellular basis of skeletal pathology.
Methods
Animals:
Cathepsin K-cre (Ctsk-cre) mice were a gift from S. Kato (University of Tokyo, Tokyo, Japan)31. Floxed Osterix (Osxfl/fl) mice were a gift from B. de Crombrugghe (Univeristy of Texas M.S. Anderson Cancer Center, Houston, Texas)32. R26R-Confetti (Stock 017492), β actin-cre ERTM (Stock 004682), NOD scid gamma (NSG, Stock 005557) and mTmG mice (Stock 007676)33 were purchased from Jackson Laboratories. All mice were maintained on a C57Bl6/J background throughout the study. All animals were maintained in accordance with the NIH Guide for the Care and Use of Laboratory Animals and were handled according to protocols approved by the Weill Cornell Medical College subcommittee on animal care (IACUC). No randomization of mice were done during these experiments. Blinding for experiments was done only for micro computed tomography (μCT) analyses. Sample sizes used at minimum 3 animals per experimental procedure.
Cell line:
Validation for single cell sorting was initially done with RAW264.7 cells from ATCC (Cat # ATCC® TIB-71), a commercially available mouse macrophage cell line. These cells were not independently authenticated since they were obtained directly from ATCC and were only used to validate single cell sorting capabilities prior to experimentation. Cells were tested for mycoplasma using the PlasmoTest™ - Mycoplasma Detection Kit from InvivoGen (Cat # rep-pt2) and PCR analysis. All cells were confirmed to be free of mycoplasma.
Tamoxifen injection:
β-actin creERTM activity was induced at post-natal day 3. 100 mg/kg of Tamoxifen (Sigma) was prepared in corn oil and intraperitoneally injected into nursing females for 3 consecutive days. Control groups were conducted simultaneously by injecting the nursing female with corn oil only. The resulting litters were sacrificed 14 days after induction and femurs were fixed for 4 hours with 4% paraformaldehyde and processed for imaging as described below.
Human samples:
This project was approved by the IRB committee of Memorial Sloan Kettering Cancer Center (MSKCC) (IRB No. 97–094). HIPAA authorization was included in the IRB protocol and all ethical guidelines conform to the 2008 Helsinki declaration. Patient consent was obtained and all identifying patient information was scrubbed at the time of sample procurement.
Isolation of mesenchymal cells:
Skeletal tissue from postnatal day 7, 15 or 32 mice was subjected to both mechanical and enzymatic digestion. The harvested tissue was minced using razor blades and digested for up to 1 hour with Collagenase P (1mg/ml; Roche, cat 11213857001) + Dispase II (2mg/ml; Roche, cat 04942078001) digestion buffer at 37°C with agitation. Media containing 2% serum was added to the digest and the tubes were centrifuged to pellet cells. The supernatant was removed, and the pellet was resuspended in DNase I (2 units/ml) solution and briefly incubated for 5 mins at 37°C. Media was added to the tube and the digested tissue was re-suspended thoroughly by pipetting and then filtered thorough 70-micron nylon mesh. Tubes were centrifuged and the resulting cell pellet was subjected to FACS.
Microdissection of mouse periosteum, calvarial suture and calvarial periosteum was performed under a dissecting microscope and the resulting tissue samples were subjected to the same digestion protocol. For human samples, tissue was treated with Pronase (1mg/ml; Roche, cat 10165921001) for 20 minutes at 37°C under agitation and spun down at 1500 rpm for 10 minutes prior to collagenase treatment as above.
Florescence assisted cell sorting (FACS):
Cells were washed twice with ice cold FACS buffer (2% FBS + 1mM EDTA in PBS), incubated with blocking buffer (1:100 dilution; BD bioscience 553142 for mouse and 564765 for human) for 15 mins at 4°C. Primary antibody dilutions were prepared in brilliant stain buffer (BD bioscience 563794). Cells were incubated in the dark for 1 hour on ice with primary antibody solution, washed 2 to 3 times with FACS buffer, and incubated with secondary antibody solution for 20 minutes. Cells were then washed several times and re-suspended in FACS buffer with DAPI (4–6, Diamidino-2-Phenylindole; 1μg/ml; Invitrogen D1306). FACS was performed using a Becton-Dickinson Aria II equipped with 5 lasers (BD bioscience). Beads (eBioscience 01–1111) were used to set initial compensation. Fluorescence minus one (FMO) controls were used for additional compensation and to assess background levels for each stain. Gates were drawn as determined by internal FMO controls to separate positive and negative populations for each cell surface marker. Typically, 1 to 2 million events were recorded for each FACS analysis, and the data was analyzed using FlowJo (version 10.1). Calculations were made in Excel and bar graphs were generated in GraphPad Prism.
To better depict the FACS gating strategy, we have made changes throughout our figures, using color-coded boxes to illustrate parent/daughter gates. Additionally Extended data. 2d has been provided to show the full details of the gating strategies utilized.
FACS antibodies:
Antibodies for FACS of human samples included CD235a (clone HIR2, eBioscience), CD31 (cloneWM-59, eBioscience), CD45 (BD bioscience), CD90 (clone 5E10, BD bioscience), CD140α (clone aR1, BD bioscience), CD105 (clone 266, BD bioscience), CD200 (clone MRC OX-104, BD bioscience), CD146 (clone P1H12, BD bioscience), CD140α (clone αR1, BD bioscience), CD49f (clone GoH3, BD bioscience), CD51 (clone NKI-M9, Biolegend) CD295 (clone 52263, BD Bioscience). Antibodies for FACS of mouse samples include CD45 (clone 30-F11, BD bioscience), CD31 (MEC13.3, BD bioscience), Ter119 (clone Ter119, BD bioscience), CD90.2 (clone 53–2.1, BD bioscience), BP-1 (clone 6C3, eBioscience), CD200 (clone OX-90, BD bioscience), CD105 (clone MJ7/18, Biolegend), CD146 (clone ME-9F1, BD bioscience), CD140α (clone APA5, Biolegend), CD49f (clone GoH3, BD bioscience), CD51 (clone RMV-7, BD bioscience), Ly6A/E (clone D7, BD bioscience), LeptinR (R&D system), CD61 (clone 2C9.G2, BD bioscience), Streptavidin eFluor 710 (eBioscence), Streptavidin BUV737 (BD bioscience).
Cell culture:
Sorted cells were cultured both under hypoxic (2% O2, 10% CO2, 88% N2) and non-hypoxic conditions (20% O2). In vitro differentiation of FACS isolated populations was conducted under hypoxic conditions (Fig. 2d, Extended data 2i, 3h, 5k–m). Clonal multipotency of sorted cell populations was evaluated under non-hypoxic conditions (Fig. 2e, Fig. 4o, and Extended data 3d, 5c). Mesensphere formation capacity was evaluated under non-hypoxic conditions (Fig. 2a, Extended data 3f, 5a).
Mouse primary cells were grown in complete mesencult medium (basal medium; cat no 05501 + stimulatory supplements; cat no 05502, 05500, Stem Cell Technologies). After initial cell plating, cells were left undisturbed and allowed to grow at 37°C under humidified conditions for a week. Half of the media was replaced every 7 days. Cells were passaged once they were 60–70% confluent with stem pro accutase solution (Gibco, cat no A11105–01).
Sorted human cells were cultured under conditions similar to those described above using a commercial media preparation (basal medium; cat no 05401 + stimulatory supplements; cat no 05402, Stem Cell Technologies).
Mesensphere assays:
For mesensphere assays, FACS isolated single cells were plated at a density of 100 cells / cm2 and allowed to grow in ultra-low adherence culture dishes (Stem Cell Technologies, cat no 27145). Plates were incubated at 37°C supplied with 5% CO2 and left undisturbed for a week. Half of the media was replaced every 7 days. Mesenspheres were dissociated into single cells using Accutase solution (Gibco, cat no A11105–01) and were subsequently re-plated to generate secondary and tertiary mesenspheres.
Clonal differentiation assay:
The differentiation potential of 10 colonies derived from single FACS isolated PSCs was examined (Fig. 2e). Briefly, single FACS sorted cells were plated at a density of 100 cells per 10 cm dish and allowed to form individual colonies. Initial dispersion of the plated cells as single cells was confirmed by light microscopy. Each of the selected colonies were extracted using a cloning cylinder. The extracted cells were regrown for 3–4 days in 12 well plates and then allowed to differentiate under both osteogenic and adipogenic conditions as described below. A similar approach was utilized to analyze clonal differentiation of FACS sorted calvarial PSCs (Extended data 5c).
Osteogenic differentiation and Alizarin red staining:
Sorted cells were expanded and then allowed to differentiate using osteogenic differentiation medium (Stem Pro Osteogenesis Differentiation kit, cat no A10072–01) for 19–28 days. Media was changed every 2 days. At the end of this period, cells were washed with cold PBS and fixed with 70% ethanol for 15 mins on ice. Cells were washed with distilled water and stained with Alizarin red solution for 2–3 mins. Cells were then washed thoroughly with water and air dried prior to microscopic visualization.
Adipogenic differentiation and Oil red O staining:
Adipogenic differentiation was similarly conducted with sorted cells as described above. Briefly, cells were allowed to differentiate in adipogenic differentiation media (Stem Pro Adipogenesis Differentiation kit, cat no A10070–01). Fresh media was added every 2–3 days for a total of 14–20 days. Media was removed, and cells were washed with PBS and fixed with 4% Paraformaldehyde (PFA) for 30 mins at room temperature (RT). Cells were rinsed again with PBS and stained for 30 mins with oil red O working solution (3:2 dilution with water). Cells were then observed under a light microscope after 4–5 washes with PBS.
Chondrogenic differentiation and Alcian blue staining:
Micromass cultures were generated by seeding 1 × 10⁵ cells in 5–10 μl of basal media. Cells were allowed to adhere to a glass slide for 2 hours under highly humidified conditions at 37°C. Chondrogenic differentiation media (Stem Pro Chondrogenesis Differentiation kit, cat no A10071–01) was slowly added and cells were incubated at 37°C supplied with 5% CO2. Cultures were re-fed every 2–3 days and allowed to differentiate for a minimum of 14 days.
At the end point of this study, media was removed, cultures were washed with PBS and fixed with 4% PFA for 30 mins. Cultures were stained for 30 mins with 1% Alcian blue solution, washed three times with 0.1N HCl and then with PBS.
Separately, pellet culture was conducted with 250 × 103 cells seeded in 15 ml polypropylene tubes. The pellet was cultured in chondrogenic differentiation medium, which was changed every 2–3 days for a period of 2 weeks. The pellet was harvested, fixed with 4% PFA and embedded in OCT with 15% sucrose solution. 10 μm thick sections were cut and Alcian blue staining was performed as described.
Surgical procedures:
All surgical procedures were performed under isoflurane (1–4%) anesthesia. Surgical sites were sterilized using a betadine/iodide/isopropanol prep after hair removal by a clipper with a #40 blade and a depilatory cream (Nair). After surgery, the visceral lining or muscle was sutured with absorbable Ethicon vicryl sutures (VWR, cat no 95057–014) prior to closing the skin with wound clips that were removed 2 weeks post-operatively. Animals received intraperitoneal Buprenex (0.5 mg/kg) and oral Meloxicam (2.0 mg/kg) as analgesia prior to surgery and for every 24 hours post-surgery for 3 days. All surgical procedures are approved by the institutional animal care and use committee at Weill Cornell Medical College.
Kidney capsule transplantation model:
Briefly, 8–10-week old male mice were anesthesized and shaved on the left flank and abdomen prior to sterilization of the surgical site. The kidney was externalized thorough a 1cm incision and a 2-mm pocket in the renal capsule was made. A 5 μl matrigel plug (Corning, cat no 356231) containing 8,000 to 10,000 cells was implanted underneath the capsule and the hole was sealed using a cauterizer prior to replacing the kidney back into the body cavity. Recipients for these experiments were syngenic with donors. Moreover, to avoid potential immunogenicity of GFP itself, all transplantation studies of mGFP+ cells were conducted in mTmG hosts that have baseline immunologic tolerance to GFP variants. Animals were euthanized by CO2 after 6 weeks. After sacrifice, kidneys were fixed with 4% PFA for 5 hours and bone formation was detected by micro-CT. Samples were subjected to infiltration, embedding and sectioning as described below. Hematoxylin & Eosin (H&E), Von Kossa staining were performed following previously described protocols34. Standard Safranin O stain and Alizarin red staining was performed to detect cartilage and bone components.
Altogether, over 30 individual mouse transplantation procedures have been conducted across 5 separate days of experimentation to study the intramembranous versus endochondral differentiation preferences of PSCs versus non-CTSK-MSCs.
Mammary fat pad transplantation model:
To facilitate distinguishing host cells from mGFP+ transplanted cells, 3–4-week-old female mTmG mice were utilized, where all host cells were mTomato+. These mice were anesthesized and their lower abdomen was shaved prior to sterilization of the surgical site. A 1–1.5 cm longitudinal incision was made along the midline of the body wall below the sternum and just above the pelvic region. A second 0.5 cm cut was made from the bottom of the midline incision towards the hip of the right hind limb. The skin was carefully pulled away from the peritoneum to expose the inguinal mammary gland. A 2-mm pocket was created in the mammary fat pad just below the lymph node and a 5 μl matrigel plug with desired number of cells was implanted into the pocket. The pocket was sealed by clamping the edges of the cut fat pad together with a toothed forcep. Wound clips were used to close the skin incisions. Animals were euthanized by CO2 at 2.5-weeks post-surgery, and the mammary fat pad was extracted, minced with razor blades and digested at 37°C in digestion buffer (Collagenase P (1 mg/ml) + Dispase II (2 mg/ml) in 2% serum medium) for 30–45 mins. Media was added and the tubes were spun for 10 mins at 1,500 rpm. The supernatant was carefully removed and DNase I solution was added for 5 mins without disturbing the pellet. The reaction was terminated by diluting the digestion solution with media. Tubes were again spun for 10 mins and the resulting pellet was prepared for FACS analysis.
Femur fracture model:
In brief, after anesthesia, an incision above the right anterolateral femur was made after sterilization of the surgical site. The femur and patella were then exposed and a 27-gauge syringe needle was inserted parallel with the long axis of the femur through the patellar groove into the marrow cavity. The needle was then removed and a single cut in the mid-diaphysis of the femur was made using a dremel saw with a diamond thin cutting wheel (VWR, cat no100230–724). A blunt 25-gauge needle was then reinserted into the marrow space through the hole made in the femur to stabilize the fracture. This needle was then trimmed so it would not project into stifle joint space. Muscle was then placed over the injury site and stitched with absorbable sutures prior to closing the skin with wound clips. We performed femur fracture in 6 weeks old Ctsk-cre; mTmG mice (Fig. 4f) and 4 weeks old Ctsk-cre; Osx flox mice (Fig. 4i). Mice were euthanized by CO2 after 3 weeks.
Sample preparation for cryo-sectioning:
Freshly extracted mouse samples were fixed with 4% Paraformaldehyde (PFA) for 4 hours at 4°C. Samples were washed with PBS and decalcified with 0.5M EDTA for 1–5 days depending on the age of the sample. Samples were incubated with infiltration solution (20% sucrose + 2% PVP in PBS) in rocking conditions until they sank to the bottom of the tube. Embedding was performed with OCT + 15% sucrose and samples were preserved at −80°C. 10–20 μm thick sections were cut using a Leica cryostat.
Immunohistochemistry (IHC):
Frozen samples were thawed at room temperature (RT) and rehydrated with PBS, permeabilized with PBS + 0.3% Triton X-100 for 15mins, and blocked for 1hour with 5% donkey serum in PBS (blocking buffer). Dilutions of primary antibodies were freshly prepared in blocking buffer. Samples were incubated overnight with primary antibodies at 4°C, then washed three times with PBS. Secondary antibodies (1:2000 dilution) were added to the sample for 1–2 hours, followed by washing three times with PBS. DAPI (300 nM) was added for 5–10 mins and the samples were mounted with antifade mounting solution (Life technologies, cat no P36970). Imaging was performed with a Zeiss LSM 880 with Airyscan high resolution detector confocal microscope.
For IHC of mesenspheres, mesenspheres were extracted and allowed to adhere on glass chamber slides for 24 hours. Spheres were fixed with 4% PFA for 15 mins at RT, washed twice with PBS, permeabilized with PBS + 0.5% Triton X-100 for 10 mins and blocked for 1–2 hours with blocking buffer (PBS + 2% BSA + 10% horse serum + 0.5% Triton X-100). Primary antibody dilutions were prepared in blocking buffer, and added to the spheres followed by overnight incubation at 4°C. Samples were washed three times with PBS and incubated with secondary antibody for 1hour and DAPI solution for 10 mins. Samples were subsequently processed for imaging as described above.
Primary antibodies for IHC:
Primary antibodies used were specific for Collagen type I (Abcam, ab34710, 1:100 dilution), Collagen type II (Millipore, MAB8887, 1:100 dilution), murine CD200 (Abcam, ab33734, 1:100 dilution), Nestin (Abcam, ab11306, 1:200 dilution), Gremlin 1 (Abcam, ab189267, 1:50 dilution), COMP (Abcam, ab74524, 1:50 dilution), Aggrecan (Abcam, ab3778, 1:100 dilution), Thy1.2 (Invitrogen, cat no. 14-0902-82, 1:50 dilution, 6C3 (Invitrogen, cat no. 14-5891-82 (1:50 dilution), CD105 (Abcam, ab107595, 1:100 dilution), Runx2 (Abcam, ab76956, 1:200 dilution), Alpl (Abcam, ab108337, 1:100 dilution), Osteocalcin (Abcam, ab93876, 1:100 dilution), CD146 (Abcam, ab75769, 1:100 dilution), CD140α (Abcam, ab96569, 1:100 dilution), CD200 (Abcam, ab203887, 1:200 dilution), Tartrate Resistant Acid Phosphatase (TRAP) (Abcam, ab185716, 1:50 dilution), and Cathepsin K (Abcam, ab19027, 1:200 dilution).
Calcein labelling:
Calcein stock solution (2.5 mg/ml) was freshly prepared in calcein buffer (ddH2O + 2% NaHCO3+ 150 mM NaCl). 4 weeks old Ctsk-cre; Osxflox mice from the same litter were given subcutaneous calcein injection (10 mg/kg) followed by a second injection after 2 days. Mice were euthanized after 24 hours, fixed overnight in 10% formalin solution and then stored in 70% ethanol. Non-decalcified femur sections were prepared for plastic embedding according to a previously published protocol34.
Histomorphometry:
Mice underwent dual calcein labeling, and undecalcified femur sections were prepared for analysis and stained for TRAP as previously described34. Dynamic histomorphometry parameters were measured using the Osteomeasure Analysis system (Osteometrics) and reported following standard nomenclature35. Mineral apposition rate (MAR; μm/day), bone formation rate / bone surface (BFR/ BS; μm3/mm2/day), bone volume (BV; mm3), bone volume / total volume (BV/TV), osteoclast number / bone perimeter (No. Oc / B.Pm) were determined.
Micro-CT and Paraffin embedding:
Micro computed tomography (μCT) was conducted following the previously described parameters36 on a Scanco Medical Micro-CT35 system at the Citigroup Biomedical Imaging Core. μCT operators and evaluators were blinded to the experimental groups under analysis. Human periosteal samples were fixed overnight with 4% PFA at 4°C. Samples were decalcified with 0.5M EDTA for 5–6 days and then subjected to paraffin embedding. The Translational Research Pathology Core at Weill Cornell performed paraffin embedding, sectioning and staining (H&E; CD 200 and Cathepsin K stain for human samples) following a previously published protocol36.
Bulk RNA sequencing:
Bulk RNA sequencing was performed on sorted PSC, PP1, PP2, and non-CTSK MSC cell populations isolated from 6-day old mouse femurs. cDNA libraries were generated using the Illumina TruSeq RNA Sample Preparation kit and sequenced on HiSeq4000 sequencer. Tophat2 was used to align raw sequencing reads to the mm10 mouse reference genome. Differential expression analysis was performed using DESeq2 package. The heatmap plot was generated using heatmap.2 in the R gplots package, where the expression values were normalized per gene over all samples37. For each gene, the mean and standard deviation (stdev) of expression over all samples was calculated, and the expression value underwent linear transformation using the formula (RPKM-mean)/stdev. For 16 bulk RNA samples, the average raw reads per sample was 46.2 million.
Single cell RNA sequencing using CEL-SEQ2:
Validation for single cell sorting was initially done with RAW264.7 cells using 384 well plates. Single cell sorting was confirmed thorough observation of growth of a single colony from the sorted cell (Extended data 6h). We found that cells were sorted into wells at 93% efficiency and the detected doublets were less than 2% (Extended data 6i).
For the experiment, CTSK-mGFP positive cells isolated from 6-day old mouse femur were sorted by FACS (Bencton - Dickinson Influx) and plated into individual wells of a 384 well-plate pre-loaded with unique barcoded RT-primers. After sorting, cells were snap frozen on dry ice before being submitted to the New York Genome Center (NYGC) for cDNA synthesis and library preparation. cDNA synthesis was performed in individual wells using a template-switching mechanism followed by PCR amplification. All barcoded amplified cDNA was then pooled and run on a pico-green assay and Fragment Analyzer to evaluate sample concentration and quality, respectively. Libraries were generated from 300 pg of pooled cDNA using the Nextera XT library preparation kit (Illumina). The library was then sequenced with custom sequencing primers across two lanes of a 25bp × 75bp rapid run (HiSeq 2500 instrument). Read 1 was composed of the cell barcode and unique molecular identifier (UMI), while read 2 was used to map the transcript to the mouse genome. After sequencing, the alignment and analysis was done using the NYGC re-tooled pipeline based on Drop seq Core tools38 (McCarroll lab) which provided basic QC and expression analysis. The delivered data contained FASTQ, Bam files and an expression matrix.
Seurat analysis:
Seurat version 2.0.1 and R version 3.4.1 were used for analysis of single cell RNA sequencing data39. Cells expressing at least 200 but not more than 5,500 genes were retained for analysis. Genes expressed in less than 3 cells were not taken into consideration. A total of 658 single cells were analyzed for the total number of unique molecular identifiers (UMIs) per cell, percent mitochondrial gene expression, percent ribosomal gene expression, and cell cycle. Initial clustering analysis showed an even distribution of mitochondrial gene content across clusters, so this was not considered further (data not shown). Cell cycle analysis was performed using a previously published approach40. Regression was performed to remove effects associated with cell cycle state, the number of UMI and ribosomal gene content. Clustering was performed using the first 12 principal components and clusters were visualized using t-SNE projection.
Monocle analysis:
Cell trajectory analysis was performed by using Monocle on CTSK-mGFP cells. Monocle version 2.4.0 and R version 3.4.0 was used to conduct analysis on the single cell sequencing data. Monocle analysis41–43 was performed using negbinomial. size function and the data was loaded using sparseMatrix. Quality control was performed by filtering low quality cells including dead cells, empty wells in the plate and doublets. The mRNA threshold was defined and cells with mRNA content between 35,000 through 295,000 were analyzed (Extended data 6j). The same CEL-SEQ2 dataset as used above was loaded for analysis (Extended data 6k). Cell trajectory was obtained using genes selected by a PCA-based method for cell ordering according to previously described methods41–43. Regression was performed to remove effects associated with cell cycle state and ribosomal gene content. A list of differentially expressed genes that change as a function of pseudo-time was obtained using fullModelFormulaStr. Genes that were significant at 10% false discovery rate were selected. Heat maps to visualize pseudo-time dependent genes were generated by using a subset of the significant genes.
Statistical analyses:
All data are shown as the mean ± standard deviation (S.D.) or standard error of the mean (S.E.M.) as indicated. Where applicable, we first performed the Shapiro-Wilk normality test for checking normality. For comparisons between two groups, a two-tailed, unpaired Student’s t-test was used. If normality tests failed, Mann-Whitney tests were used. For comparisons of three or more groups, one-way ANOVA was used if normality tests passed, followed by Tukey`s multiple comparison test for all pairs of groups. If normality tests failed, Kruskal-Wallis test was performed and followed by Dunn`s multiple comparison test. GraphPad PRISM software (v6.0a, La Jolla, CA) was used for statistical analysis. P < 0.05 was considered statistically significant.
Data availability
RNA sequencing and Single Cell sequencing data will be available at https://www.ncbi.nlm.nih.gov/geo/query/acc.cgi?acc=GSE106237. GSE106235 and GSE106236 are the subseries linked to GSE106237 (https://www.ncbi.nlm.nih.gov/geo/query/acc.cgi?acc=GSE106235; https://www.ncbi.nlm.nih.gov/geo/query/acc.cgi?acc=GSE106236). Microscopy images will be available upon reasonable request.
Extended Data
Extended data 1: Analysis of CTSK-mGFP cells in mouse femur.
a, CTSK-mGFP mesenchymal cells (green) were visualized in the mouse long bones at E14.5. Scale bar 200 μm. Enlarged images of areas marked by the dotted white boxes are provided in i and ii. DAPI for nuclei. b, Immunostaining for CD200 (magenta) confirmed co-localization (shown by yellow arrows) with CTSK-mGFP cells (green) in the periosteum. A separate pool of CD200+ cells are detected at the future primary ossification site (marked by dotted orange line). Nuclei stained with DAPI. Scale bar 20 μm. a-b, 3 independent experiments. c, CTSK-mGFP mesenchymal cells in the long bones of mice were detected by FACS at embryonic day 16.5. d, Visualization of CTSK-mGFP (green) cells in mouse long bones at E16.5. Nuclei stained with DAPI. Scale bar 500 μm. An enlarged view of the areas marked by dotted yellow boxes are shown in i and ii. CTSK-mGFP positive cells (green) were detected in the mouse periosteum (i and ii). e, CD200 (magenta) immunostaining confirmed co-localization with CTSK-mGFP cells (green) in the periosteum (top panel). CTSK-mGFP cells in the primary spongiosa morphologically consistent with osteoclasts stained negative for CD200 (bottom panel). Scale bar 20μm. c-e, 3 independent experiments. f, Visualization of CTSK-mGFP (green) cells in the periosteum (dotted white line) of mouse femur at post-natal day 6 (top) and day 12 (bottom). Nuclei shown by DAPI staining. Scale bar 20 μm. g, An enlarged view of osteocytes within the dotted white box is provided (i). CTSK-mGFP (green), nuclei (DAPI). Scale bar 20μm. 3 independent experiments. (ii) Quantification of total CTSK-mGFP labelled periosteal cells and mGFP labelled osteocytes in the mouse femur (***p= 6.95×10⁻¹⁶, mean ± S.E.M, n= 12 distinct areas of periosteum from 3 independent experiments. 2 tailed Student’s t-test). h, An enlarged view for main text Fig. 1e is provided. Representative images from 3 independent experiments. i, FACS plots showing expression of CD49f (left) and CD51 (right) in CTSK-mGFP cells isolated from long bones of 7-day old mice (Lineage - = Ter119−, CD45− and CD31−). 5 independent experiments.
j, 8 week old Ctsk-cre mouse femurs were immunostained for RUNX2 (a, magenta, top), Alkaline phosphatase (ALPL) (b, magenta, middle), and Osteocalcin (c, magenta, bottom). CTSK-mGFP (green), nuclei stained by DAPI, co-localization shown by yellow arrows. Scale bar 20 μm. Representative images from 3 independent experiments.
k, 12 day old Ctsk-cre mouse femurs were immunostained for Gremlin 1 (a, magenta, top) and Nestin (b, magenta, bottom). CTSK-mGFP (green), nuclei stained by DAPI, dotted white line indicates periosteum. Scale bar 20 μm. Representative images from 3 independent experiments.
Extended data 2: FACS analysis on microdissected periosteal tissue and characterization of PSCs.
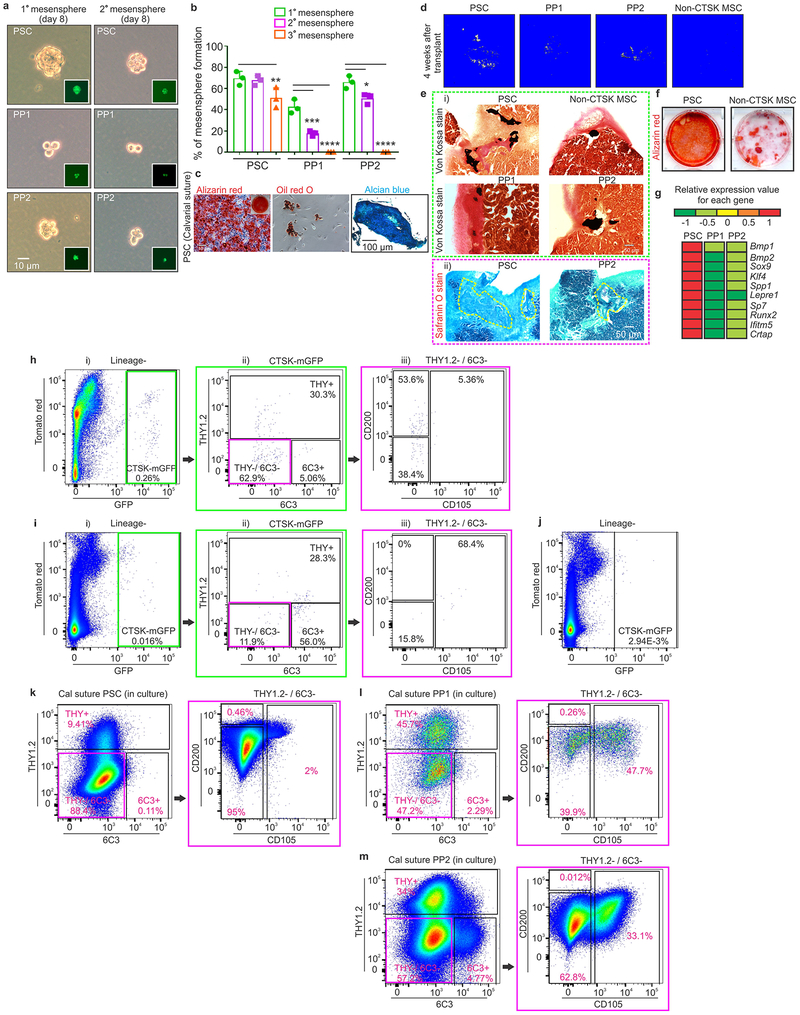
a, Flow cytometry of CTSK-mGFP cells microdissected from the periosteum of mouse (P7) long bones showing the distribution of PSC, PP1 and PP2 cells. b-c, Flow cytometry showing the distribution of PSCs, PP1 and PP2 cells in mouse long bones at day 15 (b) and day 32 (c) (Lineage - = Ter119−, CD45− and CD31−). a-c, Representative FACS plots from 10 independent experiments. d, Schematic representation of the strategy used for flow cytometry for analysis of periosteal PSC, PP1 and PP2 cell populations. e, FACS plot displaying the distribution of CD146 (i) and CD140α (ii) expression in bone marrow stromal cells. f, FACS plots displaying the distribution of CD140α (i) and CD146 (ii) in mouse periosteum obtained through periosteal microdissection. (Lineage - = Ter119−, CD45− and CD31−). e-f, Representative FACS plots from 5 independent experiments. g, Mouse bone marrow immunostained for CD146 (cyan) and CD140α (magenta). CTSK-mGFP (green), DAPI (blue) and Tomato red (red) to visualize stromal cells. Scale bar 100 μm. Representative images from 3 independent experiments. h, Clonogenic cells detected in the periosteum (top two panels, white arrows) and perichondrium region (bottom panel, white arrows) of mouse femur 2 weeks post induction of β-actin cre with tamoxifen. Enlarged view of areas marked by dotted white line are provided for each image. Scale bar 50 μm. Representative images from 3 independent experiments. i, FACS plots showing in vitro differentiation for PP1 (left plot) and PP2 (right plot) cells after 15 days of culture. Representative FACS plots from 3 independent experiments.
j, Alizarin red staining (red) of bone 5 weeks after transplantation of non-CTSK MSCs (left) and PSCs (right) into the kidney capsule. Representative images from 5 independent experiments. k, Relative gene expression for bone (Runx2) and cartilage specific genes (Col2a1, Comp, Chad) 5 weeks after transplant of PSCs and non-CTSK MSCs. Non-CTSK MSC derived cells display significantly higher expression of cartilage specific genes than PSCs. (*p= 0.003 for Col2a1, *p= 0.002 for Comp, *p= 0.002 for Chad, mean ± S.D, n=3, 2 tailed Student’s t-test). l, CTSK-mGFP positive PSCs (green) were immunostained for RUNX2 (magenta, top panel) and Osteocalcin (magenta, middle and bottom panels) 3, 4 or 5 weeks after transplantation into the kidney capsule. Nuclei were stained with DAPI. Scale bar 20 μm. Representative images from 3 independent experiments.
Extended data 3: Functional characterization of non-CTSK MSC cells, PSCs and its derivatives.
a, Total numbers of PSCs and non-CTSK MSCs in mouse femurs at postnatal day 7, day 15 and day 32. Significant decreases in PSCs are observed at day 15 (**p=0.006) and day 32 (**p=0.009) when compared to day 7. Significant decreases in non-CTSK MSCs are observed at day 15 (***p= 3.8×10⁻⁵) and day 32 (***p=0.0003) when compared to day 7 (mean ± S.D, n =3 independent experiments; 5 animals/group for day 7, day 15; 3 animals/group for day 32; 2-tailed Student’s t-test). b, μCT images of the bone formed by non-CTSK MSCs (left) and PSCs (right) 5 weeks after transplantation. Representative images from 5 independent experiments. c, Quantification of bone volume (BV) when equal numbers of non-CTSK MSCs and PSCs were transplanted into secondary hosts (p = non-significant (ns), mean ± S.E.M, n= 3 independent experiments, 2-tailed Student’s t-test). d, Clonal non-CTSK MSC colonies were split for differentiation into osteoblasts (Alizarin red staining; left) and adipocytes (Oil red O staining; middle; scale bar 20μm). Separately, chondrocyte differentiation potential was assayed (Alcian blue staining, right; scale bar 100μm). Representative images from 4 independent experiments. e, Clonal differentiation capacity of 10 colonies isolated from PSCs and non-CTSK MSCs after subsequent culture under osteogenic (left) and adipogenic (right) differentiation conditions. All 10 colonies from each population were equally multipotent (mean ± S.D, n= 3 independent experiments. f, Bright field images of primary (left), secondary (middle) and tertiary mesenspheres (right, scale bar 20 μm) derived from non-CTSK MSCs. Tomato red (red) expression is shown in the inserts. Representative images from 3 independent experiments. g, Quantification of % of PSCs and non-CTSK MSCs able to form mesenspheres. *p=0.02, one way ANOVA, Dunnett’s multiple comparison test, mean ± S.D, n = 3 independent experiments. h, FACS analysis of in vitro differentiation of non-CTSK MSCs (right and left plots) after 15 days of culture. Color coded boxes (red) indicates parent/daughter gates. i, FACS plots of non-CTSK MSC-derived cells after the first round of mammary fat pad transplantation (Lineage- = Ter119−, CD45− and CD31−). Color coded boxes (red and green) indicates parent/daughter gates. h-i, Representative FACS plots from 3 independent experiments.
j, FACS for CD140α (i) and CD146 (ii) in PSCs after transplantation into the mammary fat pad. k, FACS for expression of GFP (i),CD140α (ii), and CD146 (iii) in non-CTSK MSCs after mammary fat pad transplantation. l, PP1 cells were transplanted into the mammary fat pad of primary hosts for 2.5 weeks and then analyzed by FACS (i-iii). Color coded boxes (green and magenta) indicate parent/daughter gates. m-n, PP2 cells were isolated by FACS and implanted into the mammary fat-pad of primary recipients. The PP2-derived cells in primary recipients were analyzed by FACS (m, i-iv), and PP2 cells were re-isolated for transplantation into secondary recipients. PP2-derived cells in secondary recipients were analyzed by FACS (n, i-iv). Color coded boxes (green, magenta and orange) indicate parent/daughter gates. j-n, Representative FACS plots from 3 independent experiments.
Extended data 4: Differentiation of PSCs, PP1, PP2 cells when transplanted into kidney capsule of secondary hosts and FACS analysis of CTSK-mGFP calvarial cells.
a, CTSK-mGFP positive PSCs (green) were immunostained for Thy1.2 (magenta, top panel), 6C3 (magenta, middle panel) and CD105 (magenta, bottom panels) 3 weeks after transplantation into the kidney capsule of primary recipients. b, CTSK-mGFP positive PP1 cells (green) were immunostained for 6C3 (magenta, top panel) and CD105 (magenta, bottom panels) 3 weeks after transplantation into the kidney capsule. c, CTSK-mGFP positive PP2s (green) were immunostained for Thy1.2 (magenta, top panel), and CD105 (magenta, bottom panels) 3 weeks after transplantation into the kidney capsule. Nuclei were stained with DAPI, Tomato red (red). Scale bar 50 μm. a-c, Representative images from 3 independent experiments.
d-e, FACS analysis of PSCs, PP1s and PP2s at P15 in mouse calvarial suture (d) and calvarial periosteum (e). f-g, FACS for THY in CTSK-mGFP cells isolated from calvarial suture (f i, g i) and calvarial periosteum (f ii, g ii) at day 15 (left plots) and day 32 (right plots). d-g, Representative FACS plots from 3 independent experiments.
h, CD146 and SCA1 expression in CTSK-mGFP cells from the suture (i, ii) and periosteum (iii, iv) of P6 mouse calvarium. Representative FACS plots from 10 independent experiments.
i-j, FACS for CD146 (i i, j i) and SCA1 (i ii, j ii) in calvarial periosteum of mice at day15 (top plots) and day 32 (bottom plots). Representative FACS plots from 3 independent experiments.
Extended data 5: Functional characterization of CTSK-mGFP positive calvarial suture cells.
a, Bright field images of primary (left; scale bar 10μm) and secondary (right) mesenspheres derived from calvarial suture PSCs (top), PP1 (middle) and PP2 (bottom) cells. GFP (green) expression shown in the inserts. Representative images from 3 independent experiments. b, Quantification of the % of PSC, PP1 and PP2 cells able to form mesenspheres. Tertiary colony formation is significantly reduced in PSCs (**p=0.0034). Both PP1 and PP2 cells show significant reduction in secondary (***p=0.0002 for PP1and *p=0.016 for PP2) and tertiary mesensphere formation (****p=0.0001 for PP1, ****p=0.0001 for PP2). One way ANOVA, Dunnett’s multiple comparison test, mean ± S.D, n = 3 independent experiment). c, Clonal PSC colonies were split for differentiation into osteoblasts (Alizarin red staining; left) and adipocytes (Oil red O staining; middle; scale bar 10μm). Separately, chondrocyte differentiation potential was assayed (Alcian blue staining, right, scale bar 100μm). Representative images from 3 independent experiments. d, The amount of bone formed by PSCs, PP1, PP2 and non-CTSK MSCs 4 weeks after transplantation into the kidney capsule of secondary hosts was determined by μCT. e, Von Kossa staining (e i, dotted box in green) displaying bone organoid formation in the kidney capsule by PSCs (left panel, top), non-CTSK MSCs (right panel, top), PP1 (left panel, bottom) and PP2 (right panel, bottom) cells. Scale bar 50μm. Safranin O staining (e ii, dotted box in magenta) indicates an absence of cartilage formation (transplant area shown by dotted yellow line) after transplant of PSCs (left) and PP2 (right) cells. Scale bar 50μm f, In vitro osteogenic differentiation of PSCs (left image) and non-CTSK MSCs (right image) as determined by Alizarin red staining (red). d-f, Representative images from 3 independent experiments. g, Heatmap generated from quantitative real time PCR analysis shows differences in gene expression between calvarial suture PSCs and the progenitor populations, PP1 and PP2 cells. h, PSCs were transplanted into a mammary fat pad of primary hosts for 2.5 weeks and then analyzed by FACS (i-iii). Color coded boxes (green and magenta) indicate parent/daughter gates. i, FACS analysis of PP2 cells after transplantation into the mammary fat pad of primary hosts (i-iii).j, FACS analysis shows poor engraftment and loss of PP1 cells (as detected by GFP expression) when transplanted into the mammary fat pad of primary hosts. k-m, FACS plots demonstrating the in vitro differentiation of PSC (k), PP1 (l), and PP2 cells (m) when cultured for 2 weeks. Color coded boxes (magenta) indicate parent/ daughter gates for each analyzed cell population. h-m, Representative FACS plots from 3 independent experiments.
Extended data 6: Gene expression analysis in CTSK-mGFP cells isolated from mouse femurs.
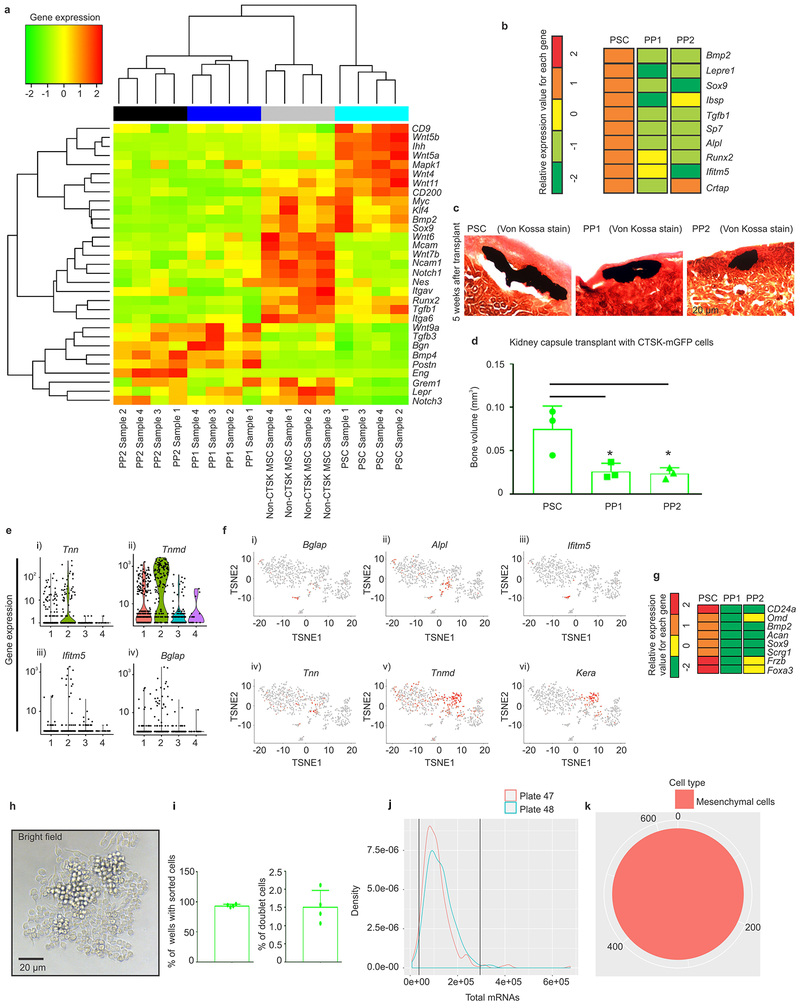
a, Bulk RNA sequencing was conducted in FACS isolated PSC, PP1, PP2 and non-CTSK mGFP MSCs from 6 day old mouse femurs. Hierarchical clustering analysis performed on RNA-seq data. b, Heatmap generated from bulk RNA sequencing of FACS sorted cells shows differences in gene expression between PSCs and the progenitor populations, PP1 and PP2 cells. c, Von Kossa staining indicates bone organoid formation by PSCs (left), PP1 (middle) and PP2 cells (right) 5 weeks after transplantation into the kidney capsule. Scale bar 20μm. Representative images from 3 independent experiments with 3 animals/group. d, Significantly reduced bone formation (BV) in PP1 (*p=0.04) and PP2 (*p=0.032) cells when compared to PSCs after transplantation. mean ± S.D, n= 3 independent experiments, 2 tailed Student’s t-test.
e, Relative expression of Tnn (i) Tnmd (ii) Ifitm5 (iii) and Bglap (iv) among the four clusters (identified by 1–4) that were generated thorough analysis of 658 CTSK-mGFP positive mesenchymal cells using the Seurat package. Gene expression along the y-axis and Cell clusters (1–4) along x-axis. f, Expression of genes such as Bglap (i), Alpl (ii), Ifitm5 (iii), Tnn (iv), Tnmd (v) and Kera (vi) are shown by pseudcoloring of t-SNE plots. g, Heatmap generated from bulk RNA sequencing shows differences in gene expression between PSCs and the progenitor populations, PP1 and PP2 cells. h-k, Monocle analysis of Cell seq data. h, A brightfield image of a colony that was generated from single cell sorting of RAW 264.7 cells by FACS. Scale bar 20 μm. Representative images from 3 independent experiments. i, Graphs indicate the percentage of wells that received sorted cells by FACS (left graph) and the percentage of doublets detected in those wells (right graph) (mean ± S.D; n=4).j Data represents the total mRNA amount in the two 384-well plates (Plate 47 and Plate 48) that were sequenced by CELL-SEQ2.k, Pie chart displays that the analyzed CTSK-mGFP positive cells were mesenchymal in origin.
Extended data 7: μCT, histomorphometric analysis and characterization of cells isolated from Osx flox; Ctsk-cre+ mouse femur.
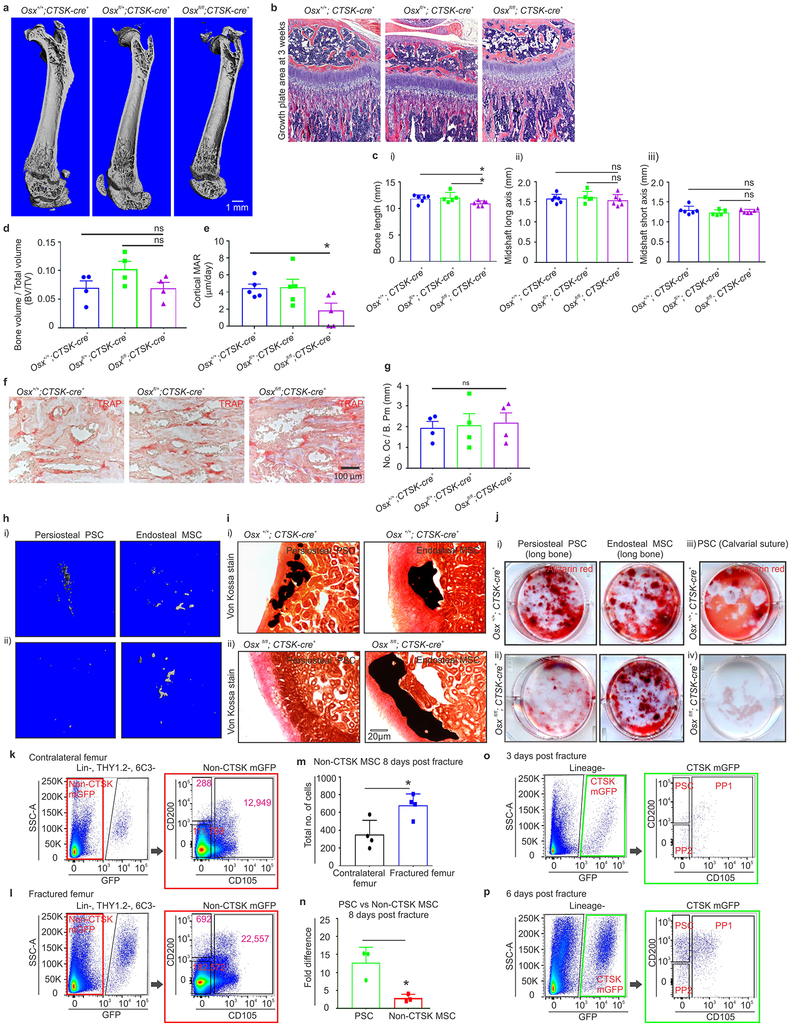
a, μCT images of longitudinal sections of femurs from Osxfl/fl; Ctsk-cre mice or littermate controls at 4-weeks of age. b, H and E staining showing growth plate morphology in Osxfl/fl; Ctsk-cre mice or littermate controls. a-b, Representative images from 5 independent experiments. c, Graphs display measurement of bone length (i), midshaft along long axis (ii) and midshaft along short axis (iii). Osx fl/fl; Ctsk-cre+ mice show a significant reduction in bone length (i) compared to Osx fl/+; Ctsk-cre+ (*p= 0.039) and Osx+/+ Ctsk-cre+ (*p= 0.034) (mean ± S.D, n = 6 animals per group, 2 tailed Student’s t-test). d, Quantification of bone volume/total volume (BV/TV) for trabecular bone (ns = non-significant, mean ± S.E.M, n = 4 animals per group, 2 tailed Student’s t-test). e, Quantification of histomorphometric parameters. Cortical mineral apposition rate (MAR; μm/day) (*p= 0.031; mean ± S.E.M, n=5 animals / group at 4 weeks of age; 2-tailed Student’s t-test). f, TRAP staining of osteoclasts in the femur of the indicated mice at 4 weeks of age. Trabecular bone area of mouse femurs. Scale bar 100μm. Representative images from 4 independent experiments. g, Quantification of osteoclast number/bone perimeter (No. Oc / B. Pm). (ns = non-significant, mean ± S.E.M, n = 4 animals per group, 2 tailed Student’s t-test). h, μCT images showing the amount of bone formed when periosteal PSCs (left column) and endosteal MSCs (right column) isolated from femurs of Osx+/+ ; Ctsk-cre+ (top, i) and Osxfl/fl ; Ctsk-cre+ mice (bottom, ii) were transplanted into the kidney capsule.i, Von Kossa staining (black) of bone organoids formed after transplantation of periosteal PSCs (left column) and endosteal MSCs (right column) isolated from Osx+/+ ; Ctsk-cre+ (top, i) and Osxfl/fl ; Ctsk-cre+ mice (bottom, ii) and transplanted into the kidney capsule. Scale bar 20μm.h-i, Representative images from 3 independent experiments.j, Alizarin red staining (red) of periosteal PSCs (left column) and endosteal MSCs (right column) isolated from the femur (i, ii) and calvarial sutures (iii, iv) of Osx+/+ ; Ctsk-cre+ (top panel) and Osxfl/fl ; Ctsk-cre+ mice (bottom panel) after culture under osteoblast differentiation conditions. Representative images from 3 independent experiments. k-l, FACS plots of contralateral unfractured femurs (k) and fractured femurs (l). Color coded boxes (red) indicate parent/daughter gates. Representative FACS plots from 3 independent experiments. m, A significant increase (*p= 0.019) is seen in non-CTSK MSCs in callus tissue 8-days post fracture. Values displayed represent the absolute number of cells isolated per fracture callus. mean ± S.D, n = 4 independent experiments, 4 animals/group; 2 tailed Student’s t-test. n, Graph displays significantly (*p= 0.017) higher fold amount of PSCs than non-CTSK MSCs in the fractured callus (mean ± S.D; n=3 independent experiment; 2-tailed Student’s t-test). Values displayed are normalized relative to the pre-fracture numbers of the same corresponding population to demonstrate the fold expansion after fracture. o-p, FACS plots on fractured callus after 3 (o) and 6 days (p) of fracture. Color coded boxes (green) indicate parent/daughter gates. Representative FACS plots from 3 independent experiments.
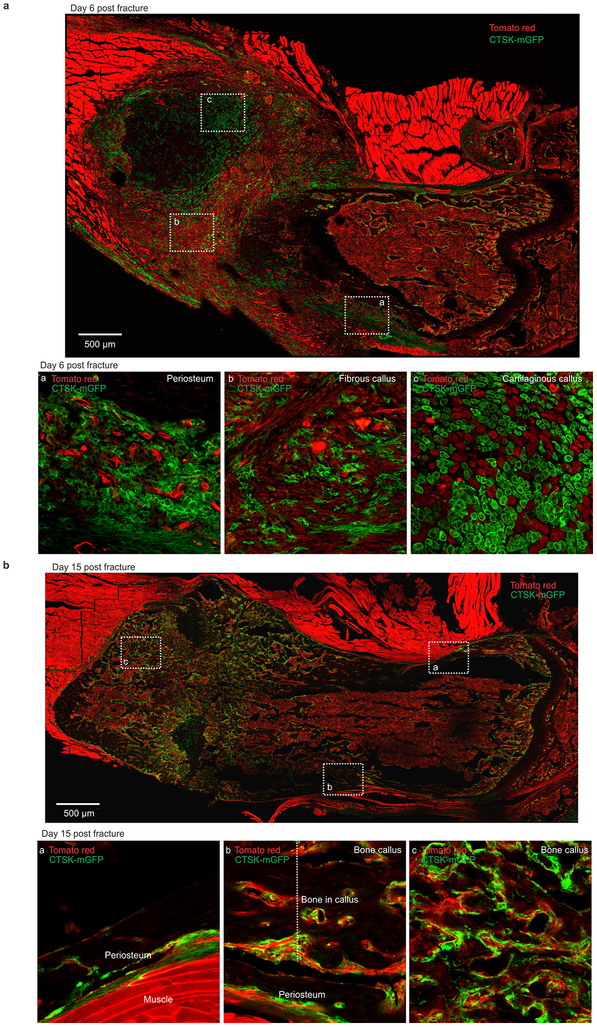
Extended data 8: Ctsk-cre; mTmG mouse femur 6 days and 15 days post fracture.
a, Mouse femur 6 days post-fracture. An enlarged view of areas indicated by dotted white boxes is provided in inserts a, b, and c. CTSK-mGFP (green), Tomato red (red). Scale bar 500μm. Representative images from 3 independent experiments. b, Mouse femur 15 days post-fracture. An enlarged view of areas indicated by dotted white boxes is provided in inserts a, b, and c. CTSK-mGFP (green), Tomato red (red). Scale bar 500μm. Representative images from 3 independent experiments.
Extended data 9: Characterization of CTSK-mGFP cells of mouse femur after fracture.
a, The periosteum of mouse femur 6 (left), 9 (middle) and 15 (right) days post-fracture. CTSK-mGFP (green), Tomato red (red). b, H and E staining of callus tissue 6 (top), 9 (middle) and 15 (bottom) days post-fracture. c, CD200 (magenta) immunostaining was conducted on femurs 6 (top two panels) and 9 (bottom panel) days post-fracture. CTSK-mGFP (green), DAPI for nuclei. d, Immunostaining for type 2 Collagen (magenta) was conducted 9 days post-fracture. e, TRAP staining (magenta) identifying osteoclasts in the bone callus (top) and bone marrow (middle) of fractured femurs. Few to no TRAP-positive cells were present in the periosteal region (bottom). CTSK-mGFP (green), DAPI for nuclei. a-e, Representative images from 3 independent experiments. f, PSCs isolated from fracture callus were transplanted into kidney capsule secondary hosts. μCT images of bone formation at 3 (left), 4 (middle) and 5 weeks (right) after PSC transplantation to the kidney capsule (i). Safranin O staining (red), and Von-Kossa staining (black) were performed on sectioned kidney samples to detect cartilage and bone at 3 (ii), 4 (iii) and 5 weeks (iv) after PSC transplantation. Scale bar 10 μm. H and E stains indicate that PSCs isolated from fracture callus are competent to recruit host-derived hematopoietic elements at the site of transplantation (yellow arrows, v). g, Immunostaining reveals co-localization of CTSK-mGFP cells (green) with cartilage specific markers such as Comp (magenta, top two panels) and Aggrecan (Acan, magenta, bottom panel) at 4 weeks after PSC transplantation. Scale bar 20μm. f-g, Representative images from 3 independent experiments.
Extended data 10: Characterization of Osx flox; Ctsk-cre mice and human periosteal cells.
a, μ-CT images of Osx flox; Ctsk-cre mice 12 days post fracture. b, Safranin O staining was performed to detect cartilage in the callus 12 days after fracture. a-b, Representative images from 3 independent experiments. c, Significantly higher amounts of cartilage were detected in Osxfl/fl ; Ctsk-cre+ mice when compared to Osxfl/+ ; Ctsk-cre+ mice (*p=0.035) and Osx +/+; Ctsk-cre+ (*p=0.04) mice (mean ± S.D; n=3 independent experiment, 3 mice / group; 2-tailed Student’s t-test). d, H and E staining of callus tissue 12 days after fracture. Representative images from 3 independent experiments. e, Significantly lower bone volume (BV) was detected in Osxfl/fl ; Ctsk-cre+ mice when compared to Osxfl/+ ; Ctsk-cre+ mice (***p=0.0002) and Osx+/+; Ctsk-cre+ (**p=0.002) mice (mean ± S.D; n=3 independent experiment, 3 animals / group; 2-tailed Student’s t-test). f, Safranin O staining for callus tissue 3 weeks after fracture. Representative images from 3 independent experiments. g, Significantly higher amounts of cartilage were detected in Osxfl/fl ; Ctsk-cre+ mice when compared to Osxfl/+ ; Ctsk-cre+ mice (***p=0.0005) and Osx +/+; Ctsk-cre+ (***p=0.0003) mice at 3 weeks post-fracture (mean ± S.D; n=3 independent experiment, 6 animals for control; 5 animals for het and knockout; 2-tailed Student’s t-test. h-i, FACS for CD49f, CD51 (h) Lepr (i) and CD146 (j) in human periosteal cells obtained from the femur. Representative FACS plots from 10 independent experiments. k, In vitro differentiation of h-PSCs (k, i-ii) and h-PP1 cells (k, iii-iv) after 3 weeks of culture. Color coded boxes (green) indicate parent/daughter gates for each cell type. Representative FACS plots from 3 independent experiments. l, Safranin O staining showing an absence of cartilage formation after h-PSC (left), h-PP1 (middle) and h-PP2 (right) transplantation into the kidney capsule of immunocompromised mice. The area containing the transplanted tissue is shown by the dotted yellow line. Representative images from 3 independent experiments.
Supplementary Material
Acknowledgements
This project was funded by the Office of the Director of the NIH under award DP5OD021351 given to MBG. MBG holds a Career Award for Medical Scientists from the Burroughs Welcome Foundation and a Basil O’Connor Award from the March of Dimes. This content is solely the responsibility of the authors and does not represent the official views of the National Institutes of Health. We thank Drs. Douglas Ballon, Bin He, Sushmita Mukherjee and the Flow Cytometry Core, Genomics Resources Core, Optical Microscopy Core and the Citigroup Biomedical Imaging Core at Weill Cornell Medicine for their technical support, Drs. Barry Sleckman and Todd Evans for insightful manuscript comments.
Footnotes
Online Content
The Methods, statement of Data availability and Nature Research reporting summaries along with additional References and Extended data will be available in the online version of the paper.
Conflicts of interest
The authors declare no competing financial interests.
References
- 1.Mendez-Ferrer S et al. Mesenchymal and haematopoietic stem cells form a unique bone marrow niche. Nature 466, 829–834, doi: 10.1038/nature09262 (2010). [DOI] [PMC free article] [PubMed] [Google Scholar]
- 2.Zhou BO, Yue R, Murphy MM, Peyer JG & Morrison SJ Leptin-receptor-expressing mesenchymal stromal cells represent the main source of bone formed by adult bone marrow. Cell Stem Cell 15, 154–168, doi: 10.1016/j.stem.2014.06.008 (2014). [DOI] [PMC free article] [PubMed] [Google Scholar]
- 3.Morikawa S et al. Prospective identification, isolation, and systemic transplantation of multipotent mesenchymal stem cells in murine bone marrow. The Journal of experimental medicine 206, 2483–2496, doi: 10.1084/jem.20091046 (2009). [DOI] [PMC free article] [PubMed] [Google Scholar]
- 4.Chan CK et al. Identification and specification of the mouse skeletal stem cell. Cell 160, 285–298, doi: 10.1016/j.cell.2014.12.002 (2015). [DOI] [PMC free article] [PubMed] [Google Scholar]
- 5.Worthley DL et al. Gremlin 1 identifies a skeletal stem cell with bone, cartilage, and reticular stromal potential. Cell 160, 269–284, doi: 10.1016/j.cell.2014.11.042 (2015). [DOI] [PMC free article] [PubMed] [Google Scholar]
- 6.Nakamura T et al. Estrogen prevents bone loss via estrogen receptor alpha and induction of Fas ligand in osteoclasts. Cell 130, 811–823, doi: 10.1016/j.cell.2007.07.025 (2007). [DOI] [PubMed] [Google Scholar]
- 7.Yang W et al. Ptpn11 deletion in a novel progenitor causes metachondromatosis by inducing hedgehog signalling. Nature 499, 491–495, doi: 10.1038/nature12396 (2013). [DOI] [PMC free article] [PubMed] [Google Scholar]
- 8.Chan CK et al. Clonal precursor of bone, cartilage, and hematopoietic niche stromal cells. Proc Natl Acad Sci U S A 110, 12643–12648, doi: 10.1073/pnas.1310212110 (2013). [DOI] [PMC free article] [PubMed] [Google Scholar]
- 9.Sacchetti B et al. Self-renewing osteoprogenitors in bone marrow sinusoids can organize a hematopoietic microenvironment. Cell 131, 324–336, doi: 10.1016/j.cell.2007.08.025 (2007). [DOI] [PubMed] [Google Scholar]
- 10.Pinho S et al. PDGFRalpha and CD51 mark human nestin+ sphere-forming mesenchymal stem cells capable of hematopoietic progenitor cell expansion. The Journal of experimental medicine 210, 1351–1367, doi: 10.1084/jem.20122252 (2013). [DOI] [PMC free article] [PubMed] [Google Scholar]
- 11.Chan CK et al. Endochondral ossification is required for haematopoietic stem-cell niche formation. Nature 457, 490–494, doi: 10.1038/nature07547 (2009). [DOI] [PMC free article] [PubMed] [Google Scholar]
- 12.Bi Y et al. Identification of tendon stem/progenitor cells and the role of the extracellular matrix in their niche. Nature medicine 13, 1219–1227, doi: 10.1038/nm1630 (2007). [DOI] [PubMed] [Google Scholar]
- 13.Maruyama T, Jeong J, Sheu TJ & Hsu W Stem cells of the suture mesenchyme in craniofacial bone development, repair and regeneration. Nat Commun 7, 10526, doi: 10.1038/ncomms10526 (2016). [DOI] [PMC free article] [PubMed] [Google Scholar]
- 14.Zhao H et al. The suture provides a niche for mesenchymal stem cells of craniofacial bones. Nature cell biology 17, 386–396, doi: 10.1038/ncb3139 (2015). [DOI] [PMC free article] [PubMed] [Google Scholar]
- 15.Cartwright P et al. LIF/STAT3 controls ES cell self-renewal and pluripotency by a Myc-dependent mechanism. Development 132, 885–896, doi: 10.1242/dev.01670 (2005). [DOI] [PubMed] [Google Scholar]
- 16.Li Y et al. Murine embryonic stem cell differentiation is promoted by SOCS-3 and inhibited by the zinc finger transcription factor Klf4. Blood 105, 635–637, doi: 10.1182/blood-2004-07-2681 (2005). [DOI] [PubMed] [Google Scholar]
- 17.Yang Y, Topol L, Lee H & Wu J Wnt5a and Wnt5b exhibit distinct activities in coordinating chondrocyte proliferation and differentiation. Development 130, 1003–1015 (2003). [DOI] [PubMed] [Google Scholar]
- 18.Hashimshony T et al. CEL-Seq2: sensitive highly-multiplexed single-cell RNA-Seq. Genome biology 17, 77, doi: 10.1186/s13059-016-0938-8 (2016). [DOI] [PMC free article] [PubMed] [Google Scholar]
- 19.Ono N, Ono W, Nagasawa T & Kronenberg HM A subset of chondrogenic cells provides early mesenchymal progenitors in growing bones. Nature cell biology 16, 1157–1167, doi: 10.1038/ncb3067 (2014). [DOI] [PMC free article] [PubMed] [Google Scholar]
- 20.Trapnell C et al. The dynamics and regulators of cell fate decisions are revealed by pseudotemporal ordering of single cells. Nature biotechnology 32, 381–386, doi: 10.1038/nbt.2859 (2014). [DOI] [PMC free article] [PubMed] [Google Scholar]
- 21.Baek WY, de Crombrugghe B & Kim JE Postnatally induced inactivation of Osterix in osteoblasts results in the reduction of bone formation and maintenance. Bone 46, 920–928, doi: 10.1016/j.bone.2009.12.007 (2010). [DOI] [PMC free article] [PubMed] [Google Scholar]
- 22.Nakashima K et al. The novel zinc finger-containing transcription factor osterix is required for osteoblast differentiation and bone formation. Cell 108, 17–29 (2002). [DOI] [PubMed] [Google Scholar]
- 23.Aliprantis AO et al. NFATc1 in mice represses osteoprotegerin during osteoclastogenesis and dissociates systemic osteopenia from inflammation in cherubism. The Journal of clinical investigation 118, 3775–3789, doi: 10.1172/JCI35711 (2008). [DOI] [PMC free article] [PubMed] [Google Scholar]
- 24.Utvag SE, Grundnes O & Reikeraos O Effects of periosteal stripping on healing of segmental fractures in rats. Journal of orthopaedic trauma 10, 279–284 (1996). [DOI] [PubMed] [Google Scholar]
- 25.van Gastel N et al. Engineering vascularized bone: osteogenic and proangiogenic potential of murine periosteal cells. Stem cells 30, 2460–2471, doi: 10.1002/stem.1210 (2012). [DOI] [PubMed] [Google Scholar]
- 26.Allen MR, Hock JM & Burr DB Periosteum: biology, regulation, and response to osteoporosis therapies. Bone 35, 1003–1012, doi: 10.1016/j.bone.2004.07.014 (2004). [DOI] [PubMed] [Google Scholar]
- 27.Ozaki A, Tsunoda M, Kinoshita S & Saura R Role of fracture hematoma and periosteum during fracture healing in rats: interaction of fracture hematoma and the periosteum in the initial step of the healing process. J Orthop Sci 5, 64–70 (2000). [DOI] [PubMed] [Google Scholar]
- 28.Yukata K et al. Aging periosteal progenitor cells have reduced regenerative responsiveness to bone injury and to the anabolic actions of PTH 1–34 treatment. Bone 62, 79–89, doi: 10.1016/j.bone.2014.02.002 (2014). [DOI] [PMC free article] [PubMed] [Google Scholar]
- 29.Malizos KN & Papatheodorou LK The healing potential of the periosteum molecular aspects. Injury 36 Suppl 3, S13–19, doi: 10.1016/j.injury.2005.07.030 (2005). [DOI] [PubMed] [Google Scholar]
- 30.Bianco P et al. The meaning, the sense and the significance: translating the science of mesenchymal stem cells into medicine. Nature medicine 19, 35–42, doi: 10.1038/nm.3028 (2013). [DOI] [PMC free article] [PubMed] [Google Scholar]
Additional References:
- 31.Nakamura T et al. Estrogen prevents bone loss via estrogen receptor alpha and induction of Fas ligand in osteoclasts. Cell 130, 811–823, doi: 10.1016/j.cell.2007.07.025 (2007). [DOI] [PubMed] [Google Scholar]
- 32.Nakashima K et al. The novel zinc finger-containing transcription factor osterix is required for osteoblast differentiation and bone formation. Cell 108, 17–29 (2002). [DOI] [PubMed] [Google Scholar]
- 33.Muzumdar MD, Tasic B, Miyamichi K, Li L & Luo L A global double-fluorescent Cre reporter mouse. Genesis 45, 593–605, doi: 10.1002/dvg.20335 (2007). [DOI] [PubMed] [Google Scholar]
- 34.Fukuda T et al. Sema3A regulates bone-mass accrual through sensory innervations. Nature 497, 490–493, doi: 10.1038/nature12115 (2013). [DOI] [PubMed] [Google Scholar]
- 35.Dempster DW et al. Standardized nomenclature, symbols, and units for bone histomorphometry: a 2012 update of the report of the ASBMR Histomorphometry Nomenclature Committee. Journal of bone and mineral research : the official journal of the American Society for Bone and Mineral Research 28, 2–17, doi: 10.1002/jbmr.1805 (2013). [DOI] [PMC free article] [PubMed] [Google Scholar]
- 36.Greenblatt MB et al. CHMP5 controls bone turnover rates by dampening NF-kappaB activity in osteoclasts. The Journal of experimental medicine 212, 1283–1301, doi: 10.1084/jem.20150407 (2015). [DOI] [PMC free article] [PubMed] [Google Scholar]
- 37.Crespo M et al. Colonic organoids derived from human induced pluripotent stem cells for modeling colorectal cancer and drug testing. Nature medicine 23, 878–884, doi:10.1038/nm.4355 10.1038/nm.4355http://www.nature.com/nm/journal/v23/n7/abs/nm.4355.html#supplementary-informationhttp://www.nature.com/nm/journal/v23/n7/abs/nm.4355.html#supplementary-information (2017). [DOI] [PMC free article] [PubMed] [Google Scholar]
- 38.Macosko EZ et al. Highly Parallel Genome-wide Expression Profiling of Individual Cells Using Nanoliter Droplets. Cell 161, 1202–1214, doi: 10.1016/j.cell.2015.05.002 (2015). [DOI] [PMC free article] [PubMed] [Google Scholar]
- 39.Satija R, Farrell JA, Gennert D, Schier AF & Regev A Spatial reconstruction of single-cell gene expression data. Nature biotechnology 33, 495–502, doi: 10.1038/nbt.3192 (2015). [DOI] [PMC free article] [PubMed] [Google Scholar]
- 40.Tirosh I et al. Dissecting the multicellular ecosystem of metastatic melanoma by single-cell RNA-seq. Science 352, 189–196, doi: 10.1126/science.aad0501 (2016). [DOI] [PMC free article] [PubMed] [Google Scholar]
- 41.Trapnell C et al. The dynamics and regulators of cell fate decisions are revealed by pseudotemporal ordering of single cells. Nature biotechnology 32, 381–386, doi: 10.1038/nbt.2859 (2014). [DOI] [PMC free article] [PubMed] [Google Scholar]
- 42.Qiu X et al. Single-cell mRNA quantification and differential analysis with Census. Nature methods 14, 309–315, doi: 10.1038/nmeth.4150 (2017). [DOI] [PMC free article] [PubMed] [Google Scholar]
- 43.Qiu X et al. Reversed graph embedding resolves complex single-cell trajectories. Nat Meth advance online publication, doi:10.1038/nmeth.4402 10.1038/nmeth.4402http://www.nature.com/nmeth/journal/vaop/ncurrent/abs/nmeth.4402.html#supplementary-informationhttp://www.nature.com/nmeth/journal/vaop/ncurrent/abs/nmeth.4402.html#supplementary-information (2017). [DOI] [PMC free article] [PubMed] [Google Scholar]
Associated Data
This section collects any data citations, data availability statements, or supplementary materials included in this article.
Supplementary Materials
Data Availability Statement
RNA sequencing and Single Cell sequencing data will be available at https://www.ncbi.nlm.nih.gov/geo/query/acc.cgi?acc=GSE106237. GSE106235 and GSE106236 are the subseries linked to GSE106237 (https://www.ncbi.nlm.nih.gov/geo/query/acc.cgi?acc=GSE106235; https://www.ncbi.nlm.nih.gov/geo/query/acc.cgi?acc=GSE106236). Microscopy images will be available upon reasonable request.


