Abstract
Bacterial cellulose (BC) is a biocompatible hydrogel with a three-dimensional (3-D) structure formed by a dense network of cellulose nanofibers. A limitation of using BC for applications in tissue engineering is that the pore size of the material (~ 0.02–10 µm) is smaller than the dimensions of mammalian cells and prevents cells from penetrating into the material and growing into 3-D structures that mimic tissues. This paper describes a new route to porous bacterial cellulose (pBC) scaffolds by cultivating Acetobacter xylinum in the presence of agarose microparticles deposited on the surface of a growing BC pellicle. Monodisperse agarose microparticles with a diameter of 300–500 µm were created using a microfluidic technique, layered on growing BC pellicles and incorporated into the polymer as A. xylinum cells moved upward through the growing pellicle. Removing the agarose microparticles by autoclaving produced BC gels containing a continuous, interconnected network of pores with diameters ranging from 300 to 500 µm. Human P1 chondrocytes seeded on the scaffolds, replicated, invaded the 3-D porous network and distributed evenly throughout the substrate. Chondrocytes grown on pBC substrates displayed a higher viability compared to growth on the surface of unmodified BC substrates. The approach described in this paper introduces a new method for creating pBC substrates with userdefined control over the physical dimensions of the pore network, and demonstrates the application of these materials for tissue engineering.
Keywords: Acetobacter xylinum, Bacterial cellulose, Agarose microparticles, Chondrocytes, Tissue engineering
1. Introduction
Cartilage is an essential connective tissue found throughout the human body, including the ears, nose, and joints located between bones [1]. The inability of mature cartilage to heal effectively after damage can lead to a loss of joint function [2]. Several mechanisms, based largely on transplantation, are used to replace and repair damaged cartilage following injury or disease. The most common mechanism for cartilage replacement consists of receiving alloge-nous grafts derived from human donors or xenografts from animals. This mechanism is favorable due to the availability of these materials; however, risks of pathogen transmission and graft rejection can complicate cartilage grafts from donors. The best clinical outcomes of cartilage replacement therapies are from autografts derived from the patients who are being treated. Limitations in the quantity, shape and size of donor cartilage place restrictions on using autografts for repairing cartilage defects [3,4]. As the estimated annual number of cartilage grafts exceeds one million [5] and outstrips available resources, several mechanisms for creating new tissues to replace damaged cartilage have been explored.
The emergence of a field centered upon cartilage tissue engi-neering has provided cartilage for clinical grafts that can maintain or restore tissue function. Fabricating regenerative cartilage substi-tutes requires three major components: scaffolds to support cell growth, cells and signaling molecules [6,7]. Scaffolds provide a substrate for mimicking the human extracellular matrix (ECM) upon which cells interact, and provide structural support for newly formed tissues. Scaffolds consist of a network of interconnected pores that provide mechanical support for cells in three dimen-sions, supply nutrients and growth factors to cells and promote cell invasion. Studies have demonstrated that biocompatible scaffolds with a pore size of 300–500 µm promote chondrocytes to attach to the surface, spread and proliferate [8].
Bacterial cellulose (BC) is an exopolysaccharide secreted by Acetobacter xylinum that forms a hydrogel and has characteristics that make it promising for biomaterials applications, including high tensile strength, high purity, formation of a three-dimensional (3-D) nanofibril network and biocompatibility [9,10]. To date, BC has been used as a scaffold for growing tissues involved in skin replacement, blood vessel grafts and meniscus substitutes [11–13]. An intrinsic limitation of BC for tissue engineering is the ~ 0.02 to 10 µm pore size of the fibril network, which is poorly matched to the physical dimensions of mammalian cells, and limits cell penetration and migration during cultivation. Several approaches have been used to address this limitation, including the incorporation of paraffin wax particles as a porogen into BC during the fermentation of A. xylinum [14–16]. Paraffin wax particles are introduced into the BC scaffold during growth and removed later. Some challenges associated with this technique include controlling the size of pores due to the diameter and poly-dispersity of available wax particles, removing wax from the BC matrix to reveal the porous scaffold and controlling the size and shape of BC layers.
A. xylinum is a strict aerobe and only produces cellulose in aerobic environments [17]. Previous studies have shown that during the formation of a cellulose pellicle in a liquid culture under static conditions, cells move upward through the BC pellicle to the surface of the polysaccharide. The mechanism that guides the upward motion of cells is currently unknown [18]; however, it seems reasonable that it may be due to cells chemotaxing up a gradient in oxygen tension.
In this paper, we describe the fabrication of porous bacterial cellulose (pBC) scaffolds for in vitro cell culture by cultivating A. xylinum in the presence of agarose microparticles deposited on the surface of a growing BC pellicle. The percolating, upward growth and movement of A. xylinum cells through the pellicle to the moist, nutrientrich surface guides BC formation around the agarose porogen microparticles. By controlling the physical dimen-sions and monodispersity of the agarose microparticles using a microfluidic system, we demonstrate that the removal of cells followed by autoclaving to sterilize the polymer and melt the porogen reveals pBC layers that contain a uniform and interconnected pore structure which facilitates mammalian cell growth in three dimensions. To demonstrate the function of BC materials fabricated using this simple approach, we grew human P1 chondrocytes on pBC substrates and analyzed their viability, morphology, attachment and 3-D distribution in pBC scaffolds after 1, 7 and 14 days of growth.
2. Materials and methods
2.1. Preparation of agarose microparticles using microfluidics
Monodisperse agarose microparticles with a diameter ranging from 300 to 500 µm were prepared using a controlled emulsion technique [19]. As illustrated in Fig. 1A, mineral oil was dispensed from a 50 ml syringe connected to poly(vinyl chloride) (PVC) tubing (inner diameter (ID): 0.035 inches; outer diameter (OD): 0.103 inches). A 25 ml syringe containing a warm solution (80˚ LC) of agarose (2% w/v) was connected to a 30-gauge needle that was inserted through the wall of the PVC tubing. The tip of the needle was positioned at the center of the PVC tubing. The syringes were connected to Harvard syringe pumps (PHD 22/2000) and the flow rates of mineral oil and warm agarose were controlled by adjusting the speed of the pumps; typical rates of flow varied between 1 and 5 ml min −1. As warm agarose exits through the needle into the flowing mineral oil, droplets are sheared off, flow through the PVC tubing and collect in a beaker immersed in an ice bath where the agarose droplets gel. Agarose microparticles were collected, rinsed with water to remove the mineral oil completely and lyophilized.
Fig. 1.
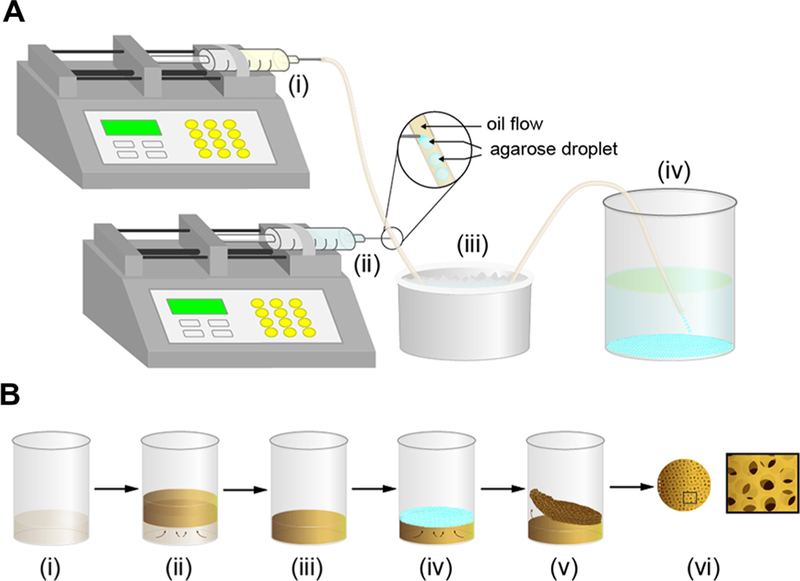
Schematic illustration depicting the preparation of agarose microparticles and pBC scaffolds. (A) (i) Syringe pump with a 50 ml syringe connected to PVC tubing dispenses mineral oil. (ii) Syringe pump with a 25 ml syringe connected to a 30-gauge needle is inserted through the wall of the PVC tubing and injects a warm solution of agarose that is broken off into droplets suspended in the mineral oil. (iii) Ice bath for gelling agarose droplets into microparticles. (iv) 500 ml beaker containing 250 ml water collects agarose microparticles. (B) (i) A culture of A. xylinum incubated in 50 ml or 250 ml beakers containing H&S broth. (ii) BC pellicle forms at the air–liquid interface after 5 days of growth. (iii) Excess H&S liquid broth is removed. (iv) Agarose microparticles are spread on the surface of the BC pellicle. (v) After 2 days of incubation, the pBC layer is peeled off the BC pellicle. (vi) Removing the agarose poragens reveals the pBC scaffolds. Left image is a top-down view of a pBC substrate. Right image is a cartoon of a pBC substrate at high magnification.
2.2. Characterization of the size and morphology of agarose microparticles using optical microscopy
To measure the size and morphology of agarose microparticles, we used optical microscopy. Lyophilized agarose microparticles were hydrated by suspending them in water for 3 h or 3 days, a droplet of a suspension of rehydrated microparticles was placed on a glass cover slip, the microparticles were imaged using a Nikon Eclipse 80i upright microscope (Nikon Instrument Inc.) with a 4 objective and microparticles dimensions were determined using ImageJ.
2.3. Fabrication of pBC
A. xylinum ATCC 53582 was streaked on agar plates, single colonies were picked and colonies were grown in Hestrin & Shramm broth (H&S; 2% (w/v) glucose, 0.5% (w/v) peptone, 0.5% (w/v) yeast extract, 0.27% (w/v) Na2HPO4, and 0.15% (w/v) citric acid, pH 5.0). After culturing cells for 2 days at 30˚ LC under static conditions, we transferred an aliquot of cells into 50 ml or 250 ml beakers containing 20 ml or 50 ml of H&S broth, respectively (the ratio of culture to H&S broth was 1:10) and incubated for 5 days at 30˚ LC. During growth, BC pellicles formed at the air/water interface, as shown in Fig. 1B. Aseptically decanting the liquid culture broth left BC substrates positioned at the bottom of the beakers. We spread unmodified agarose powder (Grainger) or lyophilized agarose microparticles fabricated using the microfluidic approach on the surface of the approximately circular BC substrates (~40 mm in diameter and 7 mm thick for pellicles grown in a 50 ml beaker or 70 mm in diameter and 7 mm thick for pellicles grown in a 250 ml beaker). The beakers were incubated in a 30˚ LC incubator for 2 days and then removed from the flasks. As the porogen-infused layer and the BC ‘‘seed’’ substrate were not physically attached together, it was easy to separate them. We treated the porogen-containing BC layer with 1% NaOH, incubated for 30˚ min at 100 LC to lyse cells then autoclaved to melt the agarose micro-particles within the pBC substrates. After autoclaving – when the pBC substrates were hot – we removed excess microparticles and powder from scaffolds by rinsing them with warm water. To ensure that the pBC substrates were sterile, we autoclaved them one more time and stored them in a sterile environment for future experiments.
2.4. Scanning electron microscopy (SEM) analysis of pBC substrates
The architecture of the porous BC scaffolds was determined by imaging with a LEO 1530 scanning electron microscope operating at 10 kV. To prepare samples, pBC scaffolds were quenched in liquid nitrogen, incubated in a 80˚ LC freezer overnight and lyophilized for 1 day. Samples were mounted on cover slips attached to SEM specimen stubs using carbon tabs, sputtered with gold, and imaged.
2.5. Mechanical properties of pBC scaffolds
The tensile strength of pBC scaffolds was tested after removing the porogen completely. Samples were cut into sections that were 20 mm wide× 70 mm long using a scalpel and mounted in an Instron 5566 tensile tester equipped with a 10 N load cell. For each sample, we measured the mechanical properties of three duplicate scaffolds by elongating them at a constant rate of 5 mm min −1 until fracture. As a control, we measured the mechanical properties of BC substrates grown for 2 days without adding the agarose porogen.
2.6. Chondrocyte cell culture and growth on pBC substrates
Human P1 chondrocytes from the Wisconsin Institute for Medical Research were cultured in Dulbecco’s modified Eagle’s medium (DMEM) nutrient medium F12 (Invitrogen) containing 10% fetal bovine serum (FBS; Invitrogen) and 100 units ml 1 of penicillin/streptomycin solution (Invitrogen). pBC scaffolds grown in 50 ml flasks were retrieved after growth and placed within a circular polydimethylsiloxane (PDMS) jig (ID = 20 mm; OD = 30 mm) that was fabricated by thermally curing liquid PDMS precursor (Dow Corning Sylgard 184 silicone elastomer kit; 10:1 ratio of base:curing agent) in a circular mold. We inserted a PDMS jig (ID = 16 mm; OD = 20 mm) into the larger jig to hold the pBC scaf-folds in place, as described previously [16]. The PDMS jigs formed a ‘‘clamp’’ that made it easy to manipulate pBC substrates for autoclaving.
As a control, we grew BC for 2 days in a 50 ml flask in the absence of agarose microparticles. We mounted BC substrates in the PDMS clamp described above, rinsed with water and auto-claved. After cooling, scaffolds were placed in individual wells of 6-well culture plates, each scaffold was overlaid with 2 ml of DMEM nutrient medium F12 and plates were incubated for 1 h at 37˚ LC. Cultured chondrocytes were rinsed with PBS two times and incubated with trypsin/ethylenediaminetetraacetic acid for 2 min at 37˚ LC to detach cells from the surface of the culture flask. We seeded 600 µl of a suspension of 5 104 cells ml 1 on each scaffold, then immediately added 2 ml of growth medium on top of the substrates. 24 h later, growth medium was replaced with differentiation medium consisting of 2.5 ml of DMEM nutrient F12 (Invitrogen) containing 1 ITS + liquid supplement medium (Sigma–Aldrich), linoleic acid (5.0 µg ml 1; Sigma–Aldrich), human serum albumin (1.0 µg ml 1; Sigma Aldrich), TGF-b1 (10 ng ml 1; Sigma–Aldrich), dexamethasone (0.1 µM; Sigma– Aldrich), ascorbic acid (14 µg ml 1; Sigma–Aldrich) and 100 units ml 1 of penicillin–streptomycin (Life Technologies). The scaffolds were incubated for 1 day, 7 days and 14 days at 37˚ LC in 5% CO2 and 99% relative humidity. Every 3 days, we removed the differentiation medium and replaced it with fresh liquid medium.
2.7. Determining chondrocyte cell viability and cell number
We determined chondrocyte cell viability during growth on porous scaffolds using a LIVE/DEAD® viability/cytotoxicity assay. After cell cultivation for 1 day, 7 days and 14 days, we rinsed scaffolds twice with tissue culture grade Dulbecco’s phosphate buffered saline (DPBS). We added 500 µl of the combined LIVE/ DEAD assay reagents (4 µM of EthD-1 and 2 µM of calcein AM in DPBS) to the scaffold surfaces such that all cells were covered with the solution, incubated for 45 min at 25˚ LC and imaged the labeled cells using a Nikon Eclipse TE2000 inverted fluorescence microscope (Nikon Instrument Inc.) at a 10 × objective. Viable cells labeled with calcein AM were detected at an excitation wavelength of 494 nm and an emission wavelength of 517 nm. Dead cells labeled with EthD-1 were detected at an excitation wavelength of 528 nm and an emission wavelength of 617 nm. Cell viability and the total percentage of viable cells were determined by counting live and dead cells ( 2000 cells) for each growth condition. We measured the number of chondrocytes proliferating in pBC scaffolds for 1 day, 7 days and 14 days using the alamar blue assay kit (Invitrogen). Cell-laden pBC scaffolds were washed twice with PBS, incubated with alamar blue solution for 5 h at 37˚ LC and fluorescence was measured at absorbance wavelengths of 570 and 600 nm. To compare the differences between cell viability and number of chondrocytes on BC and pBC-M, we performed chi-squared tests. We considered a P-value <0.05 to indicate statisti-cally significant data.
2.8. Imaging chondrocytes in/on porous BC scaffolds using confocal microscopy and SEM
Confocal microscopy was utilized to study the cell morphology and the depth of cell penetration into BC substrates. Scaffolds seeded with chondrocyte cells were harvested, rinsed with PBS and placed in an aqueous solution of 4% formaldehyde for >3 h. The fixed cell-laden scaffolds were labeled with rhodamine phalloidin (Life Technologies) and 4`,6-diamidino-2-phenylindole (DAPI; Life Technologies) to visualize cell actin filaments and nuclei, respectively. The labeled samples were stored in PBS and analyzed with a Nikon C1 laser scanning confocal microscope using a 40 × oil immersion objective. Cell adhesion on scaffolds was imaged using SEM. Porous BC substrates containing chondrocytes were washed with DPBS twice and fixed with 4% formaldehyde for >3 h. The substrates were washed with DPBS, dehydrated in 50–100% ethanol and dried in hexamethyldisilazane. Samples were mounted on SEM stubs, sputter-coated with gold and imaged using SEM (LEO 1530).
3. Results
3.1. Characterization of agarose microparticles
Agarose is a polysaccharide extracted from red algae and consists of 1,3-linked β-galactopyranose and 4-linked 3,6-anhy-dro-α-L-galactopyranose. Agarose forms heat-reversible hydrogels with properties (physical and chemical stability, biocompatibility, neutral charge and hydrophilicity) that are useful in a wide range of biologically oriented applications, including biomolecule separa-tion and microencapsulation.
Commercial agarose powder is manufactured using a range of different methods, including spray drying, suspension gelation and membrane emulsification and is generally polydisperse [20,21]. To create agarose microparticles, we used a fluidic system that is similar to an approach described for interfacial polymeriza-tions in liquid prepolymer droplets [19]. We flowed mineral oil through a segment of PVC tubing (inner diameter: ~ 0.9 mm) that functioned as the continuous phase for agarose microparticles fab-rication. We inserted a 30-gauge needle through the wall of the PVC tubing and positioned the tip of the needle in the center of the tubing. The needle was connected to a syringe containing a warm solution (80 ˚C) of agarose (2% w/v). Controlling the flow rates of agarose and mineral oil enabled us to control the diameter of the agarose droplets that were sheared off by the flow of oil. Liquids flowed out the PVC tubing into a beaker immersed in an ice water bath, and the agarose droplets gelled and formed particles. Agarose microparticles were collected, rinsed with water to remove mineral oil, lyophilized and stored in this state until they were rehydrated for pBC fabrication experiments.
Agarose microparticles prepared using a variety of flow rates of oil and agarose solution had a range of diameters summarized in Table 1. Changing the flow rate of the agarose solution from 1 to 5 ml min 1 under a constant flow rate of mineral oil (1 ml min 1) yielded microparticles with low coefficients of variation (CVs) and diameters that ranged from 608 to 1200 lm. Smaller diameters can be achieved using alternative microfluidic systems [22].Our goal was to create agarose microparticles with diameters in the range of 300 to 500 µm and use them as a porogen to create pBC substrates for mammalian cell culture; removing the porogen would reveal pores large enough that cells can migrate into the polymer, attach, replicate and form tissue-like structures. We assumed that decreasing the flow rate of the agarose solution below 0.1 ml min 1 would yield agarose microparticles with this desired range of diameters. Unfortunately, the 30-gauge needle and tubing frequently clogged when we decreased the flow rate of agarose solution to 0.1 and 0.2 ml min 1, which may be due to the narrow diameter of the needle and the low setting temperature of agarose (~ 37 ˚C). Preventing unwanted agarose gelation was challenging at low flow rates.
Table 1.
Dimensions of agarose microparticles formed from different flow rates of mineral oil and agarose.
| Oil flow rate (mL/min) | Agarose solution flow | Diameter of hydrated | Diameter of lyophilized | Diameter of rehydrated | Diameter of rehydrated |
|---|---|---|---|---|---|
| rate (mL/min) | particles (µm) | particles (µm) | particles after 3 h (µm) | particles after 3 d (µm) | |
| 1 | 0.1 | 608 (9.0%) | 550 (6.9%) | 542 (8.1%) | 537 (10.3%) |
| 1 | 0.2 | 813 (3.1%) | 774 (7.4%) | 748 (8.7%) | 720 (10.2%) |
| 1 | 0.3 | 985 (8.0%) | 832 (8.4%) | 810 (11.6%) | 813 (8.3%) |
| 1 | 0.4 | 1177 (4.4%) | 947 (10.9%) | 1002 (10.9%) | 1034 (9.1%) |
| 1 | 0.5 | 1259 (4.6%) | 104 (5.7%) | 1102 (7.9%) | 1167 (6.3%) |
| 2 | 0.3 | 624 (1.1%) | 485 (11.4%) | 470 (7.1%) | 456 (7.4%) |
| 3 | 0.3 | 549 (1.3%) | 437 (6.8%) | 421 (5.0%) | 416 (5.3%) |
| 4 | 0.3 | 496 (2.4%) | 403 (6.3%) | 375 (7.4%) | 370 (5.9%) |
| 5 | 0.3 | 454 (2.0%) | 361 (6.6%) | 347 (6.6%) | 337 (6.0%) |
Based on the challenges we encountered at low flow rates, we instead reduced the particle diameter by changing the flow rate of the agarose solution to 0.3 ml min 1 and increasing the oil flow rate from 2 to 5 ml min 1. As summarized in Table 1, the size of agarose microparticles produced using this approach – after washing, lyophilization and storage and rehydration – decreased to 300–500 lm and had a CV that ranged from 5.0% to 11%. We found that agarose microparticles with optimal physical properties (diameter, CV) were created using flow rates of 3 ml min 1 for mineral oil and 0.3 ml min 1 for the agarose solution. Microparticles created using these flow conditions are displayed in Fig. 2 and were used as a porogen for all of the pBC experiments described in this paper.
Fig. 2.
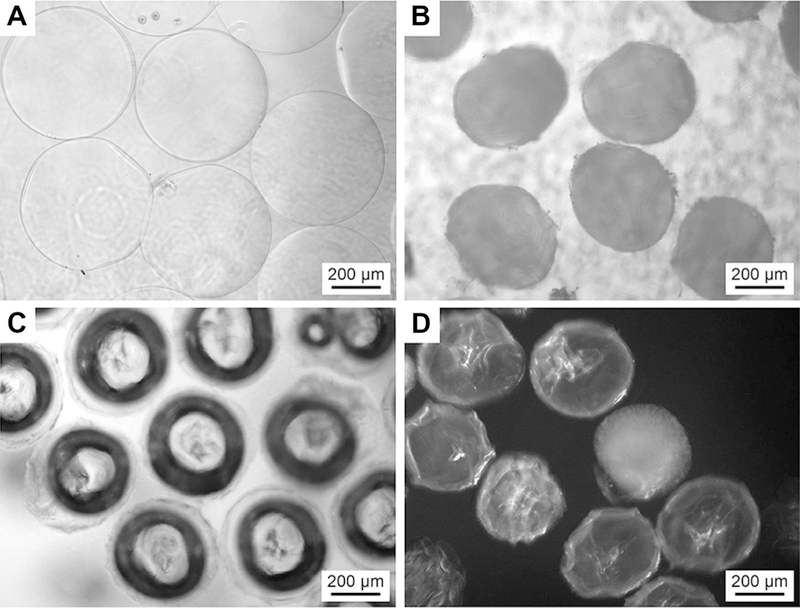
The morphology of agarose microparticles formed with oil flow rate of 3 ml min −1 and agarose solution flow rate of 0.3 ml min −1. (A) An image of droplets of warm agarose formed using the microfluidic technique. (B) An image of lyophilized agarose microparticles. (C) An image of rehydrated agarose microparticles after rehydration in water for 3 h. (D) An image of rehydrated agarose microparticles after rehydration in water for 3 days. All images were acquired on a phase contrast optical microscope.
3.2. Fabrication and characterization of pBC using agarose microsparticles as a porogen
To create pBC layers, we cultivated A. xylinum in liquid broth under static conditions and grew pellicles of BC at the air/liquid interface. We removed the excess liquid culture medium, sprinkled a ~1 mm thick layer of agarose microparticles on the BC surface and added a layer of culture medium on top of the particles. We used one of two different types of agarose particles for experiments: (1) agarose micro particles formed using our microfluidic system with a diameter of 300–500 µm and a CV of 5.0–11%; and commercial agarose powder, which consists of particles with a diameter of 50–250 µm and a CV of 34%. After growth for 2 days, we removed pellicles, separated the pBC layer, rinsed and auto-claved. As the BC and pBC layers are not physically attached, the layers were separated easily.
We characterized the porosity of the BC and pBC scaffolds fabricated using agarose powder (pBC-P) and agarose microparticles (pBC-M) using SEM (Fig. 3). Layers of BC that were created in the absence of porogen displayed a dense network of nanofibrous BC, which resists cell penetration and prohibits cells from establishing cell–cell contact in three dimensions. In contrast, we observed that pBC-P had pores with diameters that ranged from 50 to 250 lm. The range of pore sizes is likely due to the polydispersity and irregularity of the shape of agarose particles in commercial powder samples, which are produced using spray-drying techniques. When agarose microparticles were used as a porogen to fabricate pBC-M, we observed uniform pores (with a diameter ranging from 300 to 500µm) and a continuous, interconnected porous network in the substrate. To confirm that the porous structure was uniformly distributed throughout the entire pBC-M scaffold, we cross-sectioned samples and imaged their structure using SEM. As displayed in Fig. 3, pBC-M had a homogeneous pore architecture, in which the pore size was uniform throughout the substrate. By comparison, cross-sectional analysis of pBC-P displayed a range of pore sizes and a heterogenous distribution in which the diameters of the pores close to the top surface of the BC substrate were larger than pores positioned close to the bottom surface.
Fig. 3.
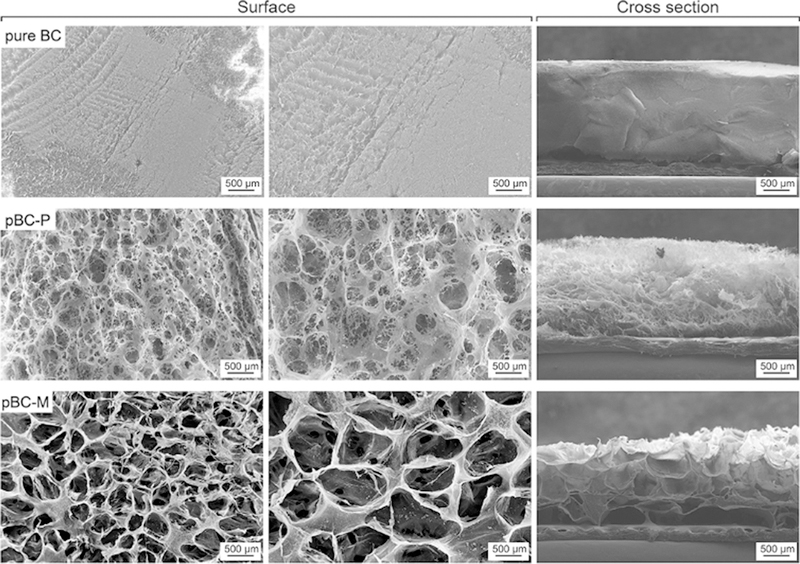
SEM images of BC, pBC-P and pBC-M scaffolds. The first column of images depicts the porosity of the surface of each scaffold. The second column shows the surface of each scaffold at higher magnification. The third column illustrates the porosity throughout each scaffold, which was imaged after cross-sectioning each substrate.
3.3. Analysis of the pBC mechanical properties
To characterize the mechanical characteristic of pBC scaffolds, we determined the Young’s modulus by measuring the stress– strain curve of pure BC, pBC-P and pBC-M scaffolds (Fig. 4). The values of stress at break, strain at break and Young’s modulus of the samples are listed in Table 2. As expected, pure BC has a higher Young’s modulus (14.7 MPa) and stress at break (2.4 MPa) com-pared to pBC-P scaffolds (Young’s modulus of 8.2 MPa; stress at break of 0.61 MPa) and pBC-M (Young’s modulus of 5.4 MPa; stress at break of 0.52 MPa). As the pore size in the pBC scaffold increases, the substrate more rapidly reached the break point during uniaxial elongation. The Young’s modulus value of 5.4 MPa for pBC-M is within the range of mechanical properties that are reported to be suitable for growing materials for cartilage repair in non-load-bearing sites [23].
Fig. 4.
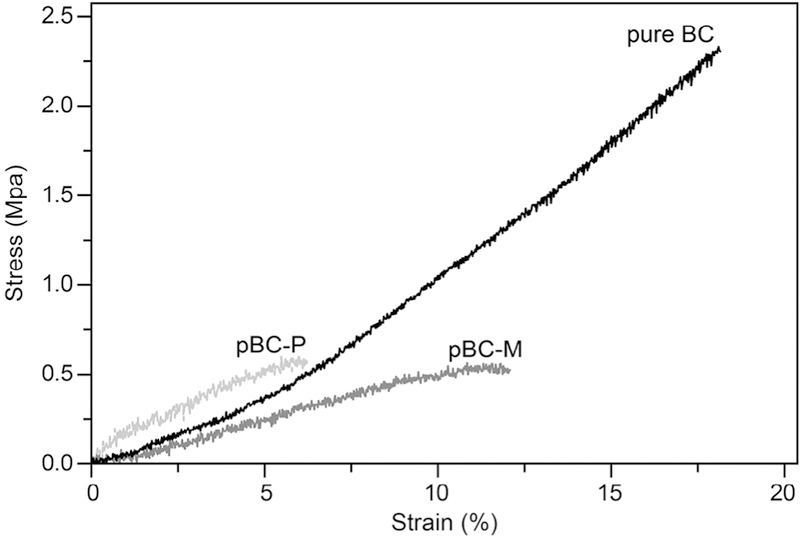
Tensile stress–strain curves of BC, pBC-P and pBC-M. Each curve ends at a different value of strain, which corresponded to the breaking point. Each curve is a fit of the mean stress data at each strain.
Table 2.
Tensile test data of BC, pBC-P and pBC-M.
| Sample | Stress at break | Strain at break (%) | Young’s modulus |
|---|---|---|---|
| (MPa) | (MPa) | ||
| Pure BC | 2.4 (±0.5) | 18.0 (±4.3) | 14.7 (±4.3) |
| pBC-P | 0.61 (±0.1) | 5.9 (±2.9) | 8.2 (±1.3) |
| pBC-M | 0.52 (±0.09) | 11.8 (±3.2) | 5.4 (±2.5) |
3.4. Chondrocyte cell proliferation and viability on pBC scaffolds
To investigate the feasibility of using pBC scaffolds in cartilage tissue engineering applications, we seeded human P1 chondrocytes on pBC-M samples and quantified their viability during long-term cultivation (Fig. 5A) using epifluorescence microscopy and a LIVE/DEAD® assay. Chondrocyte cells invaded pBC scaffolds and dispersed throughout the porous polymer (Fig. 5A). When seeded on BC substrates, chondrocytes grew only on the surface; cells were unable to penetrate into the polymer, presumably because the average pore size of the network (~ 0.02–10 µm) is smaller than the physical dimensions of cells. Based on an analysis of microscopy data (Fig. 5B), chondrocytes grown on pBC sub-strates displayed a higher viability (85% to 99%) over 14 days of culture compared to cells cultured on pure BC. These results suggest that the introduction of a porous network with a pore size of 300–500 lm enabled chondrocytes to penetrate into scaffolds, migrate and proliferate, which increased cell viability.
Fig. 5.
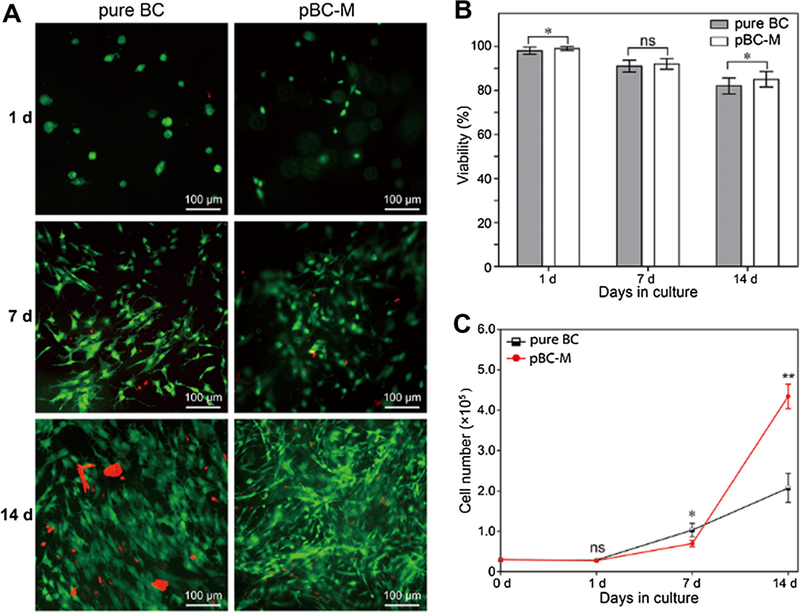
Analysis of chondrocyte cell viability on porous BC scaffolds. (A) Live/dead fluorescence labeling of chondrocytes. (B) Viability of seeded chondrocytes in pure BC and pBC-M with the cultivation of 1, 7 and 14 days. (C) Number of chondrocytes after proliferation on pure BC and pBC-M after 1, 7 and 14 days of cultivation. To assess differences between cell viability and number of chondrocytes on BC and pBC-M, we performed chi-squared tests. All tests were two-sided and statistical significance was considered when a P-value <0.05 was observed. ns, non-significant; *P < 0.05; **P < 0.01; ***P < 0.001.
We seeded the surface of substrates with an identical number of chondrocytes and used an alamar blue assay (in which viable cells convert resazurin to resorufin) to quantify the number of cells on BC and pBC-M scaffolds over 14 days (Fig. 5C). After 1 week, the number of chondrocytes seeded on unmodified BC was larger than the number of cells on pBC-M. Between 7 and 14 days, however, the number of cells on pBC-M scaffolds increased substantially relative to pure BC. The results suggest that pBC scaffolds containing a continuous-porous structure improved long-term cell proliferation and growth.
3.5. Cell morphology on pBC scaffolds
We studied the morphology of chondrocytes seeded on pure BC and pBC-M for 1, 7 and 14 days using confocal microscopy (Fig. 6). After culture for 1 day, the majority of cells on pure BC scaffolds displayed a round shape, while cells grown within pBC-M scaffolds formed cell body extensions, indicating that they were spreading. After 7 days of cultivation on BC, the majority of the chondrocytes had spread; the remaining cells had a round morphology. At the same time interval after seeding cells on pBC-M scaffolds, chondrocytes displayed a characteristic spindle shape that indicated they had attached to the BC fibers and spread in three dimensions along the fiber network. After 14 days of growth on pure BC scaffolds, chondrocytes developed extensions that overlapped partially with those on adjacent cells. In comparison, after 14 days cells in the pBC-M scaffold were distributed throughout the porous material and displayed a stretched morphology, indicating their attachment and spreading within the pBC-M scaffold. We observed extended cells in the pores and also on the BC surface around the pores. We did not observe the outgrowth of chondrocytes from the porous scaffold and their subsequent proliferation on the surface of tissue culture flask – in which the pBC substrate was incubated – during our long-term growth experiments.
Fig. 6.
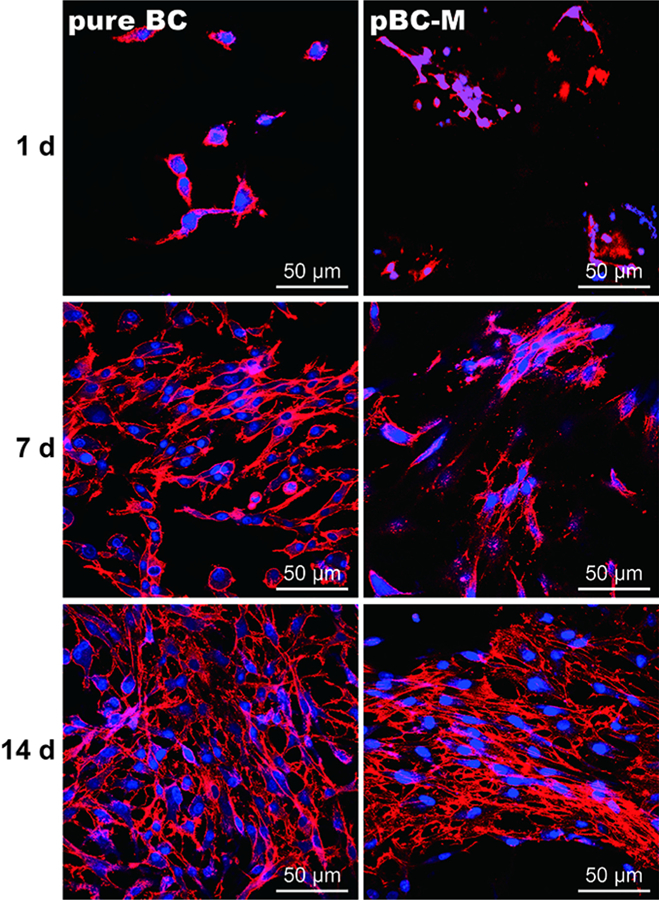
Fluorescence micrographs of chondrocytes cultivated on pure BC and pBC-M scaffolds after 1, 7 and 14 days. Actin filaments were labeled with rhodamine phalloidin and detected at an excitation wavelength of 632 nm and an emission wavelength 590 nm using epifluorescence microscopy. Cell nuclei were labeled with DAPI (blue) and detected at an excitation wavelength of 488 nm and an emission wavelength of 515 nm using epifluorescence microscopy.
3.6. Cell adhesion on BC scaffolds
We further characterized the adhesion of cells on BC scaffolds by SEM. The dense network of fibers and small pore size of pure BC scaffolds directed cell growth to the surface (Fig. 7). In contrast, SEM analysis illustrated that chondrocyte cells were inside the porous network and on the surface of pBC-M scaffolds. The majority of cells grown on pBC-M had a ‘‘stretched’’ phenotype within the network of the pores produced by the agarose porogen, while other cells penetrated into smaller pores characteristic of the BC nanofibers matrix. Overall, cells attached to uneven and porous areas of pBC scaffolds, which led to invasion of the polymer network.
Fig. 7.
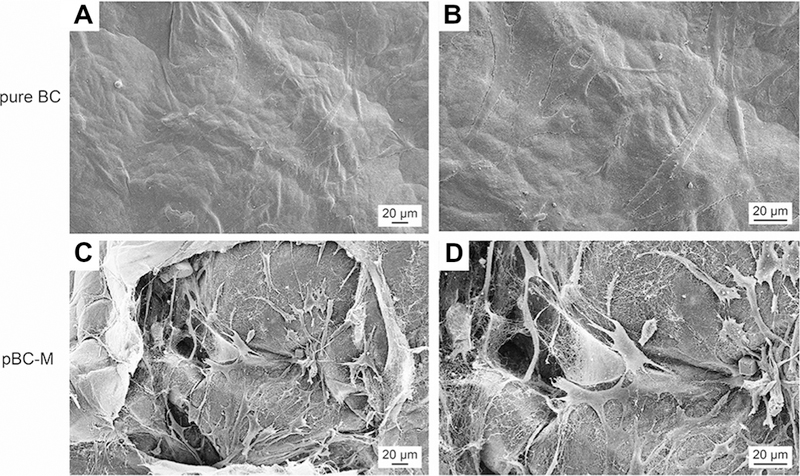
Chondrocyte cell adhesion on BC and pBC-M scaffolds after cultivation for 14 days. (A) Chondrocytes attached to the surface of pure BC scaffold. (B) Higher magnification images based on image in (A). (C) Cells spread around or in the pores of pBC-M scaffolds after seeding. (D) A higher magnification image of a region in (C).
3.7. Cell distribution in pBC scaffolds
We determined the spatial distribution of chondrocytes and their depth of penetration after 14 days of cultivation on pBC using confocal microscopy. Chondrocytes seeded on pBC scaffolds displayed a 3-D distribution extending throughout the porous BC network. In contrast, a single layer of chondrocytes on pure BC substrates had dispersed and proliferated after 14 days, and were confined to the top surface of the gel (Fig. 8). The results suggest that pBC-M scaffolds fabricated using agarose microparticles as a porogen enabled cells to penetrate and migrate into BC, which may facilitate mechanical and chemical cues that stimulate replication, migration and cell–cell interactions critical to form tissue-like materials for cartilage repair [24,25].
Fig. 8.
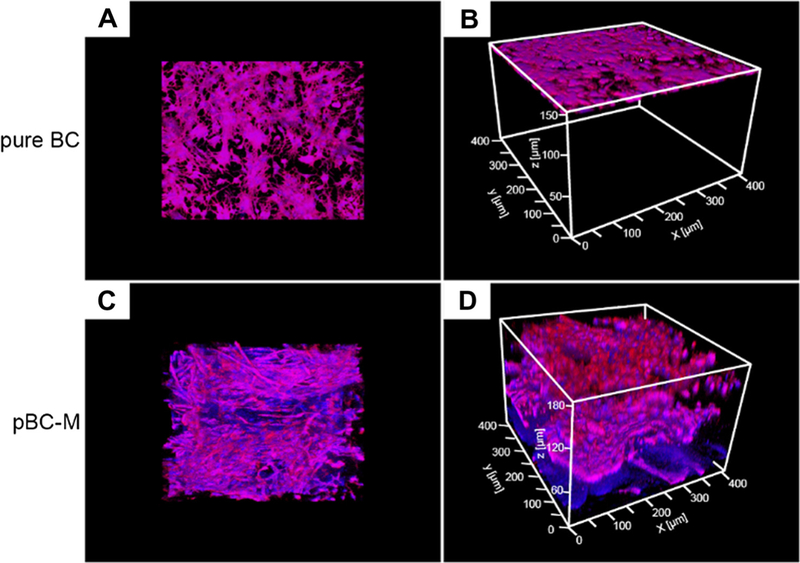
Distribution of chondrocyte cells seeded on BC and pBC-M scaffolds after 14 days. (A) Top-down view and (B) oblique view of fluorescence micrographs of chondrocytes seeded on BC and incubated for 14 days. (C) Top-down view and (D) oblique view of cells seeded on pBC-M substrates and cultivated for 14 days. Images were acquired on a laser scanning confocal microscopy and analyzed using ImageJ.
4. Discussion
Mammalian cells are unable to penetrate and grow within the dense nanofibrous network of BC secreted by A. xylinum, which reduces its application as a material for tissue engineering [26]. Increasing the porosity of the BC network facilitates cell penetra-tion into the scaffold, provides a physical environment that more accurately recapitulates the native cellular niche and enhances nutrient and oxygen transport for cells growing in three dimen-sions. One approach to increasing BC porosity is to incorporate wax poragens and then remove them prior to seeding substrates with cells [14,27]. A major challenge of the wax-based technique is controlling BC pore size, as wax particles are not available with well-defined physical dimensions and their fabrication poses tech-nical challenges. To address this limitation, we explored agarose as a porogen, as methods have been described for fabricating agarose microparticles with user-defined dimensions and a low CV [22]. Agarose is inexpensive and widely used in biological labs and the polymer is easily removed by melting. Using a microfluidic tech-nique that is simple, easy to perform and was designed for fabricating colloids in bulk, we created agarose microparticles with a diameter ranging from 300 to 500 lm and a low CV; below a diameter of 500 µm, batches of agarose microparticles had a CV of <8%. We sterilized and lyophilized microparticles and spread them on the surface of growing pellicles of BC produced by A. xylinum; applying dry agarose microparticles made them easier to manipu-late and spread evenly on the BC surface. Evenly spreading lyophilized agarose microparticles on the BC surface enabled us to create pBC layers with a continuous, interconnected network of uniform pores (with a diameter ranging from 300 to 500 µm).
Layering agarose microparticles on a wet BC pellicle worked very well for creating pBC, as the water hydrated the porogen and the growth of cells and their percolation up through the BC layer encapsulated the porogen with polymer. This approach of incorporating materials into growing BC pellicles is unprecedented. 2 days after layering the agarose microparticles, we collected the porogen-infused BC layer. Removing wax porogens encapsulated in a BC network is very challenging [26]. We found that autoclaving the BC substrates and rinsing them with warm water removed agarose microparticles completely. Our observa-tion of pBC-M scaffolds using SEM indicated that autoclaving removed agarose microparticles entirely. In contrast to previous studies with wax porogens, we were able to avoid using surfactants and solvents during the removal step, which simplified the process and reduced the negative impact of these reagents on the porous BC structure.
We imaged the surface of pBC-M scaffolds and cross-sections of these materials using SEM and observed a homogeneous pore architecture throughout the scaffold. Our hypothesis is that oxygen penetrates into liquid growth medium during pBC fabrication and the ensuing gradient of oxygen stimulates the migration of A. xylinum cells upward in the pellicle to secrete BC around the agarose microparticles. The shape of the oxygen gradient likely influences the thickness of pBC-M layers. An unmet challenge in our system is to provide user control over the thickness of pBC-M layers. One solution is to design a dynamic oxygen-supply bioreactor that increases the concentration of oxygen deep in polymer layers.
Even though increased pore size facilitates cell growth within the polymer network, larger pore sizes reduce the mechanical properties of the material, which compromises the structural integrity of the scaffold. The pore size of pBC-P and pBC-M scaffolds increased after porogens were removed (compared to the material incorporating the porogen particles), which spontaneously decreased the Young’s modulus and stress at break.
We plated a constant number of chondrocytes on scaffolds with a similar diameter and found a consistently larger number of cells growing on pBC-M scaffolds compared to those growing on pure BC. Results indicated that pBC with a pore diameter of 300– µm was beneficial for chondrocyte differentiation and proliferation. Using a LIVE/DEAD assay to assess chondrocyte viability, we observed that 78–84% of the cells grown on pure BC were still viable after 14 days. 82–88% of chondrocytes growing on pBC-M were viable after 14 days. In previous studies reported by Svensson et al., the number of chondrocytes on a high porosity BC network was lower than on pure BC after cultivation for 8 days [29]. These results are similar to our observations of proliferating chondrocytes on pure BC and pBC-M scaffolds grown for 7 days. Cells dispersed within the porous structure of pBC-M scaffolds and the cell density decreased significantly as the cells became distributed over a large volume compared to cells confined to growth on the surface of BC for which the cell density was high. The lower initial density of cells on pBC-M scaffolds may be responsible for the low number of cells that we observed after growth for 1 week; this hypothesis is supported by reports that a low density of cells is an important factor for prolonged growth [30,31].
Pores are a necessary element for the formation of cartilage as they enable the migration and proliferation of chondrocytes and the vascularization of tissue [32]. Porous surfaces can enhance the mechanical interface between implanted biomaterials and surrounding tissues by improving the mechanical properties and stability of the interface [33]. Biocompatible, porous polymer scaffolds have been implemented for cartilage tissue formation by providing critical mechanical cues, regulating nutrients and growth factor accessibility and facilitating cell migration [34,35]. The orientation, size and density of pores within polymer scaffolds provide the balance between spatial, mechanical and chemical cues for cells. We found that this relationship between scaffold structure and chondrocyte physiology extended to pBC-M scaf-folds. After 14 days of growth, cells displayed a 3-D distribution throughout the scaffolds and developed extensions that over-lapped partially with those on adjacent cells. The continuous-por-ous structure of pBC enabled cells to penetrate into the inner side and spread cells around the scaffold in the seeding process. During incubation, pores with a diameter ranging from 300 to 500 lm made it possible for chondrocytes to migrate and proliferate within the scaffolds, which was sufficient for the growth of cartilage scaffolds. Optimization of the seeding process may enable users to overcome the decrease in cell density with increasing depth into the polymer substrate.
5. Conclusion
The outstanding biocompatibility of BC enables a range of applications in different areas of medicine [13,28]. By introducing agarose microparticles into BC substrates as a poragen, we succeeded in fabricating pBC scaffold with interconnected pores with dimensions of 300–500 lm. The morphology of chondrocytes seeded on pBC-M scaffolds for 14 days was more pronounced than cells on pure BC at the same time point during growth; on BC some cells still displayed an undeveloped spindle-like morphology. Using SEM we found that cells seeded on pBC-M were distributed on the surface and attached within the pores. Confocal microscopy demonstrated that cells positioned around the pores on the surface of pBC-M scaffolds displayed a stretched morphology and the general trend was that the orientation of the morphology across the surface followed the arrangement of pores. The results from SEM and confocal microscopy suggest that cells have a preference for adhering to regions of pBC structures in which the pore size is 300 to 500 lm. Incorporating agarose microparticles provides a convenient approach for controlling the porosity of BC substrates for compatibility in different areas of tissue engineering.
Acknowledgements
We acknowledge support from the National Science Foundation (MCB-1120832, DMR-1121288), USDA (WIS01594), Fundamental Research Funds for the Central Universities (CUSF-DH-D-2013001) and the China Scholarship Council. The authors gratefully acknowledge use of facilities and instrumentation supported by the University of Wisconsin Materials Research Science and Engineering Center (DMR-1121288). We thank Andrew Handorf and Ngoc Nhi Le (Wisconsin Institutes for Medical Research) for P1 human chondrocytes, Sarah Gong (Wisconsin Institute for Discovery) for use of the Instron tester and Rishi Trivedi, John Crooks and Piercen Oliver for advice.
Appendix A. Figures with essential colour discrimination
Certain figures in this article, particularly Figs. 1, 5, 6 and 8 are difficult to interpret in black and white. The full colour images can be found in the online version, at http://dx.doi.org/10.1016/ j.actbio.2014.10.019.
References
- [1].Hwang N, Varghese S, Elisseeff J. Cartilage tissue engineering. In: Vemuri M, editor. Stem cell assays New York: Humana Press; 2007. p. 351–73. [Google Scholar]
- [2].Hutmacher DW. Scaffolds in tissue engineering bone and cartilage. Biomaterials 2000;21:2529–43. [DOI] [PubMed] [Google Scholar]
- [3].Palsson BO, Bhatia SN. Tissue engineering London: Pearson Education; 2004. [Google Scholar]
- [4].Deng HW, Liu YZ. Current topics in bone biology Hackensack, NJ: World Scientific; 2005. [Google Scholar]
- [5].Salgado AJ, Coutinho OP, Reis RL. Bone tissue engineering: state of the art and future trends. Macromol Biosci 2004;4:743–65. [DOI] [PubMed] [Google Scholar]
- [6].Eisenbarth E Biomaterials for tissue engineering. Adv Eng Mater 2007;9:1051–60. [Google Scholar]
- [7].Place ES, Evans ND, Stevens MM. Complexity in biomaterials for tissue engineering. Nat Mater 2009;8:457–70. [DOI] [PubMed] [Google Scholar]
- [8].Karageorgiou V, Kaplan D. Porosity of 3D biomaterial scaffolds and osteogenesis. Biomaterials 2005;26:5474–91. [DOI] [PubMed] [Google Scholar]
- [9].Cannon RE, Anderson SM. Biogenesis of bacterial cellulose. Crit Rev Microbiol 1991;17:435–47. [DOI] [PubMed] [Google Scholar]
- [10].Iguchi M, Yamanaka S, Budhiono A. Bacterial cellulose—a masterpiece of nature’s arts. J Mater Sci 2000;35:261–70. [Google Scholar]
- [11].Bodin A, Concaro S, Brittberg M, Gatenholm P. Bacterial cellulose as a potential meniscus implant. J Tissue Eng Regen Med 2007;1:406–8. [DOI] [PubMed] [Google Scholar]
- [12].Klemm D, Schumann D, Udhardt U, Marsch S. Bacterial synthesized cellulose — artificial blood vessels for microsurgery. Prog Poly Sci 2001;26:1561–603. [Google Scholar]
- [13].Petersen N, Gatenholm P. Bacterial cellulose-based materials and medical devices: current state and perspectives. Appl Microbiol Biotechnol 2011;91:1277–86. [DOI] [PubMed] [Google Scholar]
- [14].Andersson J, Stenhamre H, Bäckdahl H, Gatenholm P. Behavior of human chondrocytes in engineered porous bacterial cellulose scaffolds. J Biomed Mater Res A 2010;94A:1124–32. [DOI] [PubMed] [Google Scholar]
- [15].Uraki Y, Nemoto J, Otsuka H, Tamai Y, Sugiyama J, Kishimoto T, et al. Honeycomb-like architecture produced by living bacteria GluconAcetobacter xylinus. Carbohydr Polym 2007;69:1–6. [Google Scholar]
- [16].Zaborowska M, Bodin A, Bäckdahl H, Popp J, Goldstein A, Gatenholm P. Microporous bacterial cellulose as a potential scaffold for bone regeneration. Acta Biomater 2010;6:2540–7. [DOI] [PubMed] [Google Scholar]
- [17].Williams WS, Cannon RE. Alternative environmental roles for cellulose produced by Acetobacter xylinum. Appl Environ Microbiol 1989;55:2448–52. [DOI] [PMC free article] [PubMed] [Google Scholar]
- [18].Schramm M, Hestrin S. Factors affecting production of cellulose at the air/ liquid interface of a culture of Acetobacter xylinum. J Gen Appl Microbiol 1954;11:123–9. [DOI] [PubMed] [Google Scholar]
- [19].Quevedo E, Steinbacher J, McQuade DT. Interfacial polymerization within a simplified microfluidic device: capturing capsules. J Am Chem Soc 2005;127:10498–9. [DOI] [PubMed] [Google Scholar]
- [20].Zhao X, Wu J, Gong FL, Cui JM, Janson JC, Ma GH, et al. Preparation of uniform and large sized agarose microspheres by an improved membrane emulsification technique. Powder Technol 2014;253:444–52. [Google Scholar]
- [21].Ioannidis N, Bowen J, Pacek A, Zhang Z. Manufacturing of agarose-based chromatographic adsorbents – effect of ionic strength and cooling conditions on particle structure and mechanical strength. J Colloid Interface Sci 2012;367:153–60. [DOI] [PubMed] [Google Scholar]
- [22].Eun YJ, Utada AS, Copeland MF, Takeuchi S, Weibel DB. Encapsulating bacteria in agarose microparticles using microfluidics for high-throughput cell analysis and isolation. ACS Chem Biol 2010;6:260–6. [DOI] [PMC free article] [PubMed] [Google Scholar]
- [23].Engler AJ, Sen S, Sweeney HL, Discher DE. Matrix elasticity directs stem cell lineage specification. Cell 2006;126:677–89. [DOI] [PubMed] [Google Scholar]
- [24].Madihally SV, Matthew HWT. Porous chitosan scaffolds for tissue engineering. Biomaterials 1999;20:1133–42. [DOI] [PubMed] [Google Scholar]
- [25].Hollister SJ. Porous scaffold design for tissue engineering. Nat Mater 2005;4:518–24. [DOI] [PubMed] [Google Scholar]
- [26].Bäckdahl H, Esguerra M, Delbro D, Risberg B, Gatenholm P. Engineering microporosity in bacterial cellulose scaffolds. J Tissue Eng Regen Med 2008;2:320–30. [DOI] [PubMed] [Google Scholar]
- [27].Bodin A, Bharadwaj S, Wu S, Gatenholm P, Atala A, Zhang Y. Tissue-engineered conduit using urine-derived stem cells seeded bacterial cellulose polymer in urinary reconstruction and diversion. Biomaterials 2010;31:8889–901. [DOI] [PubMed] [Google Scholar]
- [28].White DG, Brown RM. Prospects for the commercialization of the biosynthesis of microbial cellulose. In: Schuerech C, editor. Cellulose and wood-chemistry and technology New York: Wiley; 1989. p. 573–90. [Google Scholar]
- [29].Svensson A, Nicklasson E, Harrah T, Panilaitis B, Kaplan DL, Brittberg M, et al. Bacterial cellulose as a potential scaffold for tissue engineering of cartilage. Biomaterials 2005;26:419–31. [DOI] [PubMed] [Google Scholar]
- [30].Todaro GJ, Green H. Quantitative studies of the growth of mouse embryo cells in culture and their development into established lines. J Cell Biol 1963;17:299–313. [DOI] [PMC free article] [PubMed] [Google Scholar]
- [31].Frame KK, Hu WS. A model for density-dependent growth of anchorage-dependent mammalian cells. Biotechnol Bioprocess Eng 1988;32:1061–6. [DOI] [PubMed] [Google Scholar]
- [32].León y León CA. New perspectives in mercury porosimetry. Adv Colloid Interface Sci 1998;76–77:341–72. [Google Scholar]
- [33].Kuboki Y, Takita H, Kobayashi D, Tsuruga E, Inoue M, Murata M, et al. BMP-Induced osteogenesis on the surface of hydroxyapatite with geometrically feasible and nonfeasible structures: topology of osteogenesis. J Biomed Mater Res 1998;39:190–9. [DOI] [PubMed] [Google Scholar]
- [34].Wang CC, Yang KC, Lin KH, Liu HC, Lin FH. A highly organized three-dimensional alginate scaffold for cartilage tissue engineering prepared by microfluidic technology. Biomaterials 2011;32:7118–26. [DOI] [PubMed] [Google Scholar]
- [35].Dai W, Kawazoe N, Lin X, Dong J, Chen G. The influence of structural design of PLGA/collagen hybrid scaffolds in cartilage tissue engineering. Biomaterials 2010;31:2141–52. [DOI] [PubMed] [Google Scholar]


