Abstract
Effective management of neurogenic orthostatic hypotension and supine hypertension (SH-OH) due autonomic failure requires a frequent and timely adjustment of medication throughout the day to maintain the blood pressure (BP) within the normal range, i.e., an accurate depiction of BP is a key prerequisite of effective management. One of the emerging technologies that provide one’s circadian and long-term physiological status with increased usability is unobtrusive zero-effort monitoring. In this paper, a zero-effort device, a floor tile, was used to develop an unobtrusive BP monitoring technique. Namely, RJ-interval, the time between the J-peak of a ballistocardiogram and the R-peak of an electrocardiogram, was used to develop a classifier that can detect changes in systolic BP (SBP) induced by the Valsalva maneuver on healthy adults (i.e., a simulated SH-OH). A t-test was used to show statistical differences between the mean RJ-intervals of decreased SBP, baseline, and increased SBP. Following the t-test, a classifier that detected a change in SBP was developed based on a naïve Bayes classifier (NBC). The t-test showed a clear statistical difference between the mean RJ-intervals of the increased SBP, baseline, and decreased SBP. The NBC-based classifier was able to detect increased SBP with 89.3% true positive rate (TPR), 100% true negative rate (TNR), and 94% accuracy and detect decreased SBP with 92.3% TPR, 100% TNR, and 95% accuracy. The analysis showed strong potential in using the developed classifier to assist monitoring of people with SH-OH; the algorithm may be used clinically to detect a long-term trend of symptoms of SH-OH.
Keywords: Orthostatic hypotension, supine hypertension, RJ-interval, ballistocardiogram, electrocardiogram, systolic blood pressure
We present a new unobtrusive method using ballistocardiogram and electrocardiogram for detecting sudden drops in blood pressure that can lead to falls.
I. Introduction
Orthostatic hypotension (OH) is defined as a drop of 20mmHg or more in systolic blood pressure (SBP) and ten mmHg or more in diastolic blood pressure (DBP) within three minutes of standing up from a supine position [1]. OH is the second largest cause of a prevalent condition known as syncope—a sudden, brief loss of consciousness due to reduced cerebral blood perfusion [1], [2]. While spontaneous and complete recovery ensues syncope, the condition portends other serious events such as a fall. Episodes of syncope are linked to approximately 6.7 million emergency department visits, over 460,000 three-day admissions, and an annual cost of $2.4 billion in the United States [3], [4]. The occurrence of OH is proportional to age with higher frequency in institutionalized older adults, reaching up to 70%, compared to approximately 6% in community-dwelling older adults [5]. OH is also a predictor of coronary events, heart failure, cardiovascular mortality, and leads to a poorer prognosis of diabetes mellitus and heart failure [6].
A rapid transition from a supine to an upright position (e.g., standing up from a bed) causes pooling of 300 to 800mL of blood in the lower extremities. This accumulation reduces the venous return to the heart, reducing cardiac output and blood pressure (BP) as results. While an intact autonomic nervous system (ANS) stabilizes the reduced BP by increased vascular resistance, heart rate, and cardiac contractility [7], lack of or debilitated compensatory reactions caused by autonomic failure fail to achieve the return. About 88% of OH caused by autonomic failure, one of the main types of OH also known as neurogenic OH, takes place within one minute, 11% within two minutes, and 1% within three minutes after standing up [1], [8], [9]. Note that the term autonomic failure is more closely related to OH compared to the term autonomic dysfunction [1].
BP is increased when transitioning from upright to a supine position as the venous return is increased [10]. In a similar manner as neurogenic OH, an abnormal ANS lacks a proper reflex response to return the BP, sustaining the increased BP that will progressively damage end-organs (e.g., kidney, heart) [11]. These mirrored symptoms to neurogenic OH caused by a condition known as supine hypertension (SH) (i.e., having SBP greater than 150 mmHg or DBP greater than 90 mmHg in a supine position [6]) complicate the management of OH. For example, medications used to treat OH and SH are counteractive to each other; the intake of the medications should be timed carefully to avoid exacerbation of the conditions. As high as 56% of individuals with neurogenic OH have SH as comorbidity based on a study involving 117 subjects [6], [12]. As such, helping clinicians to make a more informed decision and support proper management via an accurate depiction of the disease symptoms is crucial. Neurogenic OH with SH as comorbidity is referred to SH-OH hereafter.
Several tests are available for diagnosing SH-OH in a clinic. These tests include the bedside postural test, sympathetic skin test, head-up tilt test (HUTT), sinus arrhythmia test, Valsalva maneuver (VM), and post-prandial hypotension test [8], [13], [14]. While these tests help clinicians to diagnose autonomic failure and SH-OH properly, they are limited to the clinic and do not provide information in the outpatient setting (e.g., home of the affected individual). As discussed above, having an accurate depiction of the physiological state of the patient can enable clinicians and patients to choose optimal management scheme. An emerging method that aims to achieve such feat is unobtrusive monitoring via zero-effort technologies (ZETs) [15], [16]. A ZET is a technology that requires little or no effort from the user to operate; while the task or activity of interest may require effort, using the ZET that supports accomplishing the task does not [15]. Despite its potential to provide autonomous or semi-autonomous physiological monitoring to support the management of SH-OH in outpatient settings, there has been little precedence of using ZETs to tackle the issue.
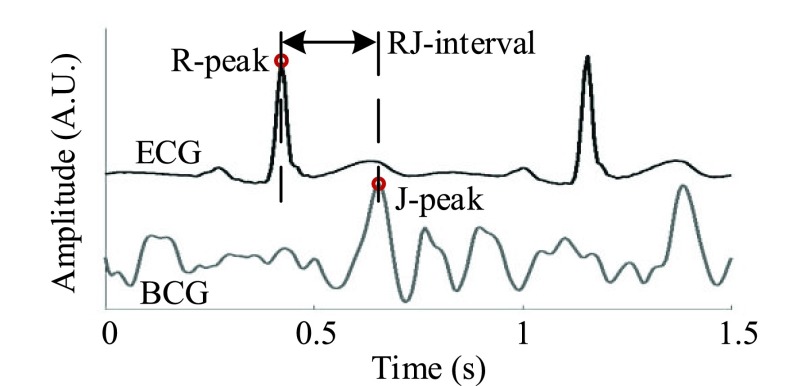
Previous works on monitoring SH-OH has been in the light of detecting syncope. Couceiro et al. (2016) unobtrusively detected syncope using pulse arrival time (i.e., the time between the R-peak of an electrocardiogram or ECG and a defined point in a photoplethysmogram or PPG; PAT) [17]. In this work, another unobtrusive modality known as a ballistocardiogram (BCG) along with an ECG was used to develop a classifier that detected changes in SBP triggered by the VM. In recent years, a BCG has emerged as a versatile tool to address chronic conditions such as a cardiovascular disease (e.g., heart failure) and obstructive sleep apnea [18], [19]. A parameter derived from a BCG and an ECG known as the RJ-interval (i.e., the time between the R-peak of an ECG and the J-peak, the strongest peak, of a BCG; Fig. 1) was shown to correlate with the pre-ejection period [20]. Shin et al. (2009) showed that the RJ-interval was correlated to SBP when the change was triggered by the VM [21]. While studies have been done to correlate BCG parameters to physiological parameters without an ECG such as a study by Ashouri et al. where the IJ-interval was shown to have a high correlation with pre-ejection period, there has been no study that linked BCG parameters directly to SBP [22]. Only the RJ-interval showed a solid evidence of correlation to SBP and the strongest potential of success in further investigation. Thus, this study examined a method to detect a change in SBP using the relationship between the RJ-interval and SBP. To the authors’ knowledge, this is the first work that has investigated an unobtrusive monitoring solution for SH-OH using the RJ-interval. An example scenario of using the classifier is when a person wakes up in the morning and goes to the bathroom, a zero-effort device such as an instrumented floor tile measures and assesses the patient’s neurogenic OH. When the patient goes to sleep, a bed measures the RJ-interval of the patient unobtrusively, assessing the degree of his or her SH. The processed information (e.g., any signs of adverse event or deviation) is forwarded to the stakeholders such as clinicians, caregivers, and the individuals with SH-OH for a long-term trend assessment. Finally, in addition to the SH-OH management, the classifier may potentially be used to monitor other ANS related conditions such as baroreceptor failure or situational syncope which elicit overlapping symptoms as SH-OH (e.g., reduction or unregulated change in BP) [23], [24].
FIGURE 1.
Definition of the RJ-interval (Subject 9 Session 1).
The remainder of this paper is organized as follows. Sections II and III present the methods and the results of the analyses, respectively. The results, limitations, and future works are discussed in Section IV, with conclusions and future directions in Section V.
II. Methods
This study used the inversely proportional relationship between SBP and the RJ-interval generated by the VM to examine the feasibility of detecting changes in SBP [21]. The VM is one of the most frequently performed non-invasive tests to assess reflex circulatory control and is defined as inhaling air and applying pressure to the lungs without exhaling to cause a rise in BP [10], [13], [14]. The VM was chosen in this work because it shares the characteristics of SH-OH where the reduced venous return during the strain (i.e., applying pressure) is similar to that observed in neurogenic OH. After the release of the strain, a sudden increase in venous return resembles what happens when lying down from a standing position (i.e., SH) [10], [25]. These characteristics and its usage in SH-OH clinical research made the VM an ideal basis for the algorithm development [8], [26]. The investigation consisted of four steps: data acquisition, pre-processing (e.g., feature measurement), analysis of the distribution of three classes (i.e., Baseline, Decreased SBP, and Increased SBP) via a t-test and the development of the classifier that detected changes in SBP based on a Naïve Bayes classifier (NBC). Each step of the analysis is presented in the following sections.
A. Data Acquisition
Sixty (60) healthy adults (28 male, 32 female) between 18 and 65 years of age (mean of 26.9 ± 6.1 years) without any symptoms of SH-OH or autonomic failure were recruited for the study. The study protocol was approved by the University Health Network Research Ethics Board (UHN REB 12-038), and the trials were conducted in the HomeLab in Toronto Rehab Institute-UHN. Each participant (hereafter referred to as a subject) provided informed consent at the start of each trial, and his or her demographic information was obtained. A BCG was recorded from subjects while they stood on a custom-built smart floor tile [27]. An ECG could be measured from the tile as well, and an in-depth analysis of this topic was included in the previous publication [27]. A summary was included in the Appendix. Data recording started with the subject standing still on the tile for one minute to ensure that all parameters returned to the baseline. At the one minute mark, the subject was asked to perform the VM for 15 seconds to induce a change in BP. Once the subject completed the VM, he or she stood still on the smart floor tile for the next five minutes. This procedure was repeated three times, totalling up to 18 minutes of recording time per subject. Note that throughout the text, each repetition (i.e., 6 minutes of recording) is referred to as a session. While the subjects went through two additional scenarios with different settings during the trial, these additional settings are not relevant to the current work, thus are not discussed.
During each session, beat-to-beat BP was measured by Portapres (Finapres Medical Systems, the Netherlands) and conventional BP using an arm cuff was measured every one minute by BpTRU (BpTRU Medical Devices, British Columbia, Canada). Measurements from Portapres and BpTRU were used as gold-standard measurements for BP. A 3-lead ECG was measured from the chest by Shimmer 2r ECG module (Shimmer, Ireland) where the signal was transmitted wirelessly. In addition to the wireless ECG, a wired ECG was captured with a sole purpose of synchronization of the wireless ECG to the rest of the signals. The details of synchronization were included in the Appendix. Signals from the tile, the wired ECG, and Portapres waveform was recorded using National Instruments Data Acquisition Board (DAQ with an NI cDAQ-9174 chassis and NI 9215 analog input module). Fig. 2a illustrates the setup. While Portapres was able to track changes in BP, its measurement of absolute BP in mmHg was less reliable. Therefore Portapres beat-to-beat data was corrected to the BP measured by BpTRU, as illustrated in Fig. 2b and c. The sampling rate for all signals was 128Hz.
FIGURE 2.
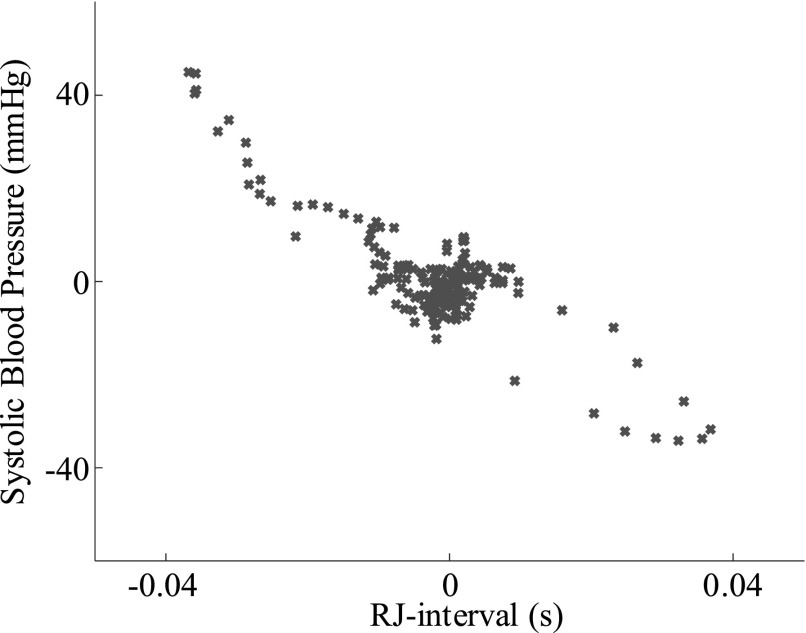
Positions of the devices used to record data during the study (a). Portapres and BpTRU cuff blood pressure data before the offset correction (b) and after the offset correction plotted in SBP versus the RJ-interval – truncated data for visual clarity (c). Subject 15 session three.
B. Pre-Processing
1). Feature Measurement
In the post-trial analyses, a band-pass finite-impulse-response filter with pass-band frequencies of 1–40Hz (Hamming window) was used to filter the collected signals to remove the signal drift and 60Hz noise. Artifacts were examined visually, and subjects with severe artifacts (e.g., approximately twice the variance of a stable signal) were removed from the analysis. Following the filtering, the R-peaks of the ECG from Shimmer ECG module were found by the simplified Pan and Tompkins method [28]. The J-peak of the BCG from the smart floor tile were detected using the R-peaks as fiducial points. Maximum BCG value between the R-peak of the ECG and 0.3s after the R-peak were labelled as the J-peak. The range of 0.3s was used based on the literature [29], [30]. The RJ-interval was calculated by finding the time difference between an ECG R-peak and corresponding BCG J-peak. The BP values generated by Portapres were matched to the ECG so that each RJ-interval was synchronized with the corresponding SBP. Incorrectly detected BCG J-peaks due to minor artifacts were fixed, and outlier RJ-intervals generated by noisy signal were removed from the analysis after a visual examination.
It is important to note that while the BCG during the VM was noisier than the rest of the signal, the signal was captured and the peaks were detected. The successful detection of the J-waves allowed the authors to analyze the decrease in SBP.
2). Smoothing
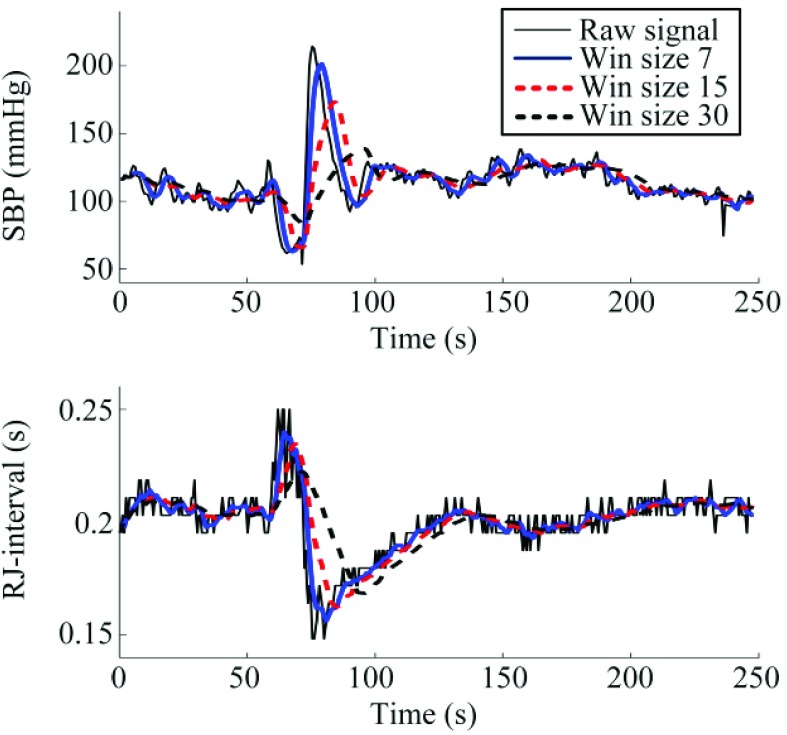
Following the feature measurement, the SBP and RJ-interval waveforms were smoothed to reduce beat-to-beat fluctuations. While beat-to-beat fluctuations (i.e., high-frequency component) may provide information such as sympathetic and cardiovagal tone in the frequency domain [31], the focus of the current work remained in the time-domain where beat-to-beat fluctuation could create noise in the subsequent analyses. To smooth the waveforms, moving average of size seven heartbeats (i.e., 5 to 6 seconds) was used. The size of seven was chosen based on the previous works where it was shown that SBP and the RJ-interval had the highest correlation with the window size of seven [21]. While window sizes of 15 and 30 were also tested to examine the effect of averaging, the averaged signals with the window size of seven obtained superior results and was therefore used in the subsequent analyses. The results of smoothing with different window sizes are included in the Appendix.
3). Offset Removal and Definition of Stable Region
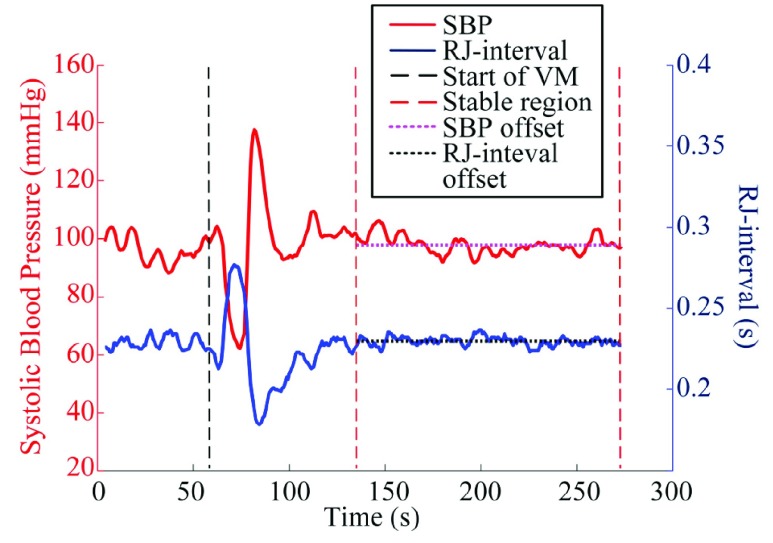
In order to focus on the change in parameters, offsets of SBP and the RJ-interval were removed from the data after smoothing. A stable region was defined as the period from 30 seconds after both SBP and the RJ-interval returned to the baseline following the VM to the end of the session to assist the calculation of the offsets. While the duration of BP return after the release of the VM is not clearly indicated, a normal ANS returns the changed BP to the baseline in a few heartbeats [32]. The 30-second buffer (i.e., sufficiently larger than a few heartbeats) was to ensure the signals reached the baseline. The point where SBP and the RJ-interval returned to the baseline were empirically determined for each session. The means of the RJ-interval and SBP within the stable regions (i.e., offsets) were calculated (Fig. 3) and were subtracted from the respective signals. Signals without the offsets are depicted in Fig. 5. Note that the signals before the VM were not used as the period was used to restore the baseline.
FIGURE 3.
Baselines of SBP and the RJ-interval. Subject 59 session three.
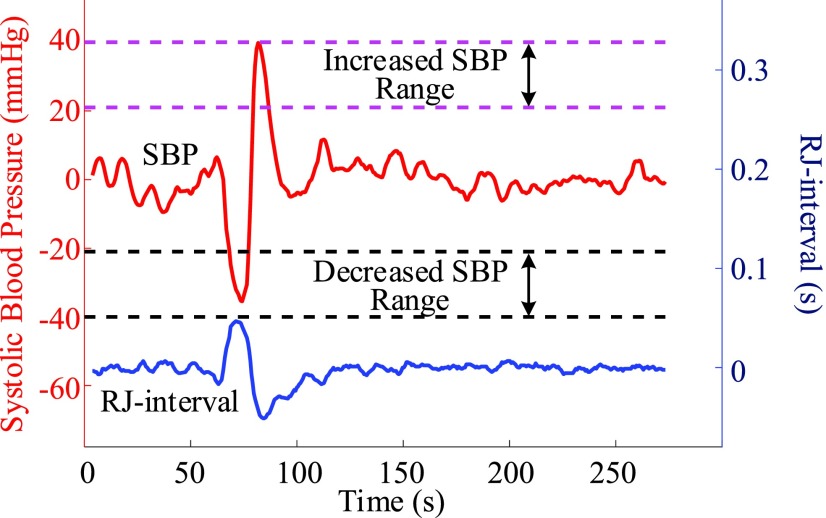
FIGURE 5.
Baselines were removed and each session was checked if it had usable data that were within the decreased or increased BP region (Subject 59 session three).
4). De-Trend
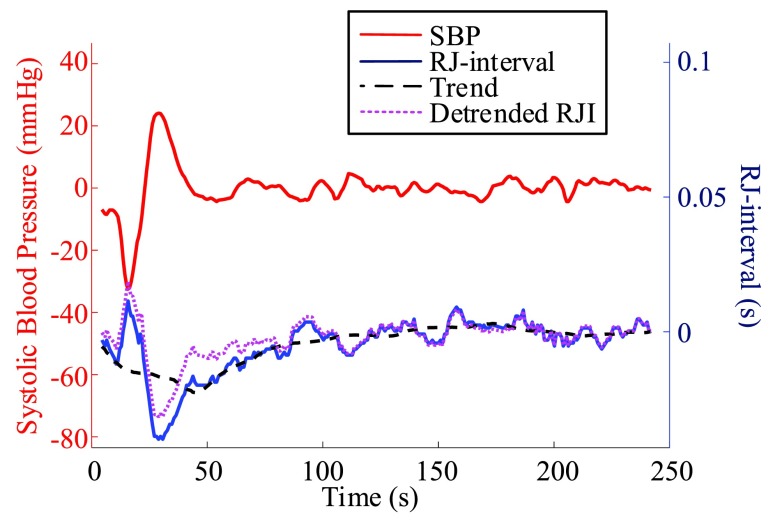
After the offsets were removed, it was observed that the RJ-interval was generally biased towards the negative domain. As shown in Fig. 4, given the change towards positive and negative directions, the RJ-interval showed stronger expression towards negative direction. This translates to the RJ-interval having higher affinity towards increased SBP than decreased SBP as the RJ-interval is inversely proportional to SBP. As this pattern was observed throughout the sample population, de-trending (i.e., high-pass filter) was applied to the RJ-interval to compensate for the bias without changing SBP. Two steps were taken to adjust the bias: calculation of the trend of the RJ-interval and weighted subtraction of the trend from the RJ-interval. First of all, the trend of the RJ-interval was calculated by taking an average of a window centered on each point, which is equivalent to applying a finite-impulse-response (FIR) low-pass filter. Given the window size of  seconds and the time where a data point is located,
  , the RJ-intervals from
  to
to  were averaged. Centering the window prevented phase shift of the original signal. This was repeated for all the RJ-intervals, generating a trend waveform as shown in Fig. 4. Note that any part of the window that is out of the waveform was truncated and only the available data was used. The trend was then weighted uniformly and subtracted from the RJ-interval to adjust the bias (i.e., high-pass filter). The de-trended RJ-interval waveform is also shown in Fig. 4. One of the filter parameters, the window size denoted as
  , was varied from 2s to 60s with an increment of 2s, and the weight, another parameter denoted as
  , was varied from 0.1 to 1 with an increment of 0.1; this produced 30 by 10 different versions of the sample data set. The subsequent analyses (e.g., t-test, and SBP change detection via a NBC) were applied to each set of data with specific de-trending parameters. The best parameters were calculated based on the result of the SBP change detection. For comparison, data without de-trending was also used in the analysis.
FIGURE 4.
Comparison of the RJ-interval before and after de-trending (m = 44, w = 0.5, Subject 34 session one).
5). Class Definition
Three classes were defined after the offsets were removed. For each session, data points or heartbeats within −5 to 5 mmHg change were labelled as “Baseline” class; data points between −20 to −40 mm Hg were defined “Decreased SBP” class; and data points between +20 to +40 mmHg were labelled as “Increased SBP” class. The RJ-intervals corresponding to the selected SBP were labelled as the same class as the SBP. The upper boundary of the Decreased SBP class was defined according to the definition of OH [1]. The lower limit of −40 mmHg was set as an initial experimental boundary where the range of 20 mmHg was motivated based on the former hypertension classifications (e.g., stage 1, 2) [33]. The range of the Increased SBP class was reflected from the definition of the Decreased SBP class. Given the definition of normal SBP is around 120 mmHg, +20 to +40 mmHg translate to approximately 140 to 160 mmHg, which encompasses the definition of SH of having SBP greater than 150 mmHg [6]. Note that the data beyond ±40 mmHg were not used to make sure the region was clearly bounded. Fig. 5 illustrates the definition of the Increased SBP and the Decreased SBP class. Not all subjects produced enough change in SBP to have data points within the range of the Increased SBP and/or the Decreased SBP class, and subjects or sessions of a subject were excluded from the analyses if they did not have a sufficient data. The details of the exclusion criteria are discussed in the next section.
C. Signal Analysis
1). T-Test Between Classes
The RJ-intervals of the three classes were used to examine each class is statistically different from other classes. Namely, the mean of RJ-intervals of the Decreased SBP class was tested if it was statistically different from the mean of the RJ-intervals of Baseline class. The same analysis was applied to the Increased SBP and the Baseline classes. The analysis involving the Increased SBP and the Baseline class is referred to as the increased-SBP-baseline analysis, and the analysis involving the Decreased SBP and the Baseline class is referred to as the decreased-SBP-baseline analysis hereafter. The increased-SBP-baseline analysis was done separately from the decreased-SBP-baseline analysis.
A one-sided t-test with unknown, unequal variance assumption with  was used. Null and alternative hypothesis are stated as below.
 |
The distance between the two means is  , and the means of the two classes being compared are
  and
and  .
.
For the t-test and classifier development, following terms should be defined. A qualified session is defined as having at least one data point in the two classes being compared (e.g., at least one point in the Increased SBP class and the Baseline class for the increased-SBP-baseline analysis). For each subject, data of each class in all qualified sessions were combined. For example, if two sessions were qualified in the decreased-SBP-baseline analysis for a subject, the sessions were combined to produce pooled Decreased SBP class and Baseline class for the t-test. After the combination of sessions, subjects with less than three data points in a class were removed from the analysis (i.e., at least three data points were needed in order to calculate a sample variance in the analyses). Data of all qualified subjects were combined to form an aggregated data. The t-test was performed on each qualified subject and the aggregated data. As the RJ-interval is inversely proportional to SBP, the mean RJ-interval of the Baseline class was tested if it is statistically smaller than that of the Decreased SBP class, and the mean RJ-interval of the Increased SBP class was tested if it is statistically smaller than that of the Baseline class. For each t-test, the distance,  , was calculated that achieved a p-value of 0.05 and was defined as maximum
  .
.
2). Detection of Change in SBP Via NBC
The distributions of different classes were used as a basis for developing a classifier that can detect changes in SBP. Namely, the classifier aims to detect if an individual is experiencing a decrease or an increase in SBP. This detection classifier is hereafter referred to as the regional classifier and classification done by the regional classifier is referred to as a regional classification. The analysis was again composed of two separate parts: the detection of increased SBP and the detection of decreased SBP. The same data used in the t-test was used again here except that the sessions of each subject were not combined; each session was treated as a single test case. The regional classifier consisted of two main components: NBC that classified each RJ-interval based on the aggregated data distribution and a majority vote process that determined if a change in SBP is taking place in a specific region.
A NBC is a linear classifier that makes a classification based on the distribution of data. The RJ-interval was used as a feature, and the NBC fitted a Gaussian distribution over the training data (i.e., the three classes) [34]. A NBC was chosen because the highly disproportionate ratio of the data (i.e., imbalance data) in different classes did not affect the results. The class conditional distribution,  , was defined as
  ,
,  ) where the mean of the RJ-interval of the class c is
  , and its variance is
  . In order to train the data to the model, maximum likelihood estimation (MLE) was computed where MLE for a Gaussian distribution corresponds to the sample mean and unadjusted sample variance for each class. The trained NBC classified a test point based on
  ,
,  ) [34].
The model used to train the NBC was a leave-one-subject-out method where the data of the subject of interest was left out, and the rest of the data were used to train the NBC. The trained NBC was then used to classify each RJ-interval of the test subject as either Increased SBP, Baseline, or Decreased SBP, forming an array of classified outputs. This array of classified outputs are hereafter referred to as the output waveform.
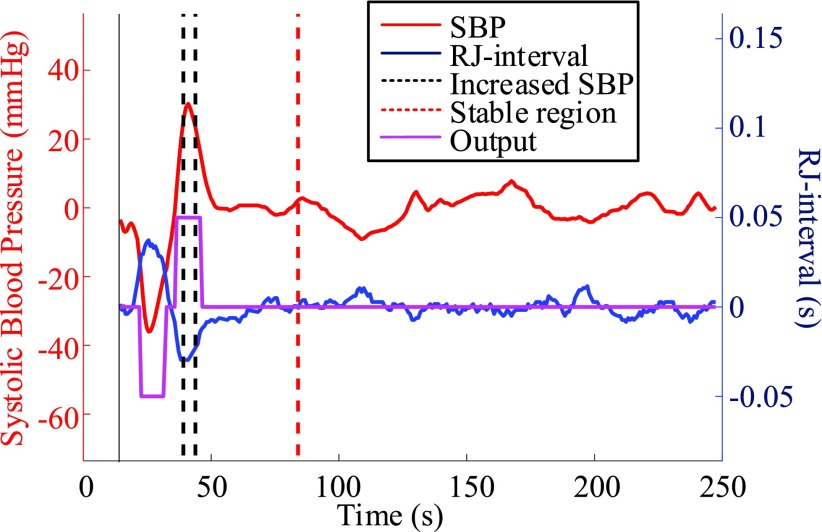
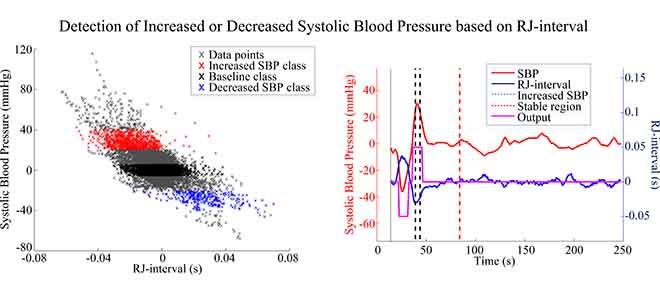
The output waveform generated by the NBC was subjected to a majority vote to generate the final decision of whether the subject is experiencing a decrease or an increase in SBP. If equal to or greater than 50% of data points within the non-Baseline class were correctly classified by the NBC, then the regional classifier indicated a change in SBP (Fig. 6). This session is considered as a true positive, and the result of each session was collected to rate the performance of the regional classifier. For example, suppose there are ten data points within the Increased SBP class of a particular session of a subject. If five or more are correctly classified among the classifications of the ten points corresponding to the Increased SBP class, then this is recorded as a positive. This result is also a true positive since the classification matches the label of having an increased SBP change. The same method was applied in detecting a decrease in SBP. The classifier was tested against any false positive by using the data in the stable region. In terms of the stable region, however, a different criteria were applied. If one or more NBC outputs were Increased SBP or Decreased SBP within the stable region, then the entire region was classified as having a change (i.e., a false positive). If all outputs within the stable region were classified as the Baseline class, then the region was classified as a true negative. Note that the parts of the output waveform that do not belong to either one of the three classes were are not considered as these regions are mostly in transition. In other words, only the regions with clear labels were used in determining positives and negatives. A true positive rate (TPR) and true negative rate (TNR) were calculated for the increased-SBP-baseline and the decreased-SBP-baseline analysis by dividing positives with the total number of sessions used. For example, if 75 true positives were detected out of 81 sessions that had a change in SBP, then the TPR is 75 divided by 81, which is 93%. The sum of true positives and true negatives divided by the sum of respective total sessions was labelled as the accuracy.
FIGURE 6.
The NBC based regional classification of increased SBP. The trained NBC was used to classify each RJ-interval and produce an output waveform. If equal to or greater than 50% of the data points within the Increased SBP class were classified correctly, then the regional classifier stated that increased SBP change is detected. Subject 34 session two.
Referring back to the de-trending, the results of the regional classifier were used as decision criteria in selecting the best parameters for de-trending. The results were combined into a single number that combined the results of both the increased-SBP-baseline analysis and the decreased-SBP-baseline analysis. Namely, the average of the accuracies of the two analyses (i.e., overall accuracy) was used.
III. Results
Out of 60 subjects, two subjects had an abnormal BP drop after the VM and had to stop the trial early, one subject had an abnormal ECG, namely premature ventricular contractions, and one subject had involuntary movements that made the data unusable. Additionally, BCG signals from four subjects were not recorded properly because of technical problems (i.e. poor connection, unavailability of gold-standard measurement). Three subjects had issues with Portapres such as severe baseline shift, and one subject had unknown noise source that rendered the data unusable. Therefore, data of total 48 participants were used in the analysis.
A. De-Trending Results
The result of de-trending is best presented with the results of the subsequent analyses. Therefore, the result is discussed in full with the regional classifier. While the t-test was done for all combinations of de-trending parameters,  and
and  , only the result of the t-test based on the best de-trending parameters are presented for brevity.
B. T-Test Results
The de-trending parameters that produced the best results (i.e., overall accuracy) were an  of 44 seconds with
  of 0.5. De-trended data using these parameters yielded 34 subjects for the increased-SBP-baseline analysis and 20 subjects for the decreased-SBP-baseline analysis. 18 subjects were involved in both analyses. The results of the individual subject t-tests are presented and discussed in the Appendix.
1). Baseline and Increased SBP
Aggregated data analysis showed that the mean RJ-interval of the Increased SBP class,  , was statistically smaller than that of the Baseline class,
  , by 19ms based on 34 subjects (Table 1). A total number of data points,
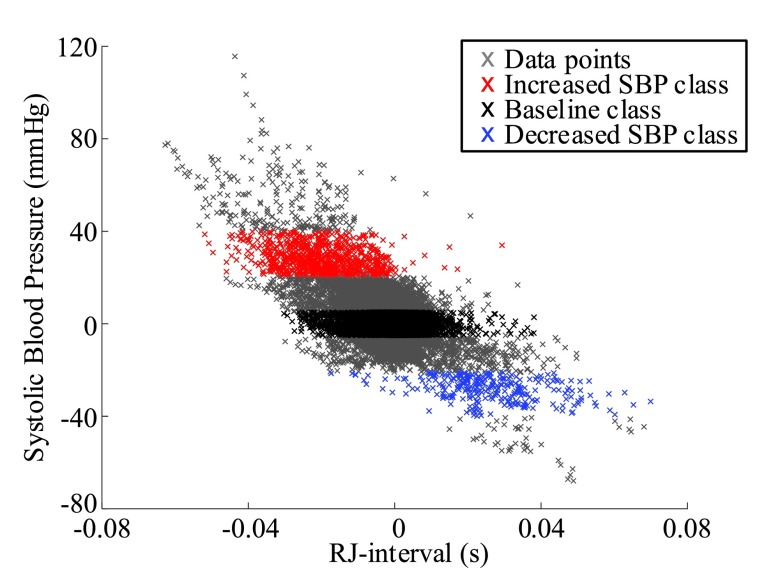
  , for the Increased SBP class was 813 points after the aggregation whereas the number of the Baseline class data used for the increased-SBP-baseline analysis was 13,775. Table 1 shows the mean, the number of data points, and the standard deviation,
  , of the RJ-interval of each class. Fig. 7 shows the aggregated data with three different class indicated with different colors (
 ,
,  ).
).
TABLE 1. Aggregated t-Test Results.
| Baselinea | Increased SBP | |||||
|---|---|---|---|---|---|---|
| N1 | X1 | S1 | N2 | X2 | S2 | Max d0 a |
| 13,775 |  |
 |
813 |  |
 |
0.019 |
| Decreased SBP | Baseline | |||||
| N1 | X1 | S1 | N2 | X2 | S2 | Max d0 |
| 284 |  |
 |
7,086 |  |
 |
0.025 |
The aggregated t-test between the Increased SBP class and the Baseline class and between the Decreased SBP class and the Baseline class. In terms of the increased-SBP-baseline analysis, subscript one relates to the baseline and two relates to the Increased SBP class, and in terms of the decreased-SBP-baseline analysis, subscript one relates to the decreased SBP and two relates to the Baseline class.  is the number of data points,
  , is the mean RJ-interval in seconds, and
  is the standard deviation of the RJ-intervals in seconds. Max
  is the distance between the mean RJ-interval of the Baseline class and that of the Increased SBP or Decreased SBP class given that the p-value equals 0.05.
The units of mean and standard deviation of the RJ-interval and Max d0 are in seconds.
FIGURE 7.
Aggregated data for all subjects indicating the Baseline class in black, the Increased SBP class in red, and the Decreased SBP class in blue ( ,
,  ).
).
2). Baseline and Decreased SBP
Aggregated data analysis showed that the mean RJ-interval of the Baseline class,  , was statistically smaller than that of the Decreased SBP class,
  , by 25ms based on 20 subjects (Table 1). A total number of data points for the Decreased SBP class was 284 points after the aggregation whereas the number of the Baseline class data used for the decreased-SBP-baseline analysis was 7,086.
C. Detection of Change in SBP Via NBC - Results
For the increased-SBP-baseline analysis, total 84 sessions of 34 subjects were used. One session had an incorrect label for the stable region (i.e., changes in SBP occurred) and was removed from the analysis. In total, there were 84 sessions that had changes in SBP towards increased SBP and 83 sessions that had a stable region with no change. For the decreased-SBP-baseline analysis, total 41 sessions of 20 subjects had reduced SBP and 40 sessions had valid stable regions with no change in SBP.
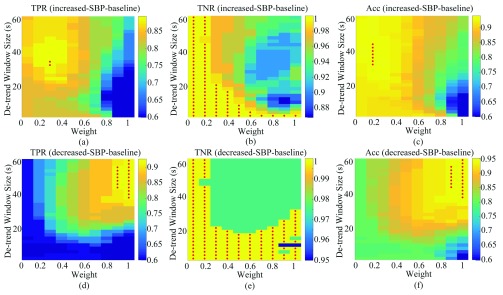
The TPR, TNR, and accuracy of the increased-SBP-baseline and the decreased-SBP-baseline analyses for different values of  and
and  are shown in Fig. 8. The best TPR for the increased-SBP-baseline analysis was 89.3% (
 and 24s,
  ) and that of the data without de-trending was 83.3%. The best TPR for the decreased-SBP-baseline analysis was 92.3%, and that of the data without de-trending was 58.5%. 92.3% was achieved in multiple combinations of the de-trending parameters:
  from 44 to 56s with
  and
and  from 38 to 60 s with
  . The results are shown in Fig. 8a and d.
FIGURE 8.
(a), (b), and (c) are the TPR, TNR, and accuracy of the increased-SBP-baseline analysis, respectively. (d), (e), and (f) are the TPR, TNR, and accuracy of the decreased-SBP-baseline analysis, respectively. Red dots indicate the maximum value(s). TPR: true positive rate; TNR: true negative rate; Acc: accuracy.
The best TNR for the increased-SBP-baseline analysis with de-trending was 100% where the performance decreased as the  and
and  both increased. In terms of the decreased-SBP-baseline analysis, the best TNR was also 100% and showed the same pattern with the increased-SBP-baseline analysis. The TNRs for the data without de-trending were 100% for both analyses. Fig. 8b and e show the results.
The best accuracy for the increased-SBP-baseline analysis was 94.0% ( from 32 to 44s,
  ) and that for the decreased-SBP-baseline analysis was 95.0% (
 and
and  are the same as the TPR; Fig. 8c and f). The accuracies for the data without de-trending were 91.6% and 79.0% for the increased-SBP-baseline and the decreased-SBP-baseline analyses, respectively.
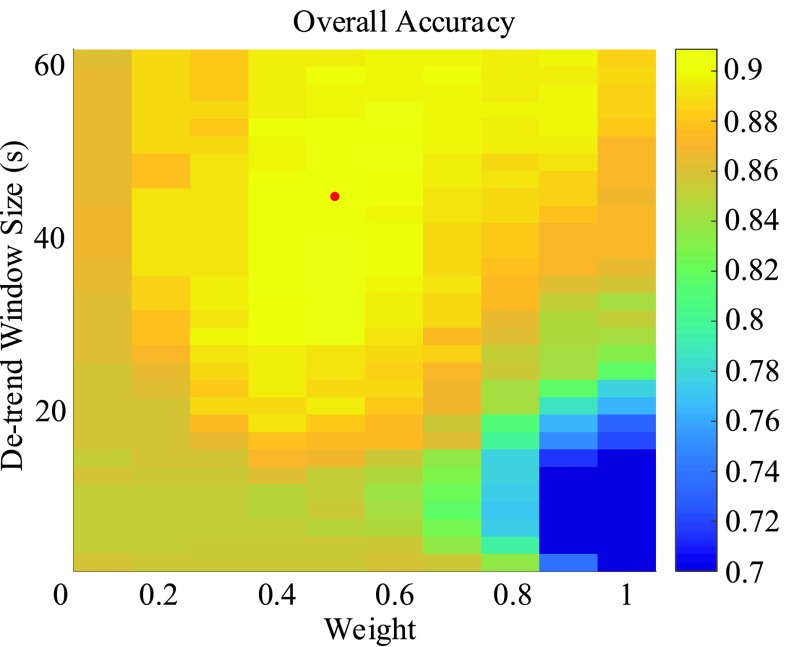
The accuracies were combined to give the overall accuracy for both increased- and decreased-SBP-baseline analyses. The best overall accuracy was 90.9% ( ,
,  ), and that without de-trending was 85.2%. Fig. 9 shows the results of the overall accuracy.
FIGURE 9.
Combined overall accuracy of the de-trending. The maximum value occurs at m = 44s and w = 0.5.
IV. Discussion
Two separate analyses of the increased-SBP-baseline and the decreased-SBP-baseline had 34 and 20 subjects for the analysis, respectively. It was expected that not all subjects would produce enough change in SBP by the VM to be included in the analysis. Based on the qualitative observation of the subjects performing the VM, even though the subjects stayed true to the instruction, which was to exert the maximum pressure for 15 seconds, the BP did not change much in some subjects. In order to reduce the sources of error further, a quantitative VM (e.g., exerting pressure against a known counter pressure) may be used in the future. In addition, the lowered SBP is expected to recover some of the overshoot during the strain when the body’s neurologic reflex and vasculature are intact, which resulted in fewer trials crossing the −20mmHg threshold of the Decreased SBP class [25]. These patterns are reflected accordingly in our study and explains the reduced number of subjects and the lower number of subjects involved in the decreased-SBP-baseline analysis.
In terms of the number of data points used, the Baseline class had far more data than that of the Increased SBP class or the Decreased SBP class, having about 15–25 times greater number of data in both aggregated analyses. This difference, however, did not affect the aggregated analyses as the number of data in the Baseline SBP class were large (>7,000) and the relevant results of the t-test had high confidence. This confidence is passed to the regional classifier as the NBC was trained based on the data similar to the aggregated data (i.e., aggregated data without the data of the test subject).
De-trending significantly increased the TPR for the decreased-SBP-baseline analysis from 58.5% to 92.3%. Empirically, the improvement of the result showed that the bias is not subject-specific. Rather, the pattern is present throughout the sample population. De-trending did not result in a significant improvement for the high TPR of the increased-SBP-baseline analysis (i.e., from 83.3% to 89.3%) as the bias was towards the negative RJ-interval. Note that de-trending indeed had a minimum phase shift of the original signal as shown in Fig. 4.
While the TNRs were approximately the same for both analyses as shown in Fig. 8b and e, the optimal parameters (i.e.,  and
and  ) for the TPR and accuracy of the increased- and decreased-SBP-baseline analyses were on the opposite side of the spectrum. De-trending by definition reduces the amplitude of the negative RJ-interval corresponding to increased SBP and augments the positive RJ-interval corresponding to the decreased SBP. As such, very different optimal parameters for each of the analyses were expected. The overall accuracy found the compromise of these patterns, where Fig. 9 shows an approximate midpoint of the results of the increased- and decreased-SBP-baseline analyses. For reference, the optimal parameters based on the overall accuracy (i.e.,
  and
and  ) produced the TPR, TNR, and accuracy of 86.9%, 96.4%, and 91.6% respectively for the increased-SBP-baseline analysis, and 82.9%, 97.5%, and 90.1% respectively for the decreased-SBP-baseline analysis. The parameters selected via overall accuracy provided a reasonable compromise between the performances of the two analyses.
Two observable factors of incorrect regional classification, the TPR in particular, was a misalignment and weak RJ-interval amplitude where the latter was more pronounced. In the case of misalignment, having the output slightly shifted in time resulted less than 50% of the correct outputs, which made the session to be classified as a false negative. The overall effect of this issue on the results were however minor. Note that the shift existed prior to de-trending and was minimally affected by the step. While a potential solution to the issue is to add a time delay to either SBP or the RJ-interval to align the two signals, the authors found that the time shifted to align SBP and the RJ-interval was random and did not show any general pattern. The low amplitude of the RJ-interval resulted in not enough non-Baseline outputs generated by the NBC that resulted in false negative regional classification. Note that one subject had all three sessions incorrectly classified due to the issue of the low amplitude. These reasons were potentially attributed to the individual variance in physiology. In this work, aggregated distribution was used to show that the classifier can be used in a general population. Going forward, the classifier may be optimized to best-fit one’s physiological characteristics by adjusting parameters such as de-trending parameters and threshold set by the NBC.
While DBP, mean arterial pressure, and pulse pressure are typically measured along with SBP, each parameter has its unique usage in describing one’s physiological state; measuring only one of these four parameters does not undermine the significance of the measurement. The advantage of using SBP compared to other parameters is that the change is more pronounced as seen in the definition of OH and the previous explanations. Higher sensitivity can also be interpreted as being influenced easily by another stimulus (e.g., exercise). One potential solution to this issue is to incorporate context to the decision process. For example, an activity that the person performed prior to and at the time of the measurement can be recorded and used to make a more accurate decision.
As the study moves to the next phase involving individuals with SH-OH and possibly other autonomic failure induced conditions, several issues should be addressed. First of all, ECG was measured using a wearable device in this study. However, unobtrusive measurement of ECG should also be included to achieve unobtrusive monitoring. In addition to the measurement of an ECG from the tile discussed in the Appendix, the recent emergence of sensor technology can enable the unobtrusive acquisition of an ECG. For example, capacitatively-coupled electrodes have been shown to measure an ECG through the fabric and can be implemented in a bed to measure an ECG while lying down [35]. Another future work is to convert the regional classifier to a real-time SBP change detection algorithm. It was observed that the average period of Increased SBP class was 6.5s whereas that of the Decreased SBP was 8.2s. When converting the regional classifier to an algorithm that can be deployed in real-time, these time periods can be utilized to create an observational window that executes a similar process as what has been implemented here. The temporal resolution of the algorithm is further discussed in the Appendix.
In this work, engineering techniques have been focused that aimed to increase the detection accuracy. The underlying physiology of the RJ-interval and SBP behaviors such as biased RJ-interval amplitude and shifted phase should be examined from a physiological perspective to reveal the mechanism behind the observed patterns.
Finally, data points beyond +40 and −40 mmHg were not used in this work as the aim of the analysis was to detect the changes within the defined range of ±20 to ±40 mmHg. As an initial investigation, the correct detection of a single clearly defined region of SBP change proved that the gradation of the range is possible. In other words, the data points beyond +40 and −40 mmHg can be used to detect more severe changes in SBP. Not only that, the range of 20 mmHg can be manipulated to find the optimal range that provides the maximum resolution of SBP detection without compromising the accuracy.
The intended use of this algorithm is a long-term trend analysis and the detection of increased risks of OH-SH (e.g., increased frequency of pre-syncopal events) that may eventually result in syncope and a fall. Inability to stand still and perform the VM is a practical issue among the individuals with SH-OH. If the VM cannot be performed, replacement tests such as HUTT or cold pressor test should be implemented. Verification of the regional classifier against these replacement test is one of the immediate future works. The change of SBP in individuals with SH-OH, however, is intrinsic and may not require an artificial stimulation such as the VM. This hypothesis should be however verified in the future studies. The loss of BCG signal due to movement artifact is an open problem within the field, and it is a limitation with no currently effective solution. As the technology evolves, however, solutions that may enable faster and more reliable extraction of information from a BCG in the presence of minor movement artifacts may emerge.
V. Conclusion
The work presented here examined the relationship between the RJ-interval and SBP collected from healthy adults and developed a classifier that can potentially detect changes in SBP in individuals with SH-OH. The t-test involving the RJ-interval and SBP showed a clear statistical difference between the means of decreased SBP, baseline, and increased SBP. The NBC-based regional classifier was able to detect the increased SBP with 89.3% TPR, 100% TNR, and 94% accuracy, and the decreased SBP with 92.3% TPR, 100% TNR, and 95% accuracy. The analysis showed promise in using the developed classifier as a method to provide long-term monitoring of individuals with SH-OH in the future.
Appendix
A. Signal Synchronization
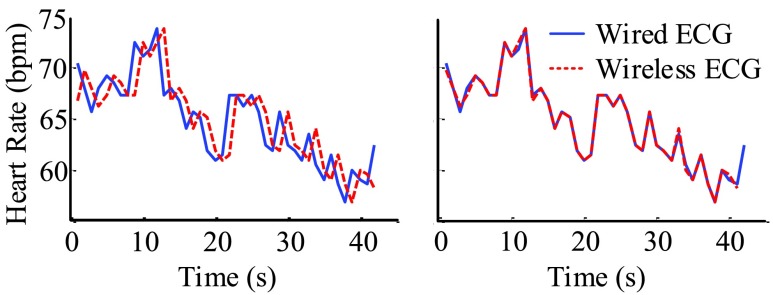
The wired ECG was acquired via a custom circuit built by the authors and was recorded in parallel to the BCG using NI DAQ. By calculating the heart rate from both wireless and wired ECGs, the latency of the wireless ECG to the rest of the signals could be calculated. By subtracting the latency, the wireless ECG could precisely be synchronized to the rest of the signals (Fig. 10).
FIGURE 10.
Synchronization of the wireless ECG to the rest of the signals via the wired ECG (Subject 58 session 1).
In terms of synchronizing Portapres, the signals consisted of two different channels, which were an ambulatory blood pressure (ABP) waveform and numerical BP values transmitted via serial communication. The ABP waveform was recorded in tandem with other signals as mentioned, and the numerical values were recorded via serial communication. The BP values received through the serial communication were matched to the ABP waveform using calibration points as reference points. The peaks of ABP waveform was then matched to already synchronized wireless ECG R-peaks, aligning each BP value to the R-peak.
B. Smoothing Results
Fig. 11 shows the effect of the smoothing with different moving window sizes. While using the window size of seven shifted the phase slightly, there was a minimal effect on the signal (i.e., the changes made by the VM were mostly unchanged). All moving average window sizes smoothed the waveforms, however, using a higher moving average window size created a noticeable delay as shown in Fig. 11.
FIGURE 11.
SBP (top) and the RJ-interval (bottom) were averaged using a moving window of different sizes. The solid blue line shows the result of the moving window size that was used for the analysis (i.e., seven). Subject 20 session three.
C. Acquisition of ECG Using the Tile
The capability of the tile to measure an ECG unobtrusively was investigated in-depth in the previous work [17]. A summary of the work is presented here.
Stainless steel electrodes on the top of the tile were used to measure an ECG from the feet of the subject. Two scenarios have been tested where the subject was seated and asked to place his or her bare feet on the tile in the first scenario, and the subject was asked to stand still on the tile in the second scenario (i.e., the protocol presented in this work). The result showed that an ECG could be measured in a sitting position with 89% agreement between the position of the R-peaks from the tile and that of the gold standard ECG. An ECG from the tile while standing could not be measured as there was an electromyogram noise from the feet. Once this obstacle is removed, the tile can measure a BCG and an ECG unobtrusively and fully deliver its zero-effort capability of unobtrusive measurement the RJ-interval.
D. Individual T-Test
For the increased-SBP-baseline analysis, the individual maximum  ‘s had the mean and the standard deviation of 18 ± 6ms. Table 2 shows the complete result.
TABLE 2. T-Test Individual Results (Increased-SBP-Baseline).
| ID | Max d0 | ID | Max d0 | ID | Max d0 |
|---|---|---|---|---|---|
| 4 | 0.009 | 23 | 0.009 | 41 | 0.027 |
| 5 | 0.021 | 24 | 0.028 | 44 | 0.018 |
| 6 | 0.016 | 25 | 0.029 | 45 | 0.019 |
| 7 | 0.010 | 28 | 0.024 | 47 | 0.015 |
| 8 | 0.014 | 30 | 0.017 | 48 | 0.014 |
| 9 | 0.017 | 31 | 0.016 | 52 | 0.030 |
| 11 | 0.013 | 32 | 0.008 | 53 | 0.017 |
| 12 | 0.018 | 33 | 0.010 | 54 | 0.023 |
| 15 | 0.024 | 34 | 0.027 | 58 | 0.015 |
| 17 | 0.023 | 35 | 0.017 | 59 | 0.028 |
| 18 | 0.020 | 37 | 0.021 | ||
| 20 | 0.008 | 39 | 0.018 |
T-test (unequal variance, one-sided) between the Baseline class and the Increased SBP class. Maximum d0 when p=0.05.
For the decreased-SBP-baseline analysis, the individual maximum  ‘s had the mean and the standard deviation of 22 ± 12ms. Table 3 shows the complete result.
TABLE 3. T-Test Individual Results (Decreased-SBP-Baseline).
| ID | Max d0 | ID | Max d0 | ID | Max d0 |
|---|---|---|---|---|---|
| 5 | 0.015 | 25 | 0.022 | 45 | 0.027 |
| 7 | 0.020 | 27 | 0.011 | 47 | 0.045 |
| 11 | 0.006 | 28 | 0.040 | 48 | 0.035 |
| 15 | 0.023 | 31 | 0.025 | 52 | 0.038 |
| 20 | 0.005 | 34 | 0.015 | 53 | 0.020 |
| 24 | 0.015 | 37 | 0.015 | 59 | 0.043 |
| 25 | 0.022 | 42 | 0.015 | ||
| 27 | 0.011 | 44 | 0.012 |
T-test (unequal variance, one-sided) between the Baseline class and the Decreased SBP class. Maximum d0 when p= 0.05.
The individual t-test showed that there was a clear statistical difference between the mean RJ-intervals of the two classes being compared. While the individual maximum  varied, all of the subjects had non-zero distance. Varying
  ’s were attributed to different physiological conditions of the subjects and the degree of change in SBP during and after the VM. Some subjects’ SBP changed beyond the range of the Decreased and Increased SBP class whereas other subjects’ SBP marginally crossed the threshold, having the mean RJ-interval relatively closer to the baseline than the subjects who had greater changes in the parameters.
E. Relative RJ-Interval and SBP Analysis
A relative change has been investigated to assess its effect on the regional classifier. Percentage changes in SBP and the RJ-interval have been used instead of the absolute changes.
A number of steps were taken to simulate similar boundaries as the main analysis (i.e., usage of the absolute change). The average of all stable SBP regions of 48 subjects was equal to 103.6 mmHg. Applying the same criteria of ±20 to ±40 mmHg gives boundaries of 63.6, 83.6, 123.6, and 143.6 mmHg. These numbers translated to 61.2, 80.7, 119.4, and 138.7%. Based on these findings the boundaries for the relative change analysis was set to ±20 to ±40%. In other words, the Increased SBP class had boundaries of +20 to +40%, and the Decreased SBP class had boundaries of −20 to −40%. For each session, the RJ-interval and SBP have been converted to a percentage change based on the average of the stable region of the session. Same selection criteria and the NBC-based regional classifier as the main analysis were applied.
The best overall accuracy resulted from  of 40s and
  of 0.4. The main analysis had
  of 44s and
  of 0.5 as the best parameters, which are not very different from the relative change analysis. Based on the parameters, an aggregated t-test showed 8.9% separation of the means for the increased-SBP-baseline analysis and 11.1% separation for the decreased-SBP-baseline analysis. Given the average RJ-interval of stable regions across the sample space of 224.3ms, 8.9% and 11.1% translated to 20.0ms and 24.9ms which were close to that of the main analysis.
Relative change analysis had 36 qualified subjects and 85 sessions for the increased-SBP-baseline analysis – higher than that of the main analysis – but had a lower number of qualified subjects and sessions for the decreased-SBP-baseline (i.e., 18 subjects with 38 sessions).
Analysis without de-trending had the TPR, TNR, and accuracy of 83.5, 98.8, and 91.2% for the increased-SBP-baseline analysis, respectively. The TPR, TNR, and accuracy for the decreased-SBP-baseline analysis were 63.2, 97.4, and 80.3%. While the increased-SBP-baseline analysis had approximately the same results as the main analysis, the decreased-SBP-baseline analysis had slightly better results. With detrending, the TPR, TNR, and accuracy of the increased-SBP-baseline analysis were 89.4, 100, and 94.1%, and that of the decreased-SBP-baseline analysis were 89.5, 100, and 93.4%, which are very close to what was observed in the main analysis.
The conclusion based on the relative change analysis was that given a similar setting, there were aspects that each analysis showed strength. However, the overall performance of the algorithms remained on par.
F. Additional Discussion
The qualified subjects were examined in terms of gender. Forty-eight (48) subjects who were included in the analysis had 30 female and 18 male subjects. Thirty-four (34) subjects who were involved in the increased-SBP-baseline analysis consisted of 15 male and 19 female subjects, and 20 subjects who were involved in the decreased-SBP-baseline analysis consisted of nine male and 11 female subjects. Although there is no clear pattern in terms of the gender, a higher number of female subjects were excluded mainly due to not having enough change in SBP to have data points within the Increased SBP and the Decreased SBP class. Both analyses had balanced gender distributions.
The distributions of the three classes had overlaps as seen in Fig. 7. The overlapping distributions could have been a seemingly large source of error when the NBC was used to generate the output waveform. However, the behavior of SBP and the RJ-interval showed that the overlap is not of a great concern mainly because the data points of a single subject are not concentrated on one specific location but rather spread out to have a similar range as the aggregated distribution as shown in Fig. 12. In other words, because the RJ-interval changed from one end of the aggregated distribution (e.g., right end of the Decreased SBP class distribution) to another end (e.g., left end of the Increased SBP distribution), there was enough shift in the RJ-interval for the NBC to output non-zero values that were used to classify a region. There were some cases where the NBC produced fluctuating outputs, however, these fluctuations did not affect the regional classifier significantly. Therefore, the error caused by the overlapping distribution was minimal, which was reflected in the results.
FIGURE 12.
Distribution of data points of an individual subject. The individual distribution spanning across the range of the aggregated distribution enables the overlap of distributions while having a minimum error due to the overlap (m = 44s, w = 0.5, Subject 31 session 3).
In terms of the temporal resolution of the algorithm, there were cases where the detection consisted of a single heartbeat, which is the minimum resolution of the algorithm. As mentioned in the main text, the average duration of the Increased SBP class was 6.5 s, and that of the Decreased SBP class was 8.2 s. While the algorithm is sensitive to a level of a heartbeat, the optimal length of the window that elicits the lowest error should be investigated in the future. In addition, the average stable region was about 2.5 minutes long. Given the precaution to collect a sufficient data, the actual length of the required baseline may be much shorter. An envisioned implementation is that the baseline will be collected at the installment of the system and used daily to assess the health status.
Additional future works include incorporating the heart rate related parameters that are used to study autonomic failure such as Valsalva ratio and heart rate variability (HRV) in the next iteration of the classifier. A number of processes involved in this work such as feature measurement, labelling of data, and defining the stable region relied on a visual inspection, which will not be available in a realistic scenario. Making these tasks automatic is another part of the future works. While detecting a change in SBP has a great potential in studying and detecting symptoms of SH-OH or autonomic failure in general, the symptoms often occur in a combination of different states. For example, an autonomic failure during the VM is characterized as having a continuous decrease in BP (i.e., lack of recovery to the baseline) during the strain phase followed by a lack of overshoot in BP after the release.. [26]. This phenomenon can be translated as having a reduction in SBP (i.e., positive in the decreased-SBP-baseline analysis) follow by no change in SBP (i.e., negative in the increased-SBP-baseline analysis). The sequence of events such as this can be programmed via techniques such as a state-space model that can provide a classification (e.g., a diagnosis) of a condition based on the sequence of states.
Funding Statement
This work was supported in part by the AGE-WELL NCE Inc., and NSERC CREATE.
References
- [1].Shen W.et al. , “2017 ACC/AHA/HRS guideline for the evaluation and management of patients with syncope: A report of the american college of cardiology/american heart association task force on clinical practice guidelines and the heart rhythm society,” Circulation, vol. 136, no. 5, pp. e60–e122, 2017. [DOI] [PubMed] [Google Scholar]
- [2].da Silva R. M. F. L., “Syncope: Epidemiology, etiology, and prognosis,” Frontiers Physiol., vol. 5, p. 471, Dec. 2014. [DOI] [PMC free article] [PubMed] [Google Scholar]
- [3].Middlekauff H. R., Stevenson W. G., Stevenson L. W., and Saxon L. A., “Syncope in advanced heart failure: High risk of sudden death regardless of origin of syncope,” J. Amer. College Cardiol., vol. 21, no. 1, pp. 110–116, Jan. 1993. [DOI] [PubMed] [Google Scholar]
- [4].Sun B. C., “Quality-of-life, health service use, and costs associated with syncope,” Prog. Cardiovascular Diseases, vol. 55, no. 4, pp. 370–375, Jan-Feb 2013. [DOI] [PubMed] [Google Scholar]
- [5].Freeman R., “Consensus statement on the definition of orthostatic hypotension, neurally mediated syncope and the postural tachycardia syndrome,” Clin. Auton. Res., vol. 21, no. 2, pp. 69–72, Apr. 2011. [DOI] [PubMed] [Google Scholar]
- [6].Mar P. L. and Raj S., “Orthostatic hypotension for the cardiologist,” Current Opinion Cardiol., vol. 33, no. 1, pp. 66–72, Jan. 2018. [DOI] [PMC free article] [PubMed] [Google Scholar]
- [7].Mann D. L., Braunwald’s Heart Disease E-Book: A Textbook of Cardiovascular Medicine. Amsterdam, The Netherlands: Elsevier, 2014. [Google Scholar]
- [8].Naschitz J. E., Slobodin G., Elias N., and Rosner I., “The patient with supine hypertension and orthostatic hypotension: A clinical dilemma,” Postgraduate Med. J., vol. 82, no. 966, pp. 246–253, Apr. 2006. [DOI] [PMC free article] [PubMed] [Google Scholar]
- [9].Gehrking J. A., Hines S. M., Benrud-Larson L. M., Opher-Gehrking T. L., and Low P. A., “What is the minimum duration of head-up tilt necessary to detect orthostatic hypotension?” Clin. Auton. Res., vol. 15, no. 2, pp. 71–75, Apr. 2005. [DOI] [PubMed] [Google Scholar]
- [10].Klabunde R. E., Cardiovascular Physiology Concepts. Baltimore, MD, USA: Williams & Wilkins, 2011. [Google Scholar]
- [11].Biaggioni I., “The pharmacology of autonomic failure: From hypotension to hypertension,” Pharmacol. Rev., vol. 69, no. 1, pp. 53–62, Jan. 2017. [DOI] [PMC free article] [PubMed] [Google Scholar]
- [12].Shannon J., Jordan J., Costa F., Robertson R. M., and Biaggioni I., “The hypertension of autonomic failure and its treatment,” Hypertension, vol. 30, no. 5, pp. 1062–1067, Nov. 1997. [DOI] [PubMed] [Google Scholar]
- [13].Benarroch E., Freeman R., and Kaufmann H., “Autonomic nervous system,” in Textbook of Clinical Neurology, Goetz C. G., Ed., 3rd ed. Philadelphia, PA, USA: W. B. Saunders, 2007, ch. 21, pp. 383–404. [Google Scholar]
- [14].Phillips E. L. and Donofrio P. D., “Autonomic disorders,” in Encyclopedia of Neuroscience, Squire L. R., Ed. Oxford, U.K.: Academic, 2009, pp. 799–808. [Google Scholar]
- [15].Boger J.et al. , Zero Effort Technologies: Considerations, Challenges and Use in Health, Wellness, and Rehabilitation, 2nd ed. San Rafael, CA, USA: Morgan & Claypool, 2018. [Google Scholar]
- [16].Inan O. T.et al. , “Ballistocardiography and seismocardiography: A review of recent advances,” IEEE J. Biomed. Health Inform., vol. 19, no. 4, pp. 1414–1427, Jul. 2015. [DOI] [PubMed] [Google Scholar]
- [17].Couceiro R.et al. , “Real-time prediction of neurally mediated syncope,” IEEE J. Biomed. Health Inform., vol. 20, no. 2, pp. 508–520, Mar. 2016. [DOI] [PubMed] [Google Scholar]
- [18].Etemadi M.et al. , “Tracking clinical status for heart failure patients using ballistocardiography and electrocardiography signal features,” in Proc. 36th Annu. Int. Conf. IEEE Eng. Med. Biol. Soc., Aug. 2014, pp. 5188–5191. [DOI] [PMC free article] [PubMed] [Google Scholar]
- [19].Jung D. W., Hwang S. H., Yoon H. N., Lee Y.-J. G., Jeong D.-U., and Park K. S., “Nocturnal awakening and sleep efficiency estimation using unobtrusively measured ballistocardiogram,” IEEE Trans. Biomed. Eng., vol. 61, no. 1, pp. 131–138, Jan. 2014. [DOI] [PubMed] [Google Scholar]
- [20].Etemadi M., Inan O. T., Wiard R. M., Kovacs G. T. A., and Giovangrandi L., “Non-invasive assessment of cardiac contractility on a weighing scale,” in Proc. IEEE Conf. Eng. Med. Biol. Soc., Sep. 2009, pp. 6773–6776. [DOI] [PubMed] [Google Scholar]
- [21].Shin J. H., Lee K. M., and Park K. S., “Non-constrained monitoring of systolic blood pressure on a weighing scale,” Physiol. Meas., vol. 30, no. 7, pp. 679–693, 2009. [DOI] [PubMed] [Google Scholar]
- [22].Ashouri H., Orlandic L., and Inan O. T., “Unobtrusive estimation of cardiac contractility and stroke volume changes using ballistocardiogram measurements on a high bandwidth force plate,” Sensors, vol. 16, no. 6, p. 787, May 2016, doi: 10.3390/s16060787. [DOI] [PMC free article] [PubMed] [Google Scholar]
- [23].Bae M. H., “Clinical characteristics of defecation and micturition syncope compared with common vasovagal syncope,” Pacing Clin. Electrophysiol., vol. 35, no. 3, pp. 341–347, Mar. 2012. [DOI] [PubMed] [Google Scholar]
- [24].Ketch T., Biaggioni I., Robertson R., and Robertson D., “Four faces of baroreflex failure: Hypertensive crisis, volatile hypertension, orthostatic tachycardia, and malignant vagotonia,” Circulation, vol. 105, no. 21, pp. 2518–2523, 2002. [DOI] [PubMed] [Google Scholar]
- [25].Low P. A., “Valsalva maneuver,” in Encyclopedia of the Neurological Sciences, Aminoff M. J. and Daroff R. B., Eds., 2nd ed. Oxford, U.K.: Academic, 2014, pp. 591–592. [Google Scholar]
- [26].Goldstein D. S., Pechnik S., Holmes C., Eldadah B., and Sharabi Y., “Association between supine hypertension and orthostatic hypotension in autonomic failure,” Hypertension, vol. 42, no. 2, pp. 136–142, 2003. [DOI] [PubMed] [Google Scholar]
- [27].Chang I. S., Javaid A. Q., Boger J., Arcelus A., and Mihailidis A., “Design and evaluation of an instrumented floor tile for measuring older adults’ cardiac function at home,” Gerontechnology, vol. 17, no. 2, pp. 77–89, 2018. [Google Scholar]
- [28].Pan J. and Tompkins W. J., “A real-time QRS detection algorithm,” IEEE Trans. Biomed. Eng., vol. BME-32, no. 3, pp. 230–236, Mar. 1985. [DOI] [PubMed] [Google Scholar]
- [29].Javaid A. Q., Ashouri H., and Inan O. T., “Estimating systolic time intervals during walking using wearable ballistocardiography,” in Proc. IEEE-EMBS Int. Conf. Biomed. Health Inform. (BHI), Feb. 2016, pp. 549–552. [Google Scholar]
- [30].Etemadi M., Inan O. T., Giovangrandi L., and Kovacs G. T. A., “Rapid assessment of cardiac contractility on a home bathroom scale,” IEEE Trans. Inf. Technol. Biomed., vol. 15, no. 6, pp. 864–869, Nov. 2011. [DOI] [PubMed] [Google Scholar]
- [31].Ernst G., Heart Rate Variability. London, U.K.: Springer, 2013. [Google Scholar]
- [32].(Dec. 22, 2017). What are Valsalva Maneuvers, and are They Safe? [Online]. Available: https://www.healthline.com/health/valsalva-maneuver
- [33].Chobanian A. V.et al. , “Seventh report of the joint national committee on prevention, detection, evaluation, and treatment of high blood pressure,” Hypertension, vol. 42, no. 6, pp. 1206–1252, Aug. 2004. [DOI] [PubMed] [Google Scholar]
- [34].Murphy K. P., Machine Learning—A Probabilistic Perspective. Cambridge, MA, USA: MIT Press, 2012. [Google Scholar]
- [35].Baek H. J., Chung G. S., Kim K. K., and Park K. S., “A smart health monitoring chair for nonintrusive measurement of biological signals,” IEEE Trans. Inf. Technol. Biomed., vol. 16, no. 1, pp. 150–158, Jan. 2012. [DOI] [PubMed] [Google Scholar]


