Abstract
Heating, ventilation, and air conditioning (HVAC) systems are among the most common methods to improve indoor air quality. However, after long-term operation, the HVAC filter can result in a proliferation of bacteria, which may release into the filtered air subsequently. This issue can be addressed by designing antibacterial filters. In this study, we report an iron oxide nanowires-based filter fabricated from commercially available iron mesh through a thermal treatment. At optimal conditions, the filter demonstrated a log inactivation efficiency of > 7 within 10 seconds towards S. epidermidis (Gram-positive), a common bacterial species of indoor bioaerosol. 52 % of bioaerosol cells can be captured by a single filter, which can be further improved to 98.7 % by connecting five filters in-tandem. The capture and inactivation capacity of the reported filter did not degrade over long-term use. The inactivation of bacteria is attributed to the synergic effects of the hydroxyl radicals, electroporation, and Joule heating, which disrupted the cell wall and nucleoid of S. epidermidis, as verified by the model simulations, fluorescence microscopy, electron microscopy, and infrared spectroscopy. The relative humidity plays an important role in the inactivation process. The filter also exhibited a satisfactory inactivation efficiency towards E. coli (Gram-negative). The robust synthesis, low cost, and satisfactory inactivation performance towards both Gram-positive and Gram-negative bacteria make the filter demonstrated here suitable to be assembled into HVAC filters as an antibacterial layer for efficient control of indoor bioaerosols.
Keywords: Bioaerosols, Hydroxyl radicals, Electroporation, Joule heating, Iron oxide nanowires
Table of contents
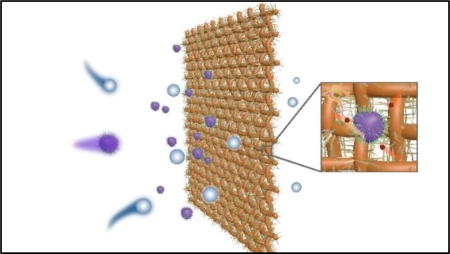
Iron oxide nanowires-based filter shows promise for the efficient control of indoor air bioaerosol.
Introduction
The increased amount of time spent indoors by people (from 80% to 90% over the last years in the U.S.) have resulted in a strong demand for improved indoor air quality.1 However, both the human activities and wide use of chemicals in built environment produce particulate and gaseous pollutants in indoor air,2 which may cause serious health problems.3 One of the most common methods to improve indoor air quality is to increase the ventilation rates through heating, ventilation, and air conditioning (HVAC) systems. Increased ventilation benefits not only the dilution of indoor air pollutants4 but also the control of particulate matters with the aid of HVAC filters.5 However, HVAC system could also become a microbial breeding ground. For example, under relatively wet (> 80% relative humidity (R.H.)) and warm (> 12 °C) outdoor air conditions, a proliferation of bacteria on the filter occurred with a subsequent release into the filtered air.6 In consequence, increasing attention has been paid to prohibit the growth of bacteria in HVAC systems and the subsequent release of bacteria into indoor environment.4
Ultraviolet (UV) irradiation is one of the promising methods due to its high efficiency in bioaerosol control. The high energy of UV light results in the damage of the RNA/DNA of bacteria.7, 8 However, the installation of UV lights should be very careful to avoid any potential risks to occupants, thus limiting its applications.4 Several other emerging technologies have also been proposed, such as photocatalytic oxidation,9–11 plasma,12–14 and microwave.15, 16 Specifically, photocatalytic oxidation produces reactive oxygen species (ROS), such as hydroxyl radicals (•OH), to disinfect bioaerosols. However, this technology may need a complete renovation of the current HVAC system to make light available. The plasma and microwave methods generally require high voltage/power and are thus energy inefficient. We also found that all the above efforts require either new functional unit (UV, photocatalysis, and microwave), or the transformation of current HVAC systems (plasma). A more feasible approach would be the modification of the existing air filters. It is expected that incorporating an antimicrobial layer will achieve efficient control of indoor air bioaerosol.17
Only limited studies have reported the modification of air filters for antimicrobial properties, such as the addition of chemicals or Ag-based nanomaterials onto the filter.18–21 However, these chemicals/materials are relatively expensive and may cause potential risks to human health. A more safe and cost-efficient approach is thus urgently desirable. To address this issue, we fabricated a filter by growing iron oxide nanowires (IO NWs) on commercially available iron mesh through a robust and cost-efficient way, which potentially can be assembled into the HVAC filters to capture and kill bacteria in a rapid manner. With the aid of low direct voltage, the IO NWs can react with oxygen and water in the air to produce •OH. Meanwhile, the electrical field also increased significantly near the tips of the IO NWs and led to electroporation and Joule heating effects. All these mechanisms contributed to the rapid inactivation of bacteria on the filter. To demonstrate the promising features, we also investigated the performance of the filter by varying the parameters including applying voltage, time, and humidity, with Staphylococcus epidermidis (S. epidermidis) and Escherichia coli (E. coli) as model bacteria. By analyzing the characteristics of bacteria before and after the treatment, possible inactivation mechanisms were proposed. We also demonstrated that connecting several IO NWs filters in-tandem could be promising for practical applications. We expect that this filter can be assembled into conventional HVAC filters and achieve the inactivation of the released bacteria from conventional filters.
Materials and Methods
Iron Oxide Nanowires on Iron Mesh
IO nanowires were synthesized on the basis of a recent protocol with modification.22 Iron mesh (from McMaster-Carr, 60 × 60 mesh, wire diameter = 190 µm) was casted into a circular shape with a diameter of 5 cm. The casted iron mesh was then washed with 1 M hydrochloric acid to remove the oxide layer and then rinsed with ultrapure water thoroughly (18.2 MΩ·cm). After drying in a vacuum desiccator, the iron mesh was heated in air at 700 °C for 6 h to grow IO nanowires on the mesh. The temperature rising rate was set to be 5 °C/min.
Inactivation of Bacteria
S. epidermidis (ATTC # 14990) was selected because it is found in various built environment and is recommended by ISO 14698-1 for testing the biological efficiency of air samplers.23 The suspension of S. epidermidis for bioaerosol generation was prepared according to a previous protocol.23 The nutrient medium was prepared by mixing 5 g of peptone (from Sigma Aldrich), 3 g of meat extract (from Sigma Aldrich), and 1000 mL of ultrapure water. E. coli (ATCC # 15597) was grown in Luria-Bertani broth (LB broth; Fisher). E. coli suspension was prepared according to a previous study.24
The set-up of the bacterial inactivation experiment consists of several components, including a bioaerosol generator, a humidity control system, and an inactivation chamber, as schematically shown in Fig. S1. All the equipment was rinsed by ethanol (70%) and sterilized by UV light irradiation for 10 min before each experiment. In a typical experiment, bioaerosols containing bacteria were generated by an atomizer. Then, bioaerosols were fed into a cylindrical chamber (length = 30 cm, diameter = 5 cm) with air as the carrier gas. The relative humidity in the chamber was controlled by tuning the flow rate ratio between dry air and wet air. Meanwhile, the total air flow rate was maintained constant (0.5 L/min), ensuring consistent resident time of bacteria in the chamber. The air flow velocity in the chamber was calculated to be ~ 0.005 m/s. The R.H. was monitored by a humidity sensor (McMaster, 32705K11). The voltage (0 – 4.5 V) applied on a single piece of filter was tuned by a home-made DC power supply. In a typical experiment, after running the system for specific times (0–30 s, unless mentioned elsewhere), both the atomizer and power supply were turned off immediately. The IO NWs filter was transferred into 20 mL of phosphate-buffered solution (PBS, 0.1 M) to measure the bacterial concentrations of S. epidermidis on the IO filter (captured). More experimental details are shown in Fig. S1. The number of bacteria in the exhaust (escaped) was also obtained by measuring its concentration in the exhaust PBS buffer (20 mL, behind the chamber). After being vortexed for 1 min (5000 rpm), each sample was serially diluted, plated in three duplicates, and incubated at 37 °C for 24 h for measurements. Resuspending the filter into the buffer solution to measure the bacteria concentration was verified to be applicable (Fig. S1).
Characterization and Measurements
The morphology and size of the samples were analyzed with a Hitachi Su-70 field emission scanning electron microscope (FE-SEM). The structure of the samples was analyzed by a JEOL JEM-1230 transmission electron microscope (TEM). The accelerating voltage was set to be 100 kV. To prepare the samples for TEM characterization, IO NWs were scratched from the mesh and then dispersed in ethanol. The ethanol solution was drop casted on a Cu grid for TEM characterization. To prepare the bacterial samples for SEM and TEM analysis, a protocol from a previous study was followed.24, 25 Optical images were obtained with an optical microscope (Scope.A1, Zeiss). The crystallinity was characterized by a PANalytical X’Pert Pro MPD X-ray diffractometer (XRD) equipped with a Cu-Kα radiation source (λ = 1.5401 Å). X-ray photoelectron spectroscopy (XPS, Thermo Fisher ESCAlab 250) was used to determine the valance state of Fe on the filter. The characterization of surface chemistry of S. epidermidis before and after inactivation was carried out by using a Fourier transform infrared (FTIR) spectrometer (Nicolet iS50, Thermo Fisher Scientific). S. epidermidis was collected from its suspension by centrifugation, dried at 37 °C for 2 h in an oven prior to the FTIR analysis. The strength of fluorescence signal was quantified by a Guava® EasyCyte Flow Cytometer. For fluorescent microscope assay, 1 mL of cells suspensions were centrifuged and resuspended in 10 µl of PBS. Cell suspensions were stained with a live/dead staining kit (Molecular Probes, Invitrogen) in darkness for 1 h. Fluorescence images were obtained with a Zeiss Axiovert 200M fluorescent microscope (Zeiss, German). To detect •OH using fluorescence technique, the IO NWs filter was collected and transferred into 20 mL of DI water after being operated at 4.5 V for certain time. Hydroxyl radicals were detected using a fluorescent method as we previously reported.26 Specifically, after the bacterial cells were separated from the filter by centrifugation, the water sample was mixed with coumarin solution (10−3 M) for fluorescence analysis (QuantaMaster 400, PTI). To investigate the effect of •OH on the inactivation performance, dimethyl sulfoxide (DMSO) was used as a quenching agent of •OH. Specifically, the PBS solution of DMSO (1 mM, 10 mM, and 100 mM) was mixed with the suspension of S. epidermidis, respectively, which was then subject to the atomizing step. The concentration of live S. epidermidis on the IO NWs filter was then measured as described in the section of Inactivation of Bacteria. A hemocytometer was used to prove the possible lysis of S. epidermidis after treatment (condition: 4.5 V and 30 min). After treatment, the filter was resuspended in PBS buffer, which was centrifuged and concentrated into 1 mL of PBS. The produced cells pellets were stained with 0.4 % crystal violet for 5 min at room temperature. After being washed with PBS buffer for three times, the pellets were resuspended into 1 mL of PBS and counted by the hemocytometer. Same protocol was employed for a controlled experiment in which no external voltage was applied (denoted as before treatment samples).
Results and Discussion
Characterization of IO NWs
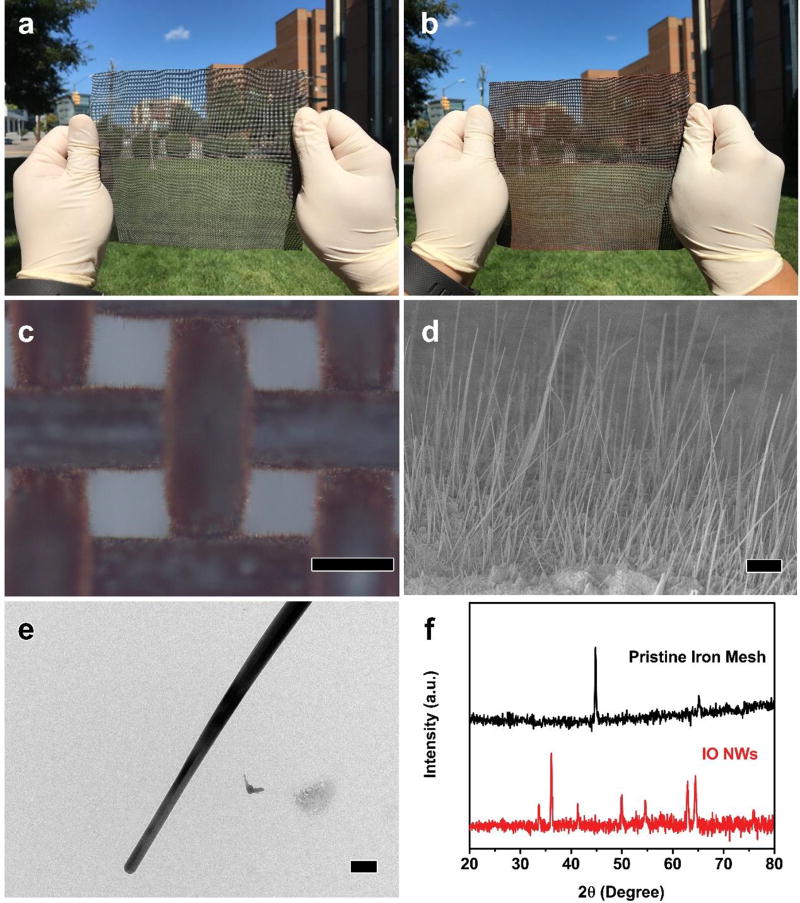
Iron mesh was chosen as the substrate for the IO NWs growth because of its strong mechanical strength and potential use as the frame and/or pre-filter of conventional air filters. The pristine iron mesh (size = 15 × 20 cm2) is of metallic color (Fig. 1a). After thermal treatment in air at 700 °C for 6 h, the color turns to be burgundy (Fig. 1b). The optical microscopy images show that the surface of the pristine iron mesh is shiny and clean (Fig. S2). After thermal treatment, the surface of iron mesh is fully covered by nanowires (Fig. 1c). Closer observation reveals that the average length of the nanowires is 13 µm (Fig. 1d) and the average diameter is 120 nm (Fig. 1e). As shown in the optical microscopy image and SEM images, the coverage of the nanowires on the iron mesh is uniform and complete. To verify the composition of the nanowires, we carried out the XRD analysis. As shown in Fig. 1f, the XRD patterns of the pristine iron mesh possess two peaks (2θ = 45 and 65 °), which are indexed to be metallic Fe (PDF no. 87-722). The peaks of the sample after thermal treatment are indexed to Fe2O3 (PDF no. 84-310), suggesting that the nanowires are Fe2O3.22 The formation of NWs at elevated temperature is attributed to the relaxation of the compressive stresses resulted from the transformation at the interface among the iron with different valence.22, 27 It is expected that this synthesis can be further scaled up for potential applications.
Fig. 1.
Digital images of the pristine iron mesh (a) and iron mesh with IO NWs (b). Optical microscopy image (c), SEM image (d), and TEM image of the IO NWs on the iron mesh. (f) XRD patterns. Scale bars in (c), (d), and (e) represent 200 µm, 5 µm, and 200 nm, respectively.
Inactivation Efficiency
The concentration of S. epidermidis stock suspension was ~ 109 CFU/mL, as determined by the standard spread plating technique. The R.H. in the chamber was maintained at 50 ± 3%. We considered the pristine iron mesh of being little inactivation ability when the external voltage was 0 V (Fig. S1). Meanwhile, under this condition, the amount of live S. epidermidis on pristine iron mesh increased slightly with a longer operation time. Similar phenomenon was also observed for the IO NWs filter (Fig. S3). We also found a higher concentration of live S. epidermidis on the IO NWs than on the pristine iron mesh, which is probably due to the brush-like structure of IO NWs on the mesh opening and the increased surface area of IO NWs compared with the pristine iron wires. Due to the large opening size of the iron mesh in this study, some bacteria could escape from the IO NWs filter. We calculated the ratio of captured bacteria by IO NWs under different conditions as follows,
| (1) |
where rcaptured is the ratio of captured bacteria, Ncaptured is the number of captured bacteria by the filter and Nescaped is the that of escaped bacteria from the filter. We found that the capture efficiency of IO NWs filter was ~ 52 % at 0 V and only varied slightly with the treatment time (10–30 s), as shown in Table S1. We also noted that the number of escaped bacteria from the filter is only dependent on treatment time, and independent on the external voltage (Table S2). Since the total amount of bacteria in the feeding air should be constant for certain treatment time, the captured bacteria was also considered to be only dependent on treatment time. As a result, the log inactivation efficiency can be calculated as follows,
| (2) |
where E is the log inactivation efficiency, C(t,V) is the concentration of live S. epidermidis on the IO NWs filters after the treatment at V volt and t seconds, C(t,0) is the live concentration of S. epidermidis on the IO NWs filters after the treatment at 0 volt and t seconds.
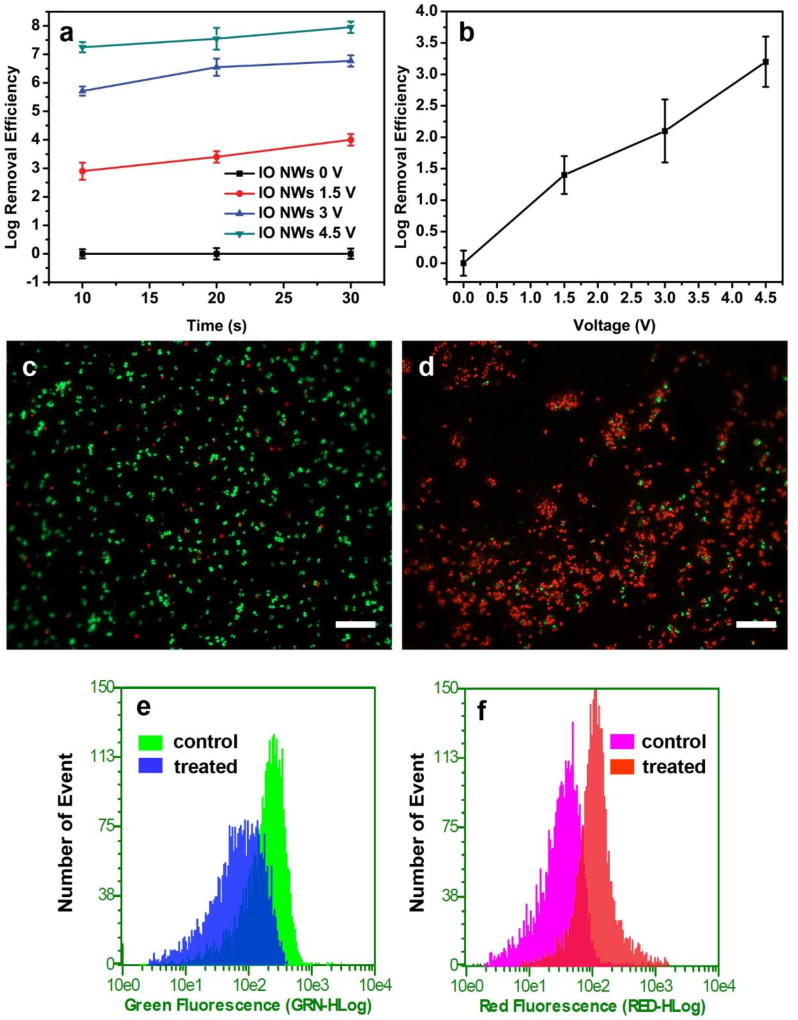
The IO NWs filters achieved ~ 3 log inactivation efficiency under the condition of 1.5 V and 10 s. Notably, either increase of treatment time or applied voltage boosted the log inactivation efficiency (Fig. 2a). For example, by prolonging the treatment time from 10 s to 30 s, the log inactivation efficiency increased to ~ 4. Meanwhile, by increasing the voltage from 1.5 V to 4.5 V, the log inactivation efficiency increased to > 7. Considering the potential application as air filters, where a rapid inactivation performance is more desirable, we set the operation parameters to 4.5 V and 10 s for our further studies. On the contrary, the pristine iron mesh filter only exhibited relatively poor capacity of inactivation compared to the IO NWs filter. Specifically, even when 4.5 V was applied, the log inactivation efficiency of the pristine iron mesh filter was ~ 3.1 (Fig. 2b). The different performances between the two types of filters are discussed in the mechanism section.
Fig. 2.
(a) Inactivation efficiency of IO NWs filter under different conditions. (b) Control experiments using pristine iron mesh, operation time was 10s. Fluorescence microscope images of S. epidermidis before treatment (control) (c) and after treatment (4.5 V, 10 s) (d). (e) and (f) are the flow cytometry results of samples in (c) and (d). The scale bars in (c) and (d) represent 20 µm.
To further confirm the inactivation performance of the IO NWs filter, the Baclight™ kit fluorescent microscopic method was employed.10 The live bacterial cells only accumulate SYTO 9 to emit green fluorescence, on the other hand, the dead bacterial cells accumulate both SYTO 9 and propidium iodide and emit red fluorescence. Before treatment, most of the bacterial cells exhibit green fluorescence (Fig. 2c). On the contrary, after treatment at 4.5 V for 10 s, most of the bacterial cells showed red fluorescence, indicating that the cell membrane of most S. epidermidis was damaged after treatment (Fig. 2d).14, 28 We also analyzed the dead/live bacterial cells using a flow cytometry. Flow cytometry records measurements from individual cells and can process thousands of cells (5,000 cells in our experiment).29 The area plotted in Figs. 2e and 2f represent bacterial populations that emit green and red fluorescence, respectively. As shown in Fig. 2e, flow cytometry data illustrate a left-shift of peak position, indicating that the population of live cells decreased after treatment. Similarly, the right-shift of peak position in Fig. 2f suggests the population of dead cells increased after treatment.
Characterization of S. epidermidis During Inactivation
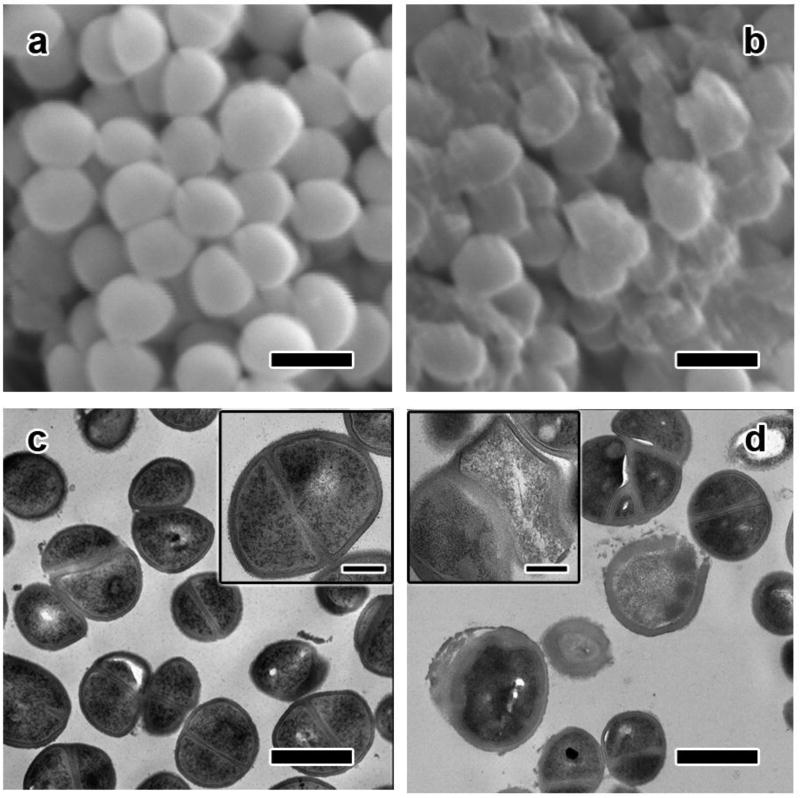
The staining experiments in Figs. 2c, 2d, 2e, and 2f indicate that the membrane integrity of treated S. epidermidis is damaged after the inactivation process.14, 30 To further confirm the changes of bacterial cells before and after treatment, we conducted SEM and TEM analyses. The SEM image of S. epidermidis cells before inactivation shows that the cells are of spherical shape and uniform size (Fig. 3a). Meanwhile, the surface of the bacterial cells is smooth and the membrane is complete. However, after treatment, the cellular structure of S. epidermidis experienced serious damage. Some of the cells were deformed, with shrinking of cell and leakage of cell inclusions. Some pores were also observed. Meanwhile, some other cells were broken down into debris (Fig. 3b). These changes were further confirmed by TEM analysis. As shown in Fig. 3c, S. epidermidis cells before treatment had uniform and complete cell wall structures. Meanwhile, the cytoplasm inside the cell wall was dense and homogeneous (inset in Fig. 3c). On the contrary, after treatment, many of S. epidermidis cells were seriously damaged into irregular contours (Fig. 3d). Specifically, the cell wall of some bacteria was much thinner or even seriously distorted. Some pores on the cell wall were again observed. The distorted cell wall also resulted in the less dense cytoplasm inside (inset in Fig. 3d). These electron microscope results are consistent with the results shown in Fig. 2, since only dead cells can accumulate propidium iodide and emit red fluorescence due to their disrupted cell wall.
Fig. 3.
SEM images of S. epidermidis cells before (a) and after (b) treatment. TEM images of S. epidermidis cells before (c) and after (d) treatment. Scale bars in (a), (b), (c), and (d) represent 1 µm. Scale bars in the insets represent 500 nm.
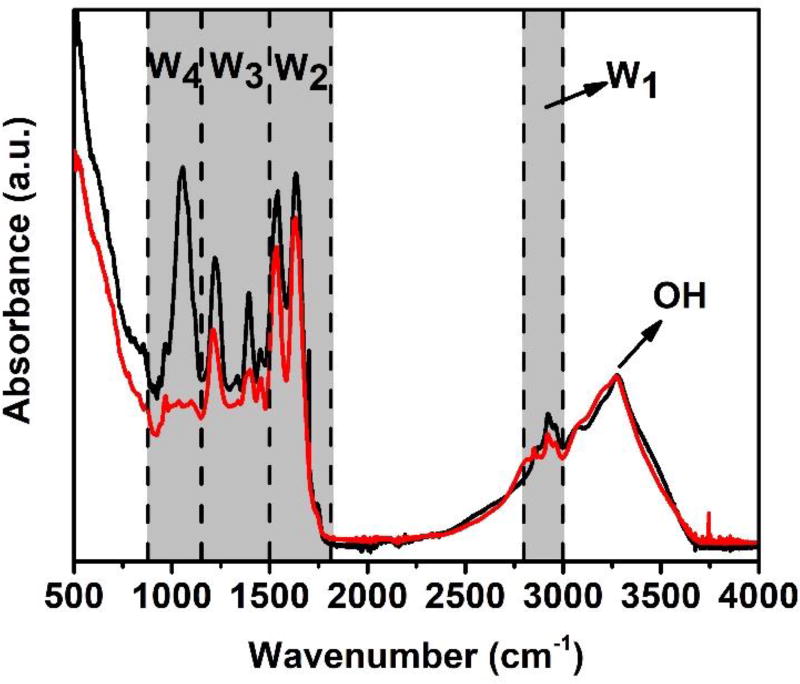
We further conducted FTIR analysis of the bacteria before and after treatment, because FTIR spectra comprise the vibrational characteristics of all cell constituents, including DNA/RNA, protein, membrane and cell-wall components.31 As shown in Fig. 4, the spectra of fresh and treated bacteria showed similar patterns. For example, the wide peaks which distribute across 3000 to 3500 cm−1 correspond to the vibration of -OH due to enhanced hydration of bacteria.32 However, we observed a slight change in W1 region in Fig. 4 for the bacteria after treatment. This change indicates a possible damage of bacteria membrane, since W1 is dominated by the stretching vibrations of some carbon-hydrogen bonds, which usually present in the fatty acid components of the various membrane amphiphiles.31, 33 In W2 region, even though the two major peaks remain consistent, two peak shoulders at longer wavenumber disappeared after inactivation process, implying the damage of proteins and peptides.31, 33 We also notice that the peak at 1335 cm−1 in region W3 weakens for bacteria after treatment. This phenomenon indicates the possible change of proteins, fatty acids and phosphate-carrying compounds.31, 33 Notably, the peak at 1057 cm−1 in region W4 completely disappeared after treatment, indicating the serious damage of the carbohydrates present within the cell wall.31, 33 The FTIR results were consistent with the SEM and TEM analyses.
Fig. 4.
FTIR spectra of bacteria before treatment (black curve) and after treatment (red curve).
Inactivation Mechanism
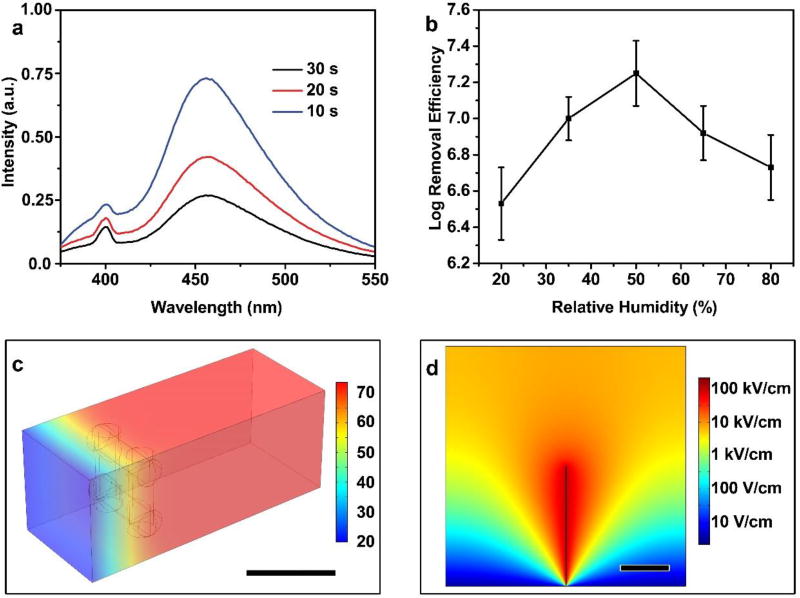
Notably, we found that •OH was generated in the system. As shown in Fig. 5a, a major fluorescence peak was identified at 455 nm, which verifies the generation of •OH.34 The evolution of the spectra obtained at different times clearly verified the accumulation of •OH on the IO NWs filter. The production of •OH was possibly due to Fenton-like reactions since iron oxide nanomaterials can serve as strong catalysts for these reactions.35–37 As the primary agent for Fenton-like reaction, H2O2 could be produced through a two-electron oxygen activation, where the electrons transfer from iron core to the iron oxide shell surface.37 Meanwhile, it has also been reported that some electrochemical reactions among electrons, oxygen, and water are able to produce H2O2.38 The produced H2O2 then decomposes to generate •OH, with iron oxide as catalysts.36, 39 This hypothesized mechanism for •OH generation was further strengthened when no fluorescence peak was observed for the system without applying external voltage (data not shown). •OH has been proven to be highly efficient to damage cells.40 On the other hand, H2O2 is a strong oxidant itself which can kill bacteria.41 Since iron species are critically important for the Fenton-like reactions, the different performance between pristine iron mesh and IO NWs mesh can be partially attributed to the increased surface area of IO NWs compared to pristine iron mesh. The increased surface area of IO NWs is accompanied with more exposed iron atoms, which thus facilitate the Fenton-like reactions.
Fig. 5.
(a) Evolution of fluorescence spectra for the detection of •OH with time. (b) Effect of R.H. on the log inactivation efficiency of S. epidermidis by IO NWs filter, the voltage was 4.5 V and the treatment time was 10 s. (c) Simulated temperature distribution around the filter, air flow rate = 0.005 m/s, unit in the scale bar is °C. Simulation details are presented in the Supporting Information. (d) Simulated electrical field near an IO NW, the voltage was set to be 4.5 V. Scale bars in (c) and (d) represent 600 µm and 5 µm, respectively.
Humidity is an important parameter for indoor air quality control. As a result, we investigated the effect of R.H. ranged from 20% to 80%, slightly wider than the comfortable range for human (25 – 60%), on the inactivation performance of the filter. The results of S. epidermidis inactivation indicated that a log inactivation efficiency of ~ 6.5 was achieved at 20% R.H. (Fig. 5b). Higher inactivation efficiency was recorded when R.H. was increased to 50%. However, further increase of R.H. has a negative effect on the inactivation performance. The reduced inactivation performance of IO NWs filter at low R.H. is attributed to the low amount of water molecules available under this condition. Since water is the primary reactive agent in this system, its inadequacy could limit the production of both H2O2 and •OH, thus resulting into a lower inactivation performance of the system. On the contrary, when R.H. is high, multiple layers of adsorbed water could be formed on the surface of IO NWs, which reduces the number of available sites for oxygen molecules on the surface of IO NWs,42 thus limiting the generation of H2O2 and •OH.
According to several previous studies employing •OH to inactivate bacteria, it usually takes tens of minutes or even hours to achieve log inactivation efficiency of > 7.9, 43, 44 Nevertheless, it only took tens of seconds to achieve such a high inactivation efficiency in our study. This huge difference suggests that other mechanisms may also be responsible for the rapid inactivation rate in our system, such as electric voltage and the associated Joule heating. The effects of electric voltage and Joule heating were elucidated by a control experiment, in which DMSO was used as the quenching agent for •OH because DMSO is non-lethal to S. epidermidis (Fig. S4).45 As shown in Fig. S5, when the voltage was maintained at 4.5 V, the log inactivation efficiency decreased from 7.2 to 6.2 when the concentration of DMSO increased from 0 to 100 mM. Compared to the results shown in Fig. 2b, the presence of DMSO had limited effect on the inactivation performance. These results confirmed that •OH produced by Fenton-like reactions only contributed in part to the rapid inactivation performance of the IO NWs filter.
The temperature of the IO NWs filter was increased when certain voltage was applied due to the Joule heating effect. As shown in Fig. S6, the temperature of the IO NWs filter (without air flow) increased with increasing voltage. At 0 V, the temperature of the filter is close to room temperature (23.2 °C). However, the temperature increased to 71.5 °C at 4.5 V. We also calculated the temperature gradient around the IO NWs filter, and found that not only IO NWs filter, the air in both the inflow and outflow directions was also heated (Fig. 5c). According to the simulation results (simulation details see Supporting Information and Fig. S7), the temperature of the mesh was increased significantly even at high air flow rate (59 °C for air velocity = 5 m/s, 71 °C for air velocity = 0.5 m/s, Fig. S8). Thermal treatment is one of the most widely used methods for inactivation of bacteria.46 To elucidate the effect of Joule heating on the performance of the filter, we conducted a control experiments to exclude the effects of electricity and Fenton-like reactions. 50 µL of bacterial suspension was injected into a PCR tube (three duplicates) and then subject to thermal treatment in a thermal cycler. The samples in the tubes was heated at 71 °C for 10 s, quickly cooled down to 4 °C, and then treated by standard plate culture technique. A log inactivation efficiency of > 7 was measured, indicating that the effect of Joule heating on the inactivation could be significant in this system.
The electrical field near the IO NWs was also enhanced significantly to a magnitude of 100 kV/cm (Fig. 5d), which builds intense dipole-dipole interactions with the lipid bilayer of the cell membrane, resulting in thinning of the membrane and finally electroporation pores immediately.24, 47–49 These phenomenon were consistent with the SEM and TEM results (Fig. 3).24 The electroporation effect due to the NW structure was further verified by comparing the performance of IO NWs filter and IO nanoparticles (NPs) filter (Fig. S9). Under the same condition, the log inactivation efficiency was ~ 6.4 for IO NPs filter, lower than 7.2 for IO NWs filter, suggesting that the electroporation effect resulted from NW also contributed in part to the performance of the system. The electroporation effect also accounted for the poor performance of pristine iron mesh since it is reasonable to believe the bulk iron cannot improve the electrical field significantly.
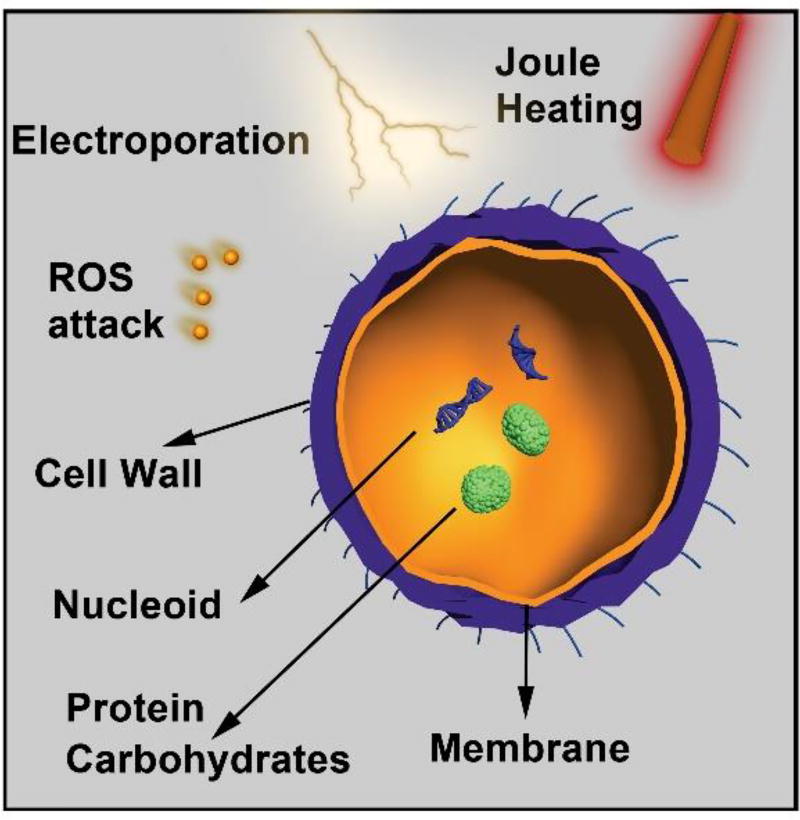
Based on above discussion, we proposed the possible bacteria inactivation mechanisms as follows. Some S. epidermidis cells can be captured by the IO NWs filter when the bioaerosols pass through the filter. In the presence of electricity, •OH was generated possibly due to Fenton-like reactions. Meanwhile, the electrical field near the tips of IO NWs is enhanced significantly and leads to the electroporation damage of cells. The increased temperature due to Joule effect also contributed significantly to the system. All these effects worked collaboratively to damage the cell wall and nucleoid of S. epidermidis (Fig. 6) rapidly, leading to immediate death of the bacterial cells. The relative importance of these three effects follows this order: Joule heating > hydroxyl radicals > electroporation.
Fig. 6.
Schematic illustration of the inactivation mechanism of S. epidermidis.
To further demonstrate the inactivation performance of the IO NWs filter on Gram-negative bacteria, E. coli was used as the target bacterium. A log inactivation efficiency of ~ 7.6 was achieved under the operational conditions (4.5 V and 10 s), suggesting a promising feasibility of the filter for practical applications in inactivation of both Gram-positive and Gram-negative bacteria.
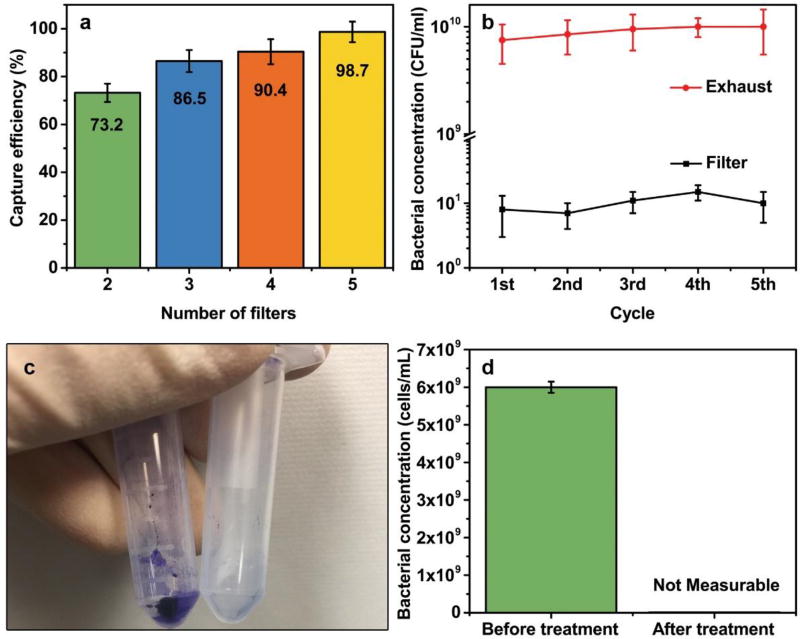
As we discussed before, the capture efficiency of a single IO NWs filter was ~ 52 %, which may be low for practical applications. A higher capture efficiency can be achieved by using denser iron meshes or connecting several IO NWs filter in-tandem. In this study, we improved the capture efficiency of the IO NWs filter through the latter method. Five tandem IO NWs filters could capture 98.7 % of bacteria in the air (Fig.7a) under the experimental conditions of 4.5 V and 10 s. The performance of long-term use was also evaluated by continuously operating the system for 5 cycles (1 h for each cycle) with an external voltage of 4.5 V. We replaced the stock solution for fresh ones after each cycle, so that bioaerosol concentration was constant throughout the experiment. After each cycle, the bacterial concentration in the exhaust buffer was counted to tell the changes of capture efficiency of the IO NWs filter. As shown in Fig. 7b, the bacterial concentration in the exhaust PBS buffer only increased slightly after each cycle, indicating that the capture capability of IO NWs filter only decreased slightly over time. This phenomenon was contrary to our expectation that the filer may be stuffed by dead bacteria so that it cannot capture any fresh bacteria. The reasonably stable capture efficiency could be ascribed to the lysis of the bacteria under the experimental conditions. Without external voltage, IO NWs filter captured a significant amount of S. epidermidis which gave an obvious pellet after being stained by crystal violet (Fig. 7c). In contrast, when 4.5 V was applied, no pellet was observed. This significant difference was also verified by counting cells by using a hemocytometer (109 for 0 V and not measurable (< 106) for 4.5 V, Fig. 7d). Since only cells with complete cellular structure can be stained by crystal violet, these results implied that many cells may undergo lysis and occupy no space. Meanwhile, we did not observe the proliferation of bacteria on the IO NWs filter over 5 cycles (Fig. 7b), demonstrating its advantage over conventional air filters.
Fig. 7.
(a) The effect of filter number on the capture ratio. (b) Recycle performance of single IO NWs filter. (c) Digital image of the samples before (left, condition: 0 V, 30 min) and after treatment (right, condition: 4.5 V, 30 min) stained by crystal violet. (d) Corresponding bacterial concentration of (c) measured by a hemocytometer.
XRD, XPS, SEM, and TEM analyses of the used IO NWs filter were also conducted for the filter after five cycles of 1 h operation (Fig. S10). As shown in Fig. S10a, the peaks indexed to Fe2O3 were clearly identified. Meanwhile, XPS spectra of the filter before and after 1 h operation were also found to be similar (Fig. S10b). The SEM (Fig. S10c) and TEM images (Fig. S10d) also verified that the nanowire morphology was maintained after recycle use. The above results demonstrated that the IO NWs filter had a satisfactory structural stability under the experimental conditions.
Conclusion
In summary, we have developed an IO NWs-based filter for the control of indoor bioaerosols. IO NWs are grown on commercially available iron mesh. A log inactivation efficiency of > 7 was achieved towards S. epidermidis within 10 s when the filter was applied with a voltage of 4.5 V. The •OH, the electroporation effect, and the Joule heating were accounted for the rapid inactivation of S. epidermidis. The filter also demonstrated promise of improved capture capability and satisfactory long-term performance. The robust synthesis and satisfactory inactivation performance of the filter make it promising for HVAC filtration systems as an antibacterial layer (e.g. assembled into conventional air filters). We also expect that the filter demonstrated here will benefit some clean water technologies for the control of waterborne bacteria/contaminants.
Supplementary Material
Acknowledgments
We acknowledge the supports from the American Chemical Society Petroleum Research Fund (57072-DNI10) and National Institutes of Health (R01DE023078). We thank Judy Williamson in Microscopy Facility at VCU for her help with the preparation of bacterial samples for SEM and TEM analysis.
Footnotes
The following information was provided in the supplementary: Simulation details and supplementary tables (S1–S2) and figures (S1–S10).
References
- 1.Klepeis NE, Nelson WC, Ott WR, Robinson JP, Tsang AM, Switzer P, Behar JV, Hern SC, Engelmann WH. The National Human Activity Pattern Survey (NHAPS): a resource for assessing exposure to environmental pollutants. J. Expo. Anal. Environ. Epidemiol. 2001;11:231–252. doi: 10.1038/sj.jea.7500165. [DOI] [PubMed] [Google Scholar]
- 2.Dai D, Prussin AJ, Marr LC, Vikesland PJ, Edwards MA, Pruden A. Factors Shaping the Human Exposome in the Built Environment: Opportunities for Engineering Control. Environ. Sci. Technol. 2017;51:7759–7774. doi: 10.1021/acs.est.7b01097. [DOI] [PubMed] [Google Scholar]
- 3.Jones AP. Indoor air quality and health. Atmos. Environ. 1999;33:4535–4564. [Google Scholar]
- 4.Bolashikov ZD, Melikov AK. Methods for air cleaning and protection of building occupants from airborne pathogens. Build Environ. 2009;44:1378–1385. doi: 10.1016/j.buildenv.2008.09.001. [DOI] [PMC free article] [PubMed] [Google Scholar]
- 5.Azimi P, Zhao D, Stephens B. Estimates of HVAC filtration efficiency for fine and ultrafine particles of outdoor origin. Atmos. Environ. 2014;98:337–346. [Google Scholar]
- 6.Möritz M, Peters H, Nipko B, Rüden H. Capability of air filters to retain airborne bacteria and molds in heating, ventilating and air-conditioning (HVAC) systems. Int. J. Hyg. Environ. Health. 2001;203:401–409. doi: 10.1078/1438-4639-00054. [DOI] [PubMed] [Google Scholar]
- 7.Harstad JB, Decker HM, Wedum AG. Use of Ultraviolet Irradiation in a Room Air Conditioner for Removal of Bacteria. Appl. Microbiol. 1954;2:148–151. doi: 10.1128/am.2.3.148-151.1954. [DOI] [PMC free article] [PubMed] [Google Scholar]
- 8.Reed NG. The History of Ultraviolet Germicidal Irradiation for Air Disinfection. Public Health Reports. 2010;125:15–27. doi: 10.1177/003335491012500105. [DOI] [PMC free article] [PubMed] [Google Scholar]
- 9.Hu X, Hu C, Peng T, Zhou X, Qu J. Plasmon-Induced Inactivation of Enteric Pathogenic Microorganisms with Ag−AgI/Al2O3 under Visible-Light Irradiation. Environ. Sci. Technol. 2010;44:7058–7062. doi: 10.1021/es1012577. [DOI] [PubMed] [Google Scholar]
- 10.Shi H, Li G, Sun H, An T, Zhao H, Wong P-K. Visible-light-driven photocatalytic inactivation of E. coli by Ag/AgX-CNTs (X=Cl, Br, I) plasmonic photocatalysts: Bacterial performance and deactivation mechanism. Appl. Catal., B. 2014;158:301–307. [Google Scholar]
- 11.Vohra A, Goswami DY, Deshpande DA, Block SS. Enhanced photocatalytic disinfection of indoor air. Appl. Catal., B. 2006;64:57–65. [Google Scholar]
- 12.Liang Y, Wu Y, Sun K, Chen Q, Shen F, Zhang J, Yao M, Zhu T, Fang J. Rapid Inactivation of Biological Species in the Air using Atmospheric Pressure Nonthermal Plasma. Environ. Sci. Technol. 2012;46:3360–3368. doi: 10.1021/es203770q. [DOI] [PubMed] [Google Scholar]
- 13.Wu Y, Liang Y, Wei K, Li W, Yao M, Zhang J, Grinshpun SA. MS2 Virus Inactivation by Atmospheric-Pressure Cold Plasma Using Different Gas Carriers and Power Levels. Appl. Environ. Microbiol. 2015;81:996–1002. doi: 10.1128/AEM.03322-14. [DOI] [PMC free article] [PubMed] [Google Scholar]
- 14.Zhang H, Yang L, Yu Z, Huang Q. Inactivation of Microcystis aeruginosa by DC glow discharge plasma: Impacts on cell integrity, pigment contents and microcystins degradation. J. Hazard. Mater. 2014;268:33–42. doi: 10.1016/j.jhazmat.2014.01.001. [DOI] [PubMed] [Google Scholar]
- 15.Zhang Q, Damit B, Welch J, Park H, Wu C-Y, Sigmund W. Microwave assisted nanofibrous air filtration for disinfection of bioaerosols. J. Aerosol Sci. 2010;41:880–888. doi: 10.1016/j.jaerosci.2010.06.001. [DOI] [PMC free article] [PubMed] [Google Scholar]
- 16.Woo M-H, Grippin A, Wu C-Y, Wander J. Microwave-irradiation-assisted HVAC Filtration for Inactivation of Viral Aerosols. Aerosol Air Qual. Res. 2012;12:295–303. [Google Scholar]
- 17.Yale CE, Vivek AR. Air Filters for Germ-free Isolators. Appl. Microbiol. 1968;16:1650–1654. doi: 10.1128/am.16.11.1650-1654.1968. [DOI] [PMC free article] [PubMed] [Google Scholar]
- 18.Miaskiewicz-Peska E, Lebkowska M. Effect of antimicrobial air filter treatment on bacterial survival. Fibres Text. East. Eur. 2011;19:73–77. [Google Scholar]
- 19.Del Curto B, Tarsini P, Cigada A. Development of a photocatalytic filter to control indoor air quality. J. Appl. Biomater. Funct. Mater. 2016;14:e496–e501. doi: 10.5301/jabfm.5000336. [DOI] [PubMed] [Google Scholar]
- 20.Joe YH, Park DH, Hwang J. Evaluation of Ag nanoparticle coated air filter against aerosolized virus: Anti-viral efficiency with dust loading. J. Hazard. Mater. 2016;301:547–553. doi: 10.1016/j.jhazmat.2015.09.017. [DOI] [PMC free article] [PubMed] [Google Scholar]
- 21.Ko Y-S, Joe YH, Seo M, Lim K, Hwang J, Woo K. Prompt and synergistic antibacterial activity of silver nanoparticle-decorated silica hybrid particles on air filtration. J. Mater. Chem. B. 2014;2:6714–6722. doi: 10.1039/c4tb01068j. [DOI] [PubMed] [Google Scholar]
- 22.Fu Y, Chen J, Zhang H. Synthesis of Fe2O3 nanowires by oxidation of iron. Chem. Phys. Lett. 2001;350:491–494. [Google Scholar]
- 23.Park CW, Hwang J. Susceptibility constants of airborne bacteria to dielectric barrier discharge for antibacterial performance evaluation. J. Hazard. Mater. 2013;244:421–428. doi: 10.1016/j.jhazmat.2012.12.006. [DOI] [PMC free article] [PubMed] [Google Scholar]
- 24.Huo Z-Y, Xie X, Yu T, Lu Y, Feng C, Hu H-Y. Nanowire-Modified Three-Dimensional Electrode Enabling Low-Voltage Electroporation for Water Disinfection. Environ. Sci. Technol. 2016;50:7641–7649. doi: 10.1021/acs.est.6b01050. [DOI] [PubMed] [Google Scholar]
- 25.Wang W, Ng TW, Ho WK, Huang J, Liang S, An T, Li G, Yu JC, Wong PK. CdIn2S4 microsphere as an efficient visible-light-driven photocatalyst for bacterial inactivation: Synthesis, characterizations and photocatalytic inactivation mechanisms. Appl. Catal., B. 2013;129:482–490. [Google Scholar]
- 26.Wang D, Gilliland SE, Yi X, Logan K, Heitger DR, Lucas HR, Wang W-N. Iron Mesh-Based Metal Organic Framework Filter for Efficient Arsenic Removal. Environ. Sci. Technol. 2018 doi: 10.1021/acs.est.7b06212. [DOI] [PubMed] [Google Scholar]
- 27.Yuan L, Wang Y, Cai R, Jiang Q, Wang J, Li B, Sharma A, Zhou G. The origin of hematite nanowire growth during the thermal oxidation of iron. Mater. Sci. Eng. B. 2012;177:327–336. [Google Scholar]
- 28.Zhang Q, Ma R, Tian Y, Su B, Wang K, Yu S, Zhang J, Fang J. Sterilization Efficiency of a Novel Electrochemical Disinfectant against Staphylococcus aureus. Environ. Sci. Technol. 2016;50:3184–3192. doi: 10.1021/acs.est.5b05108. [DOI] [PubMed] [Google Scholar]
- 29.Al-Hashimi AM, Mason TJ, Joyce EM. Combined Effect of Ultrasound and Ozone on Bacteria in Water. Environ. Sci. Technol. 2015;49:11697–11702. doi: 10.1021/es5045437. [DOI] [PubMed] [Google Scholar]
- 30.Nie X, Liu W, Chen M, Liu M, Ao L. Flow cytometric assessment of the effects of chlorine, chloramine, and UV on bacteria by using nucleic acid stains and 5-cyano-2,3-ditolyltetrazolium chloride. Front. Environ. Sci. Eng. 2016;10:12. [Google Scholar]
- 31.Naumann D, Helm D, Labischinski H. Microbiological characterizations by FT-IR spectroscopy. Nature. 1991;351:81–82. doi: 10.1038/351081a0. [DOI] [PubMed] [Google Scholar]
- 32.Singh RK, Philip L, Ramanujam S. Disinfection of water by pulsed power technique: a mechanistic perspective. RSC Adv. 2016;6:11980–11990. [Google Scholar]
- 33.Helm D, Labischinski H, Schallehn G, Naumann D. Classification and identification of bacteria by Fourier-transform infrared spectroscopy. Microbiology. 1991;137:69–79. doi: 10.1099/00221287-137-1-69. [DOI] [PubMed] [Google Scholar]
- 34.Ishibashi K-i, Fujishima A, Watanabe T, Hashimoto K. Detection of active oxidative species in TiO2 photocatalysis using the fluorescence technique. Electrochem. Commun. 2000;2:207–210. [Google Scholar]
- 35.Cai C, Zhang Z, Liu J, Shan N, Zhang H, Dionysiou DD. Visible light-assisted heterogeneous Fenton with ZnFe2O4 for the degradation of Orange II in water. Appl. Catal., B. 2016;182:456–468. [Google Scholar]
- 36.Liu Y, Liu X, Zhao Y, Dionysiou DD. Aligned α-FeOOH nanorods anchored on a graphene oxide-carbon nanotubes aerogel can serve as an effective Fenton-like oxidation catalyst. Appl. Catal., B. 2017;213:74–86. [Google Scholar]
- 37.Shi J, Ai Z, Zhang L. Fe@Fe2O3 core-shell nanowires enhanced Fenton oxidation by accelerating the Fe(III)/Fe(II) cycles. Water Res. 2014;59:145–153. doi: 10.1016/j.watres.2014.04.015. [DOI] [PubMed] [Google Scholar]
- 38.Casado J, Fornaguera J, Galán MI. Mineralization of aromatics in water by sunlight-assisted electro-Fenton technology in a pilot reactor. Environ. Sci. Technol. 2005;39:1843–1847. doi: 10.1021/es0498787. [DOI] [PubMed] [Google Scholar]
- 39.Lim H, Lee J, Jin S, Kim J, Yoon J, Hyeon T. Highly active heterogeneous Fenton catalyst using iron oxide nanoparticles immobilized in alumina coated mesoporous silica. Chem. Commun. 2006;4:463–465. doi: 10.1039/b513517f. [DOI] [PubMed] [Google Scholar]
- 40.Rizzo L, Della Sala A, Fiorentino A, Li Puma G. Disinfection of urban wastewater by solar driven and UV lamp – TiO2 photocatalysis: Effect on a multi drug resistant Escherichia coli strain. Water Res. 2014;53:145–152. doi: 10.1016/j.watres.2014.01.020. [DOI] [PubMed] [Google Scholar]
- 41.García-Fernández I, Polo-López MI, Oller I, Fernández-Ibáñez P. Bacteria and fungi inactivation using Fe3+/sunlight, H2O2/sunlight and near neutral photo-Fenton: A comparative study. Appl. Catal., B. 2012;121:20–29. [Google Scholar]
- 42.Goodman AL, Bernard ET, Grassian VH. Spectroscopic Study of Nitric Acid and Water Adsorption on Oxide Particles: Enhanced Nitric Acid Uptake Kinetics in the Presence of Adsorbed Water. J. Phys. Chem. A. 2001;105:6443–6457. [Google Scholar]
- 43.Wang W, Li G, Xia D, An T, Zhao H, Wong PK. Photocatalytic nanomaterials for solar-driven bacterial inactivation: recent progress and challenges. Environ. Sci. Nano. 2017;4:782–799. [Google Scholar]
- 44.Li Y, Zhang C, Shuai D, Naraginti S, Wang D, Zhang W. Visible-light-driven photocatalytic inactivation of MS2 by metal-free g-C3N4: Virucidal performance and mechanism. Water Res. 2016;106:249–258. doi: 10.1016/j.watres.2016.10.009. [DOI] [PubMed] [Google Scholar]
- 45.Hong Y, Li L, Luan G, Drlica K, Zhao X. Contribution of reactive oxygen species to thymineless death in Escherichia coli. Nat. Microbiol. 2017;2:1667–1675. doi: 10.1038/s41564-017-0037-y. [DOI] [PMC free article] [PubMed] [Google Scholar]
- 46.Moats WA. Kinetics of Thermal Death of Bacteria. J. Bacteriol. 1971;105:165–171. doi: 10.1128/jb.105.1.165-171.1971. [DOI] [PMC free article] [PubMed] [Google Scholar]
- 47.Yao M, Mainelis G, An HR. Inactivation of Microorganisms Using Electrostatic Fields. Environ. Sci. Technol. 2005;39:3338–3344. doi: 10.1021/es048808x. [DOI] [PubMed] [Google Scholar]
- 48.Liu C, Xie X, Zhao W, Liu N, Maraccini PA, Sassoubre LM, Boehm AB, Cui Y. Conducting Nanosponge Electroporation for Affordable and High-Efficiency Disinfection of Bacteria and Viruses in Water. Nano Lett. 2013;13:4288–4293. doi: 10.1021/nl402053z. [DOI] [PubMed] [Google Scholar]
- 49.Kotnik T, Frey W, Sack M, Haberl Meglič S, Peterka M, Miklavčič D. Electroporation-based applications in biotechnology. Trends Biotechnol. 2015;33:480–488. doi: 10.1016/j.tibtech.2015.06.002. [DOI] [PubMed] [Google Scholar]
Associated Data
This section collects any data citations, data availability statements, or supplementary materials included in this article.


